| Param | Original file | Final file |
|---|---|---|
| Filename | modeM0/AS1A05_072T02_9000002736_18468cztM0_level2.evt | modeM0/AS1A05_072T02_9000002736_18468cztM0_level2_quad_clean.evt |
| Size (bytes) | 470,903,040 | 108,933,120 |
| Size | 449.1 MB | 103.9 MB |
| Events in quadrant A | 3,452,981 | 716,230 |
| Events in quadrant B | 3,843,445 | 735,373 |
| Events in quadrant C | 3,263,250 | 718,647 |
| Events in quadrant D | 3,278,294 | 693,709 |
| Mode M0 | |||
|---|---|---|---|
| Quadrant | BADHDUFLAG | Total packets | Discarded packets |
| A | 0 | 14252 | 2 |
| B | 0 | 15439 | 2 |
| C | 0 | 13612 | 2 |
| D | 0 | 13867 | 2 |
| Mode M9 | |||
|---|---|---|---|
| Quadrant | BADHDUFLAG | Total packets | Discarded packets |
| A | 0 | 20 | 0 |
| B | 0 | 21 | 0 |
| C | 0 | 21 | 0 |
| D | 0 | 21 | 0 |
| Mode SS | |||
|---|---|---|---|
| Quadrant | BADHDUFLAG | Total packets | Discarded packets |
| A | 0 | 126 | 0 |
| B | 0 | 126 | 0 |
| C | 0 | 126 | 0 |
| D | 0 | 126 | 0 |
| Quadrant | Total seconds | Saturated seconds | Saturation percentage |
|---|---|---|---|
| A | 6239 | 66 | 1.057862% |
| B | 6238 | 218 | 3.494710% |
| C | 6238 | 67 | 1.074062% |
| D | 6238 | 33 | 0.529016% |
Noise dominated data is calculated using 1-second bins in cleaned event files. If a bin has >2000 counts, and if more than 50% of those come from <1% of pixels, then it is considered to be noise-dominated and hence unusable.
| Quadrant | # 1 sec bins | Bins with >0 counts | Bins with >2000 counts | High rate bins dominated by noise | Noise dominated (total time) | Noise dominated (detector-on time) | Marked lightcurve |
|---|---|---|---|---|---|---|---|
| A | 7584 | 6239 | 17 | 17 | 0.22% | 0.27% | 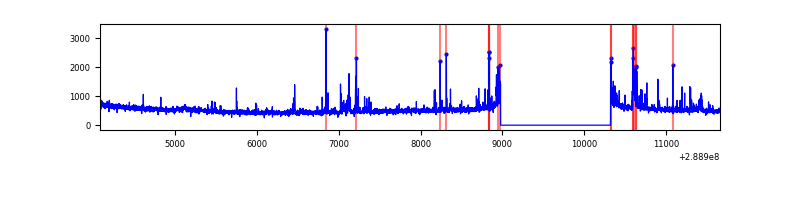 |
| B | 7583 | 6239 | 117 | 117 | 1.54% | 1.88% | 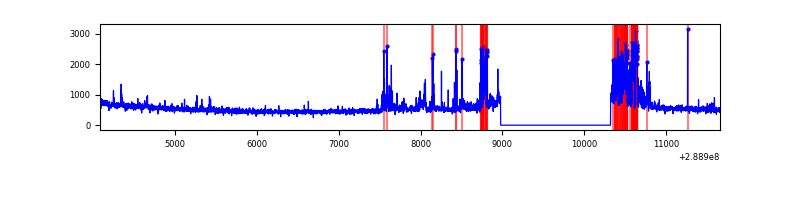 |
| C | 7583 | 6239 | 0 | 0 | 0.00% | 0.00% | 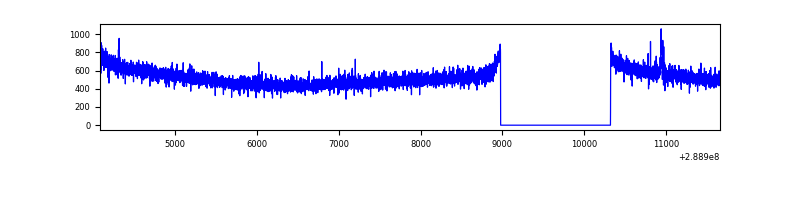 |
| D | 7583 | 6239 | 20 | 20 | 0.26% | 0.32% | 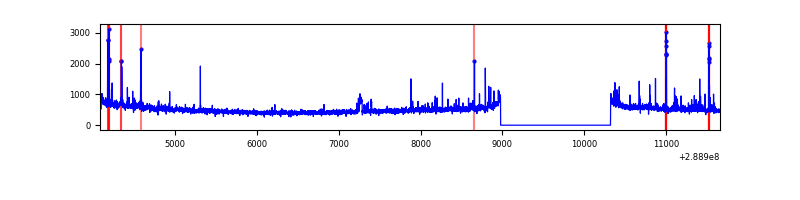 |
Top three noisy pixels from each quadrant. If the there are fewer than three noisy pixels in the level2.evt file, extra rows are filled as -1
| Pixel properties | Quadrant properties | ||||||
|---|---|---|---|---|---|---|---|
| Quadrant | DetID | PixID | Counts | Sigma | Mean | Median | Sigma |
| A | 0 | 13 | 279527 | 1712.96 | 812 | 797 | 162.7 |
| A | 15 | 174 | 40091 | 241.49 | 812 | 797 | 162.7 |
| A | 13 | 254 | 7682 | 42.31 | 812 | 797 | 162.7 |
| B | 10 | 245 | 605430 | 3926.31 | 817 | 799 | 154.0 |
| B | 12 | 111 | 17334 | 107.37 | 817 | 799 | 154.0 |
| B | 11 | 111 | 14994 | 92.18 | 817 | 799 | 154.0 |
| C | 14 | 238 | 124810 | 668.06 | 798 | 806 | 185.6 |
| C | 9 | 54 | 13560 | 68.71 | 798 | 806 | 185.6 |
| C | 3 | 233 | 12250 | 61.65 | 798 | 806 | 185.6 |
| D | 7 | 96 | 46600 | 237.01 | 799 | 778 | 193.3 |
| D | 7 | 38 | 43585 | 221.41 | 799 | 778 | 193.3 |
| D | 8 | 230 | 31818 | 160.55 | 799 | 778 | 193.3 |
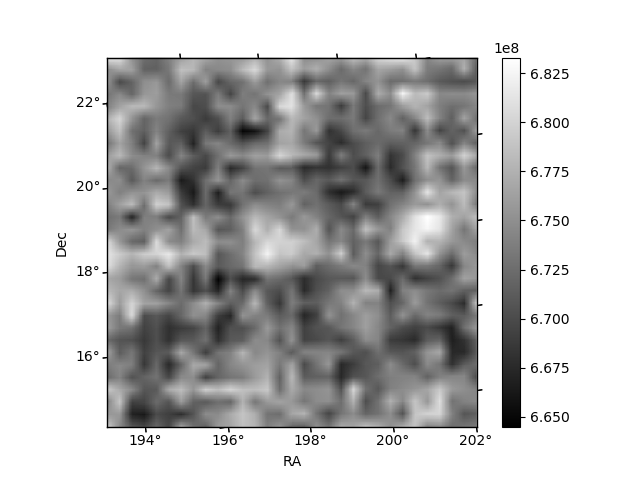
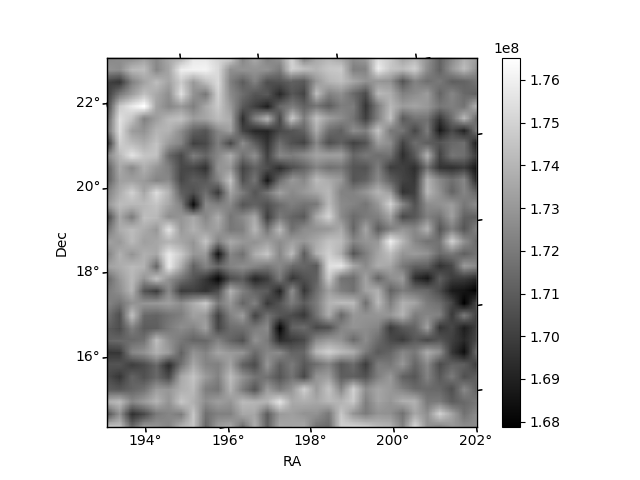
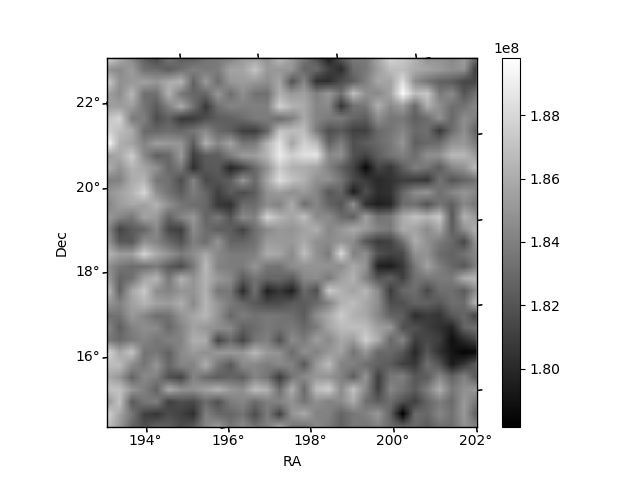
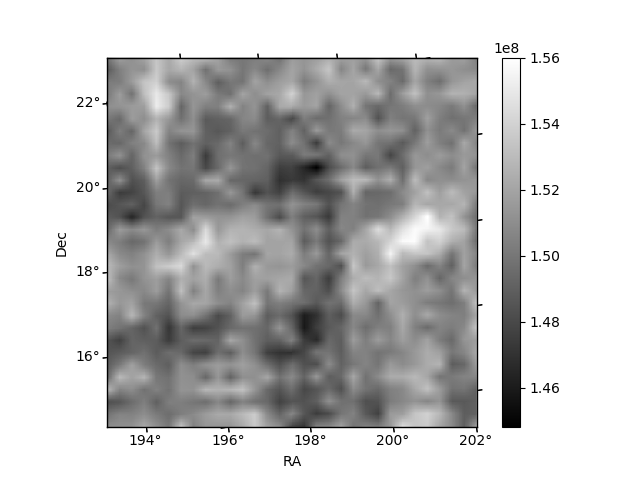
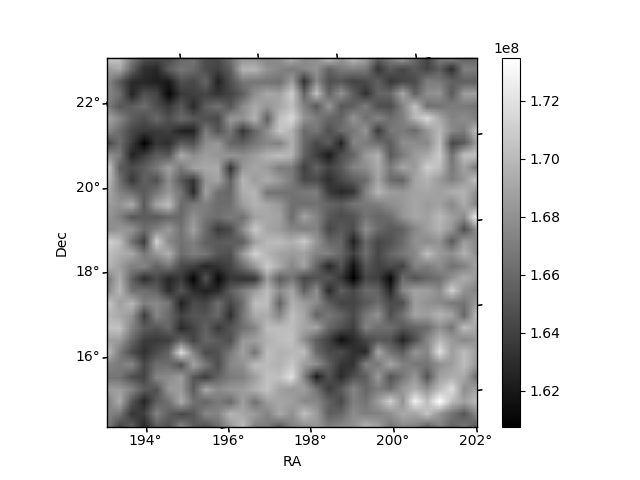
Histogram calculated using DETX and DETY for each event in the final _common_clean file
| Quadrant A | 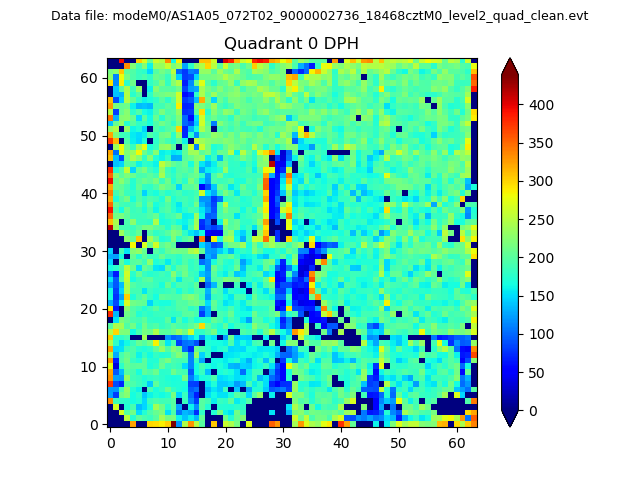 |
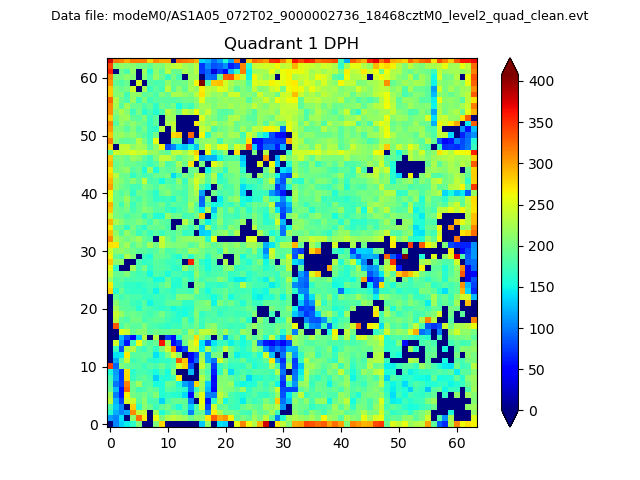 |
Quadrant B |
|---|---|---|---|
| Quadrant D | 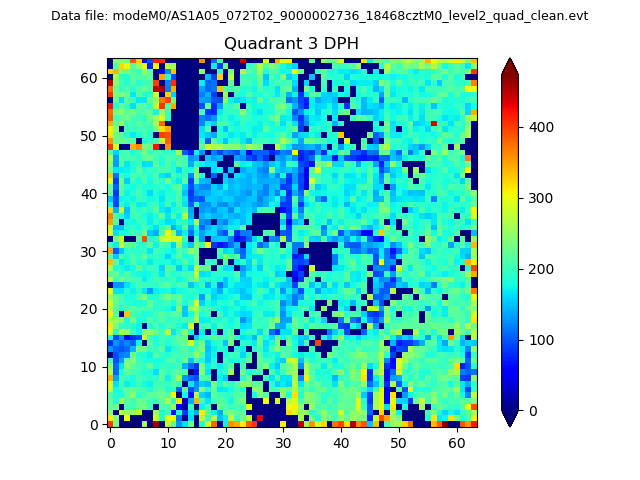 |
 |
Quadrant C |
| Plot type | Count rate plots | Images |
|---|---|---|
| Comparison with Poisson distribution Blue bars denote a histogram of data divided into 1 sec bins. Red curve is a Poisson curve with rate = median count rate of data. |
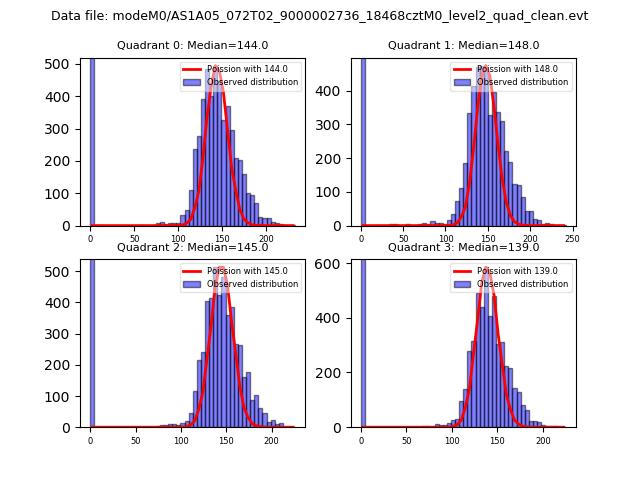 |
 |
| Quadrant-wise count rates Data is divided into 100 sec bins |
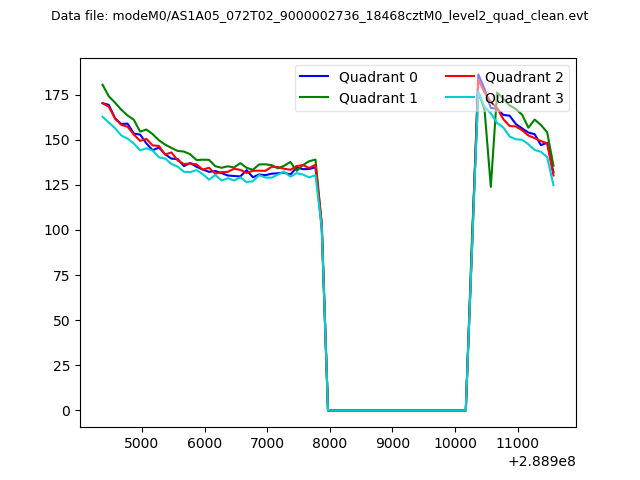 |
|
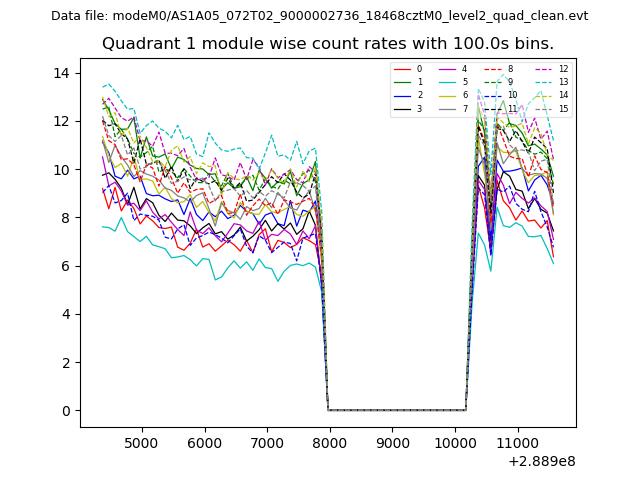
| Module-wise count rates for Quadrant A Data is divided into 100 sec bins |
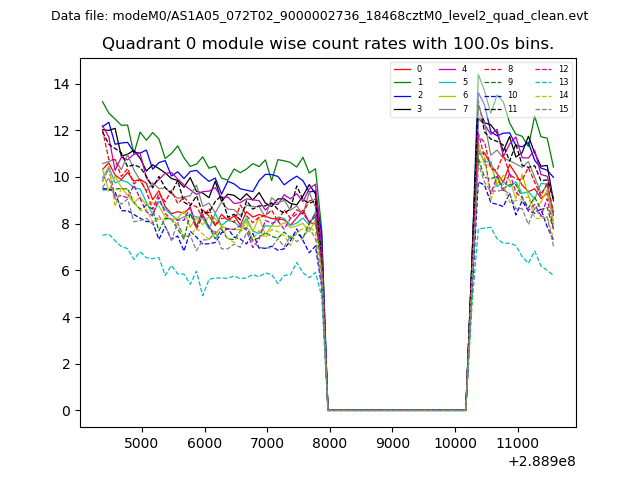 |
 |
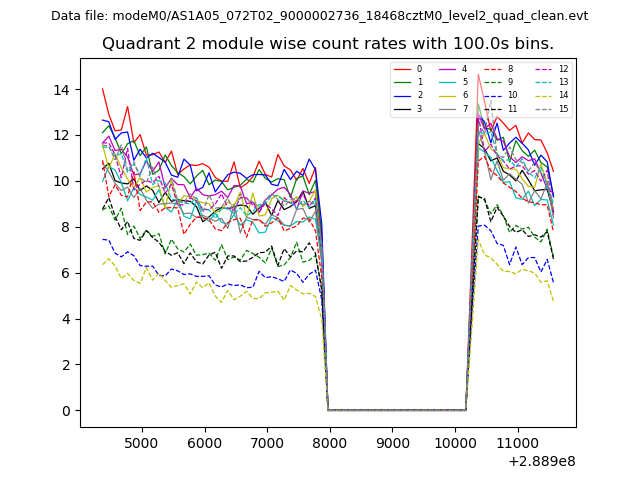
| Module-wise count rates for Quadrant B Data is divided into 100 sec bins |
 |
 |
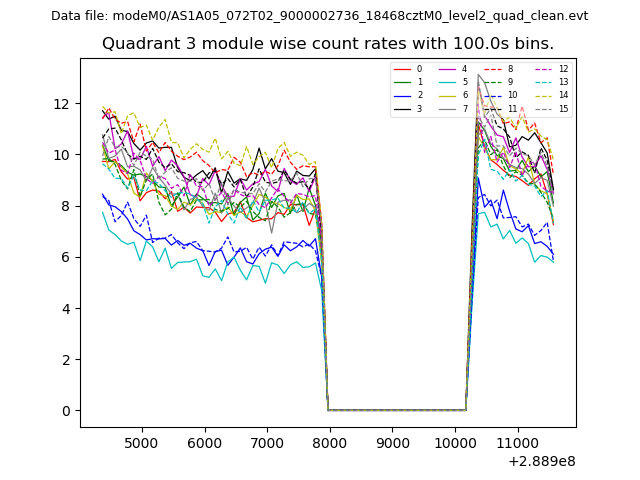
| Module-wise count rates for Quadrant C Data is divided into 100 sec bins |
 |
 |
| Module-wise count rates for Quadrant D Data is divided into 100 sec bins |
 |
 |
| Parameter | Plot |
|---|---|
| CZT HV Monitor | 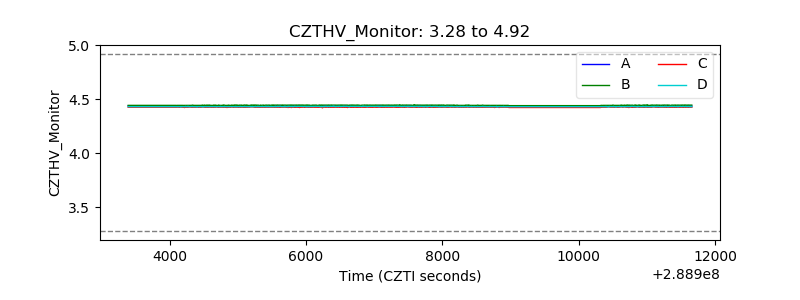 |
| D_VDD | 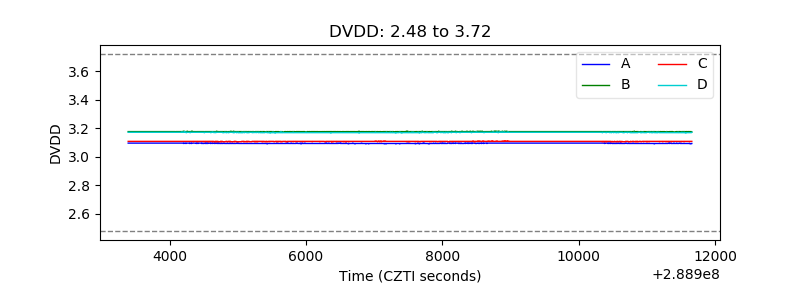 |
| Temperature 1 | 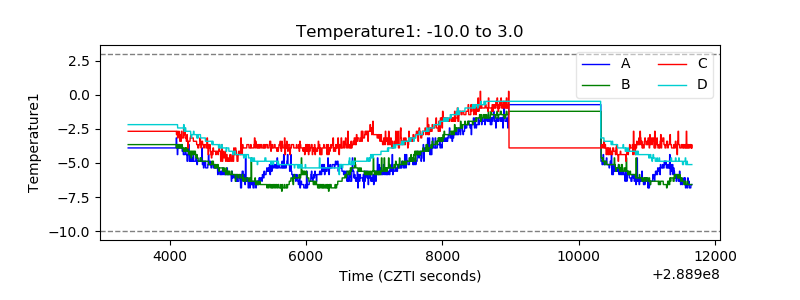 |
| Veto HV Monitor | 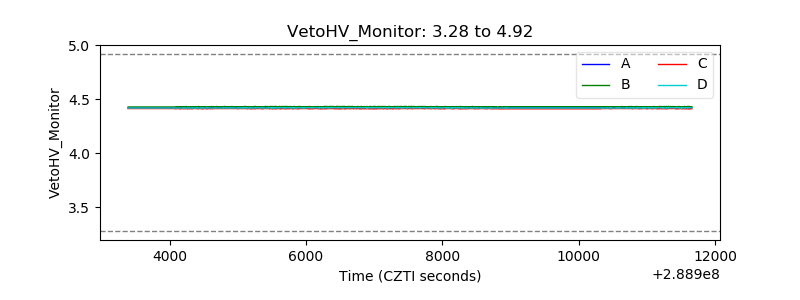 |
| Veto LLD | 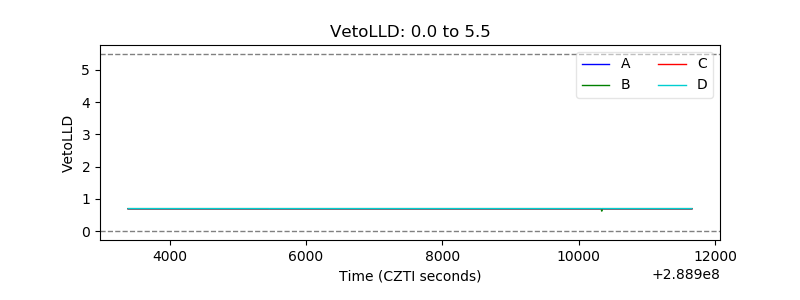 |
| Alpha Counter | 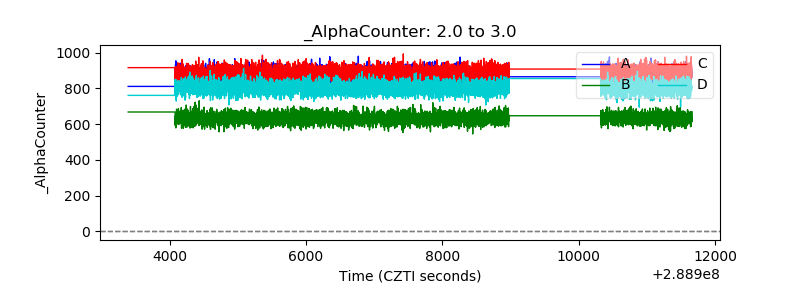 |
| _CPM_Rate | 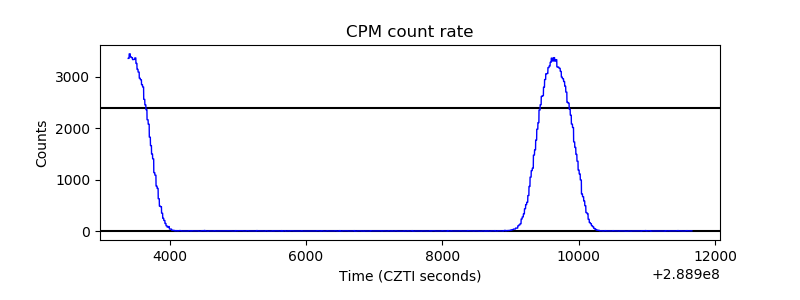 |
| CZT Counter | 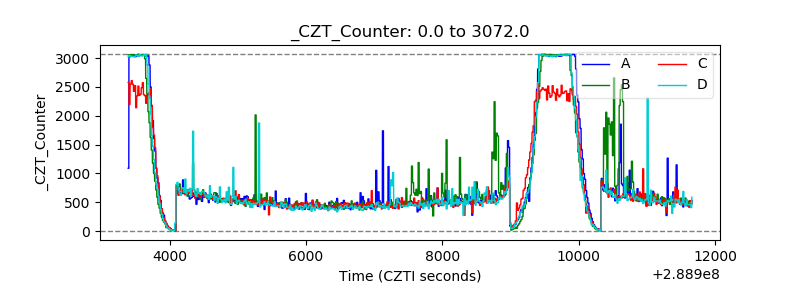 |
| +2.5 Volts monitor |  |
| +5 Volts monitor | 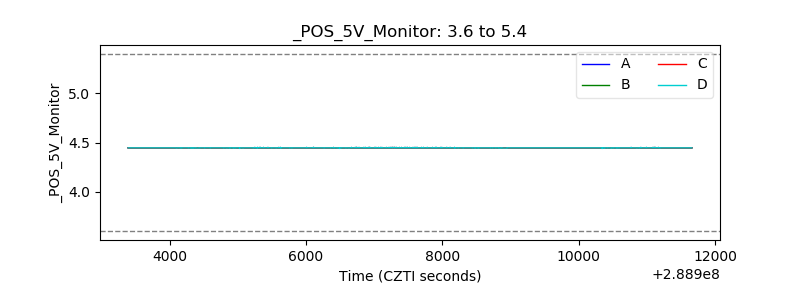 |
| _ROLL_ROT | 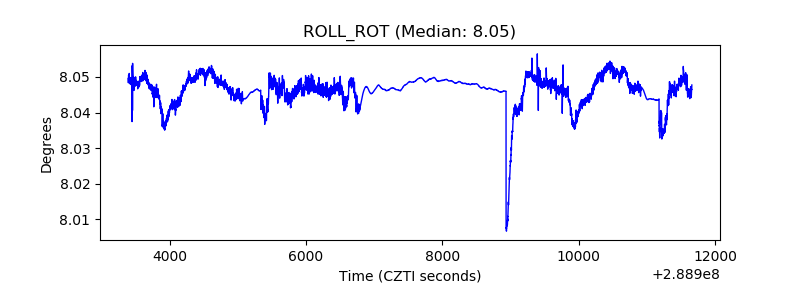 |
| _Roll_DEC |  |
| _Roll_RA | 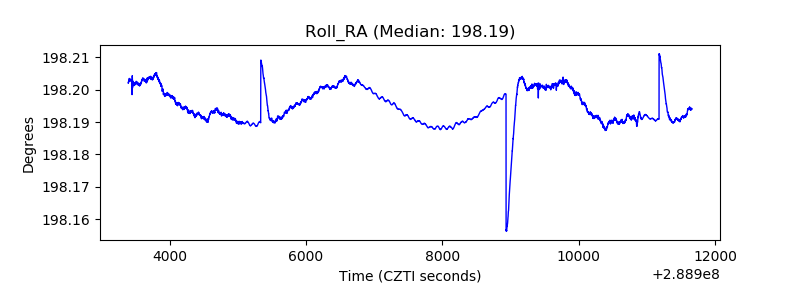 |
| Veto Counter | 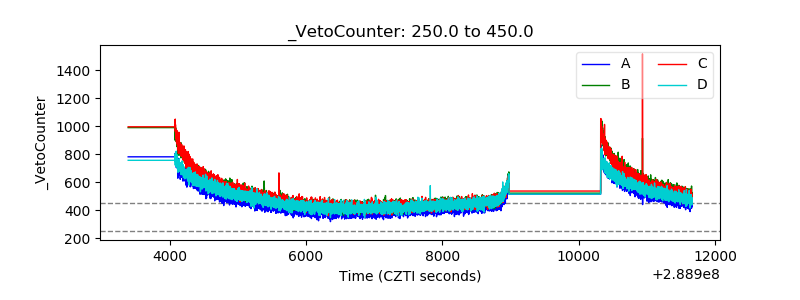 |