| Param | Original file | Final file |
|---|---|---|
| Filename | modeM0/AS1A05_072T02_9000002736_18470cztM0_level2.evt | modeM0/AS1A05_072T02_9000002736_18470cztM0_level2_quad_clean.evt |
| Size (bytes) | 507,199,680 | 102,968,640 |
| Size | 483.7 MB | 98.2 MB |
| Events in quadrant A | 4,018,512 | 664,612 |
| Events in quadrant B | 4,000,667 | 699,521 |
| Events in quadrant C | 3,305,986 | 663,055 |
| Events in quadrant D | 3,593,144 | 636,685 |
| Mode M0 | |||
|---|---|---|---|
| Quadrant | BADHDUFLAG | Total packets | Discarded packets |
| A | 0 | 16213 | 2 |
| B | 0 | 16061 | 2 |
| C | 0 | 13833 | 2 |
| D | 0 | 15021 | 2 |
| Mode M9 | |||
|---|---|---|---|
| Quadrant | BADHDUFLAG | Total packets | Discarded packets |
| A | 0 | 18 | 0 |
| B | 0 | 19 | 0 |
| C | 0 | 19 | 0 |
| D | 0 | 19 | 0 |
| Mode SS | |||
|---|---|---|---|
| Quadrant | BADHDUFLAG | Total packets | Discarded packets |
| A | 0 | 132 | 0 |
| B | 0 | 132 | 0 |
| C | 0 | 132 | 0 |
| D | 0 | 132 | 0 |
| Quadrant | Total seconds | Saturated seconds | Saturation percentage |
|---|---|---|---|
| A | 6519 | 223 | 3.420770% |
| B | 6519 | 253 | 3.880963% |
| C | 6518 | 104 | 1.595581% |
| D | 6518 | 106 | 1.626266% |
Noise dominated data is calculated using 1-second bins in cleaned event files. If a bin has >2000 counts, and if more than 50% of those come from <1% of pixels, then it is considered to be noise-dominated and hence unusable.
| Quadrant | # 1 sec bins | Bins with >0 counts | Bins with >2000 counts | High rate bins dominated by noise | Noise dominated (total time) | Noise dominated (detector-on time) | Marked lightcurve |
|---|---|---|---|---|---|---|---|
| A | 7809 | 6519 | 111 | 111 | 1.42% | 1.70% | 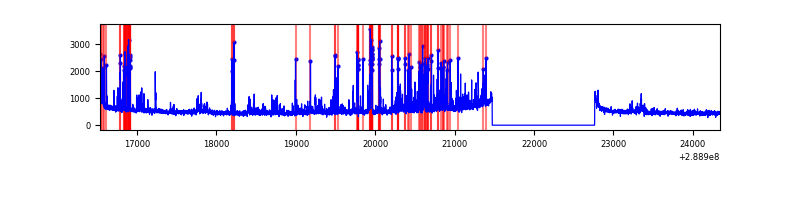 |
| B | 7809 | 6519 | 105 | 105 | 1.34% | 1.61% | 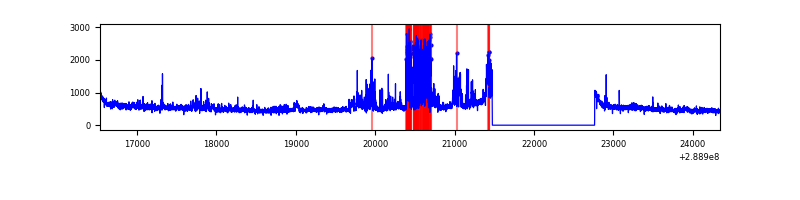 |
| C | 7808 | 6519 | 6 | 6 | 0.08% | 0.09% | 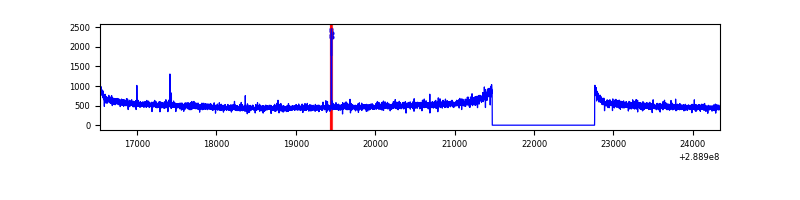 |
| D | 7808 | 6519 | 72 | 72 | 0.92% | 1.10% | 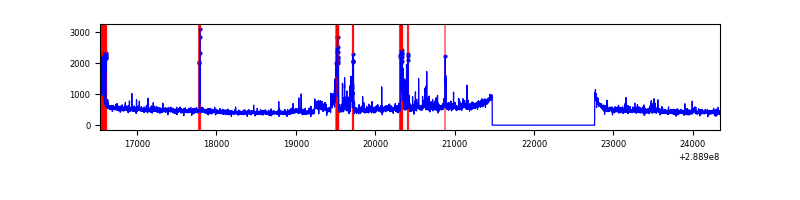 |
Top three noisy pixels from each quadrant. If the there are fewer than three noisy pixels in the level2.evt file, extra rows are filled as -1
| Pixel properties | Quadrant properties | ||||||
|---|---|---|---|---|---|---|---|
| Quadrant | DetID | PixID | Counts | Sigma | Mean | Median | Sigma |
| A | 0 | 13 | 607333 | 3650.52 | 828 | 812 | 166.1 |
| A | 15 | 174 | 108694 | 649.32 | 828 | 812 | 166.1 |
| A | 4 | 2 | 101019 | 603.12 | 828 | 812 | 166.1 |
| B | 10 | 245 | 676574 | 4226.29 | 839 | 819 | 159.9 |
| B | 12 | 111 | 18420 | 110.08 | 839 | 819 | 159.9 |
| B | 11 | 111 | 15930 | 94.51 | 839 | 819 | 159.9 |
| C | 14 | 238 | 127759 | 677.05 | 809 | 817 | 187.5 |
| C | 9 | 54 | 21912 | 112.51 | 809 | 817 | 187.5 |
| C | 13 | 61 | 5834 | 26.76 | 809 | 817 | 187.5 |
| D | 7 | 238 | 228098 | 1164.1 | 806 | 786 | 195.3 |
| D | 13 | 249 | 125271 | 637.51 | 806 | 786 | 195.3 |
| D | 12 | 110 | 75094 | 380.54 | 806 | 786 | 195.3 |
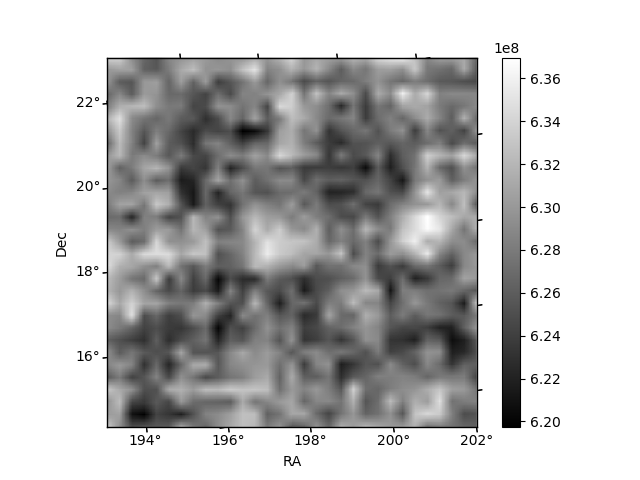
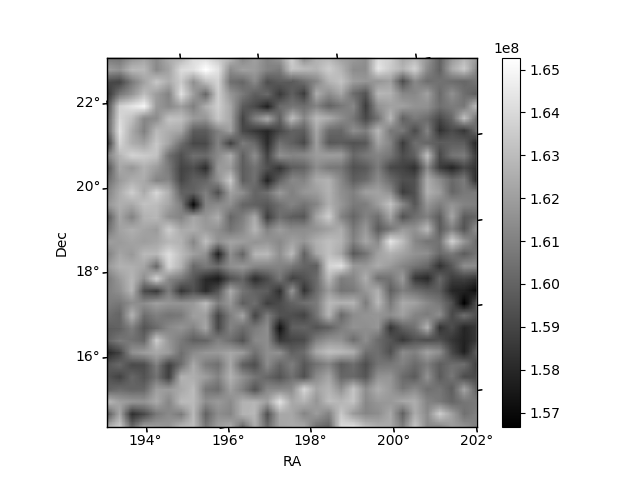
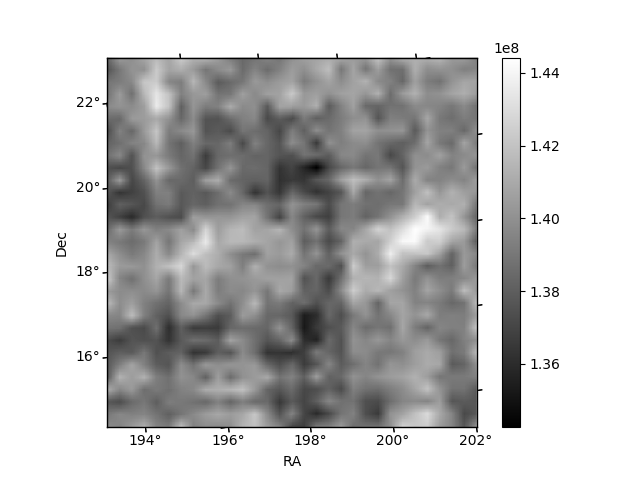
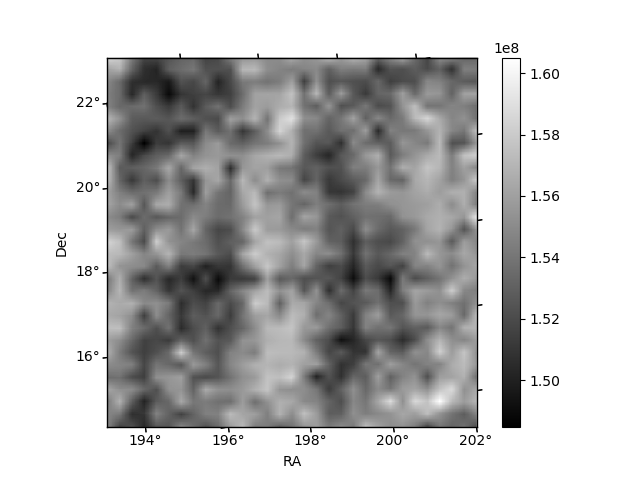
Histogram calculated using DETX and DETY for each event in the final _common_clean file
| Quadrant A | 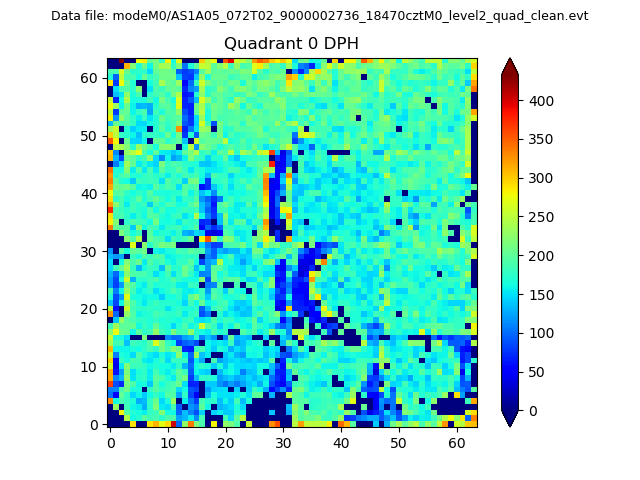 |
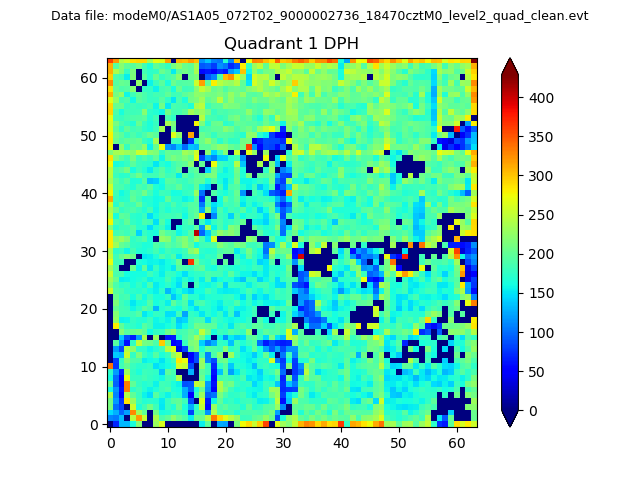 |
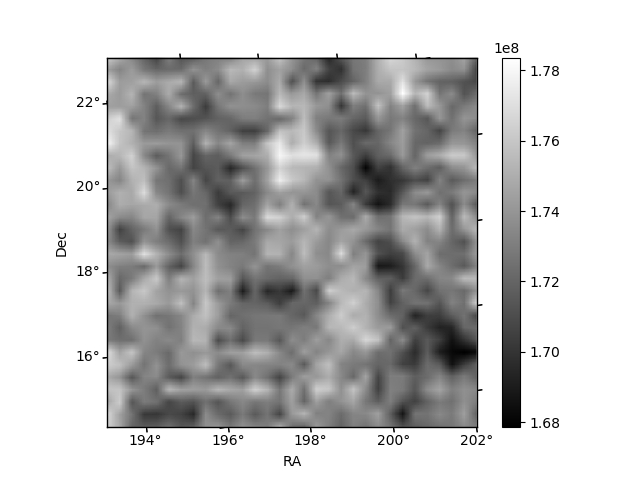
Quadrant B |
|---|---|---|---|
| Quadrant D | 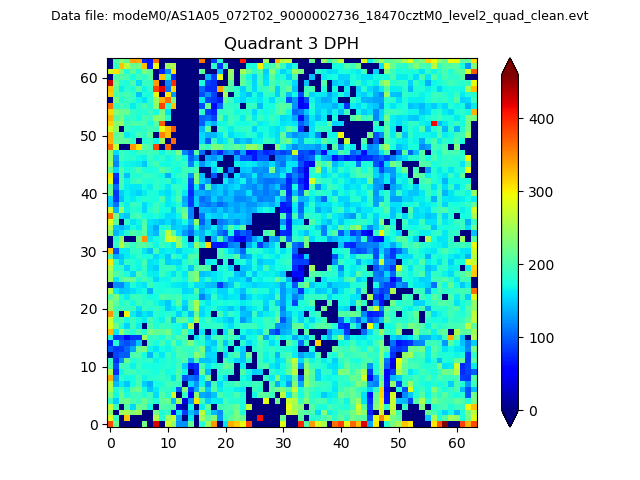 |
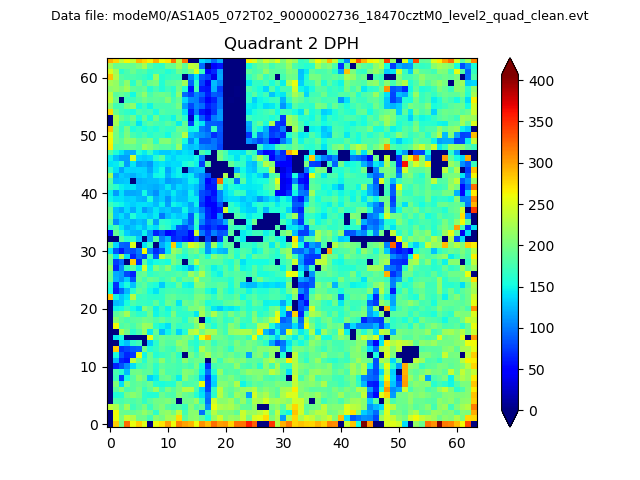 |
Quadrant C |
| Plot type | Count rate plots | Images |
|---|---|---|
| Comparison with Poisson distribution Blue bars denote a histogram of data divided into 1 sec bins. Red curve is a Poisson curve with rate = median count rate of data. |
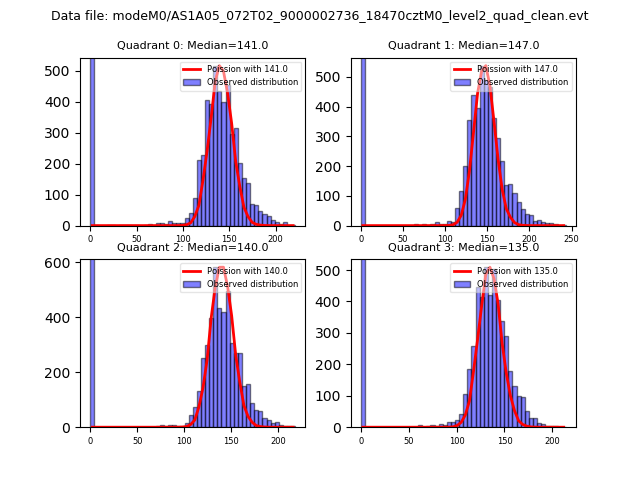 |
 |
| Quadrant-wise count rates Data is divided into 100 sec bins |
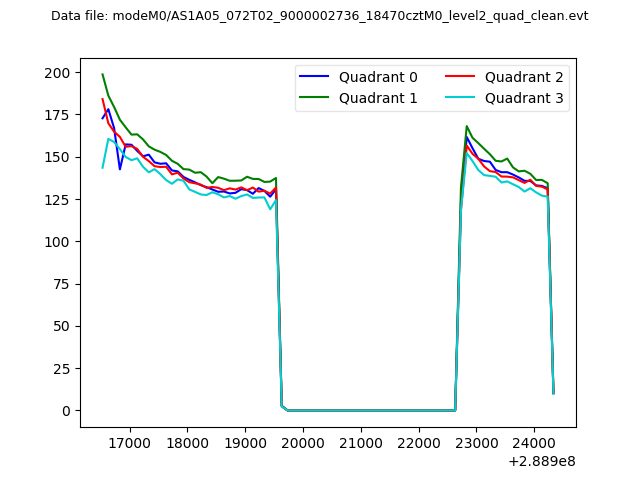 |
|
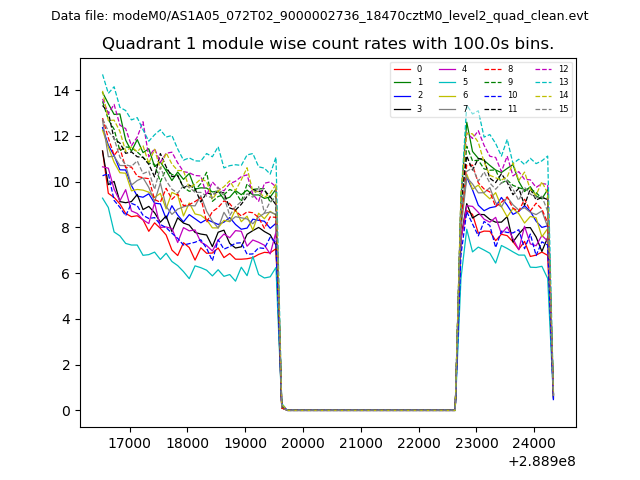
| Module-wise count rates for Quadrant A Data is divided into 100 sec bins |
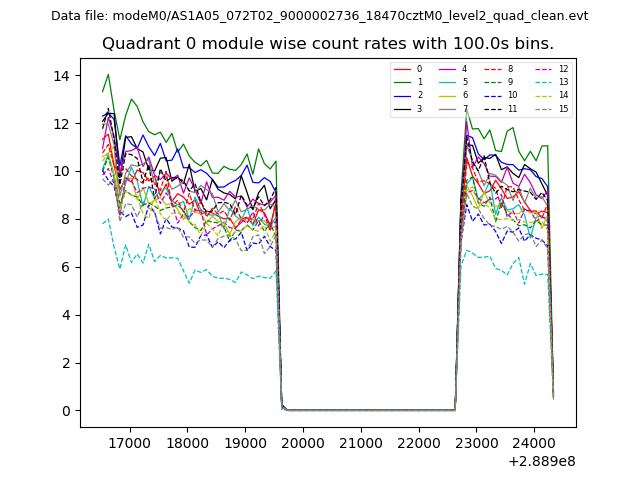 |
 |
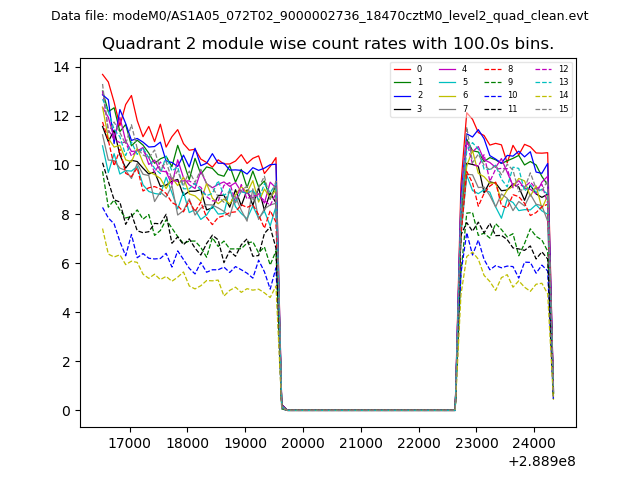
| Module-wise count rates for Quadrant B Data is divided into 100 sec bins |
 |
 |
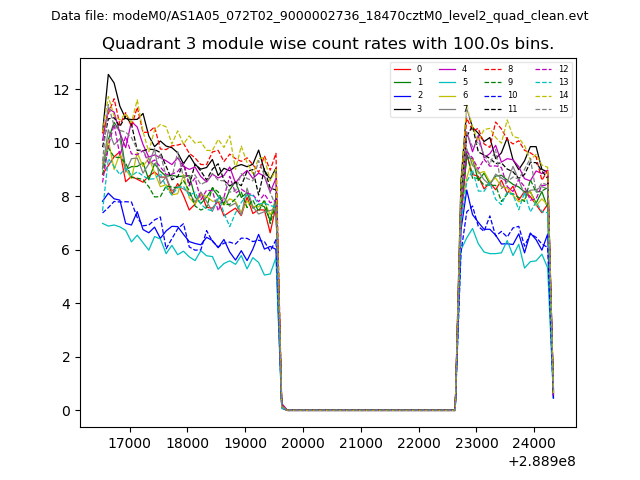
| Module-wise count rates for Quadrant C Data is divided into 100 sec bins |
 |
 |
| Module-wise count rates for Quadrant D Data is divided into 100 sec bins |
 |
 |
| Parameter | Plot |
|---|---|
| CZT HV Monitor | 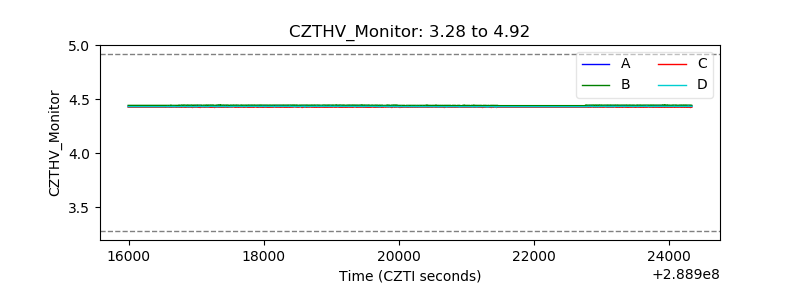 |
| D_VDD | 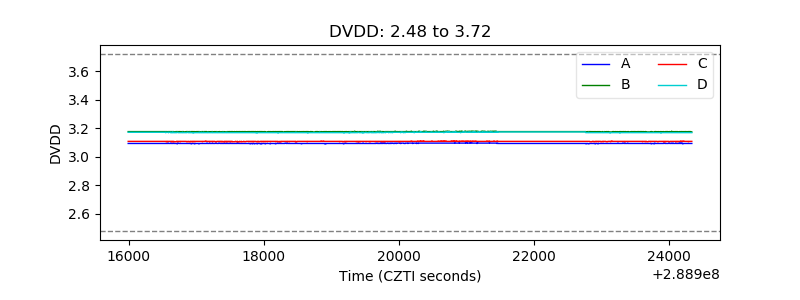 |
| Temperature 1 | 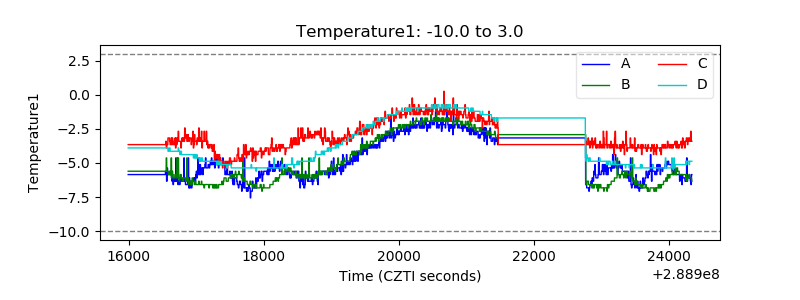 |
| Veto HV Monitor | 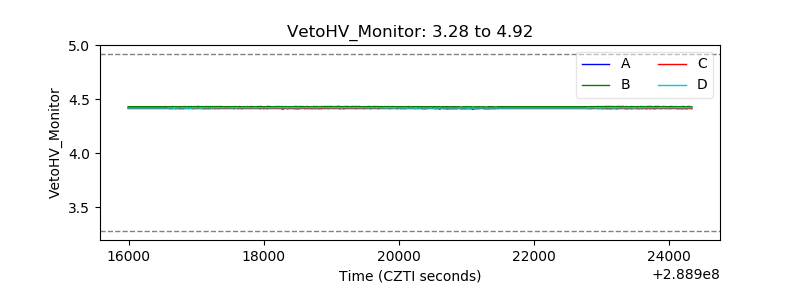 |
| Veto LLD | 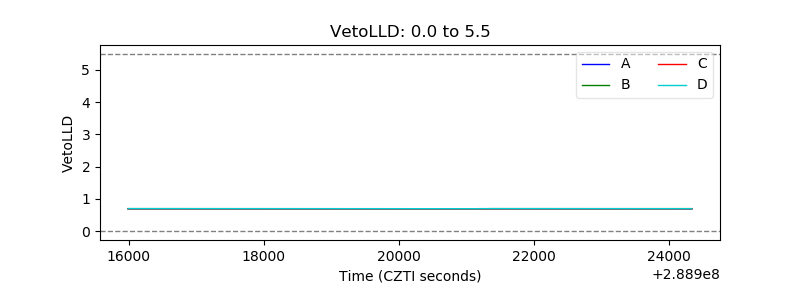 |
| Alpha Counter | 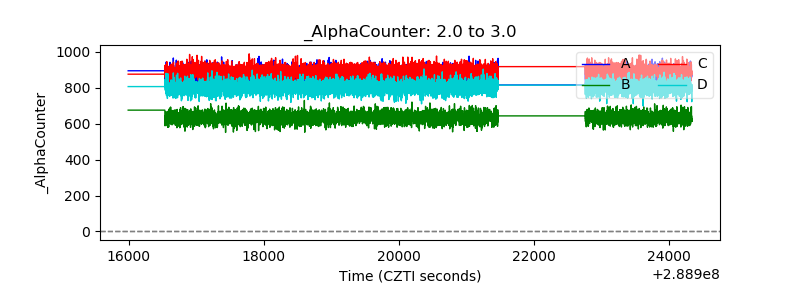 |
| _CPM_Rate | 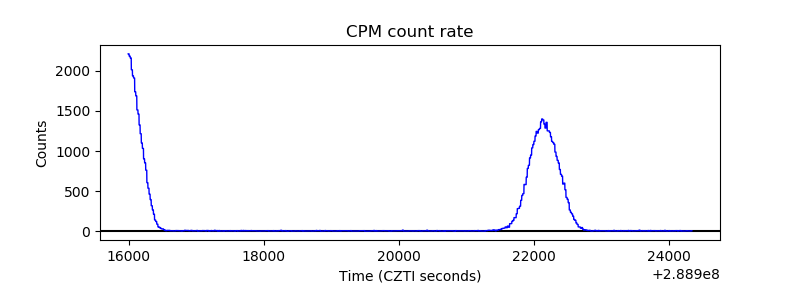 |
| CZT Counter | 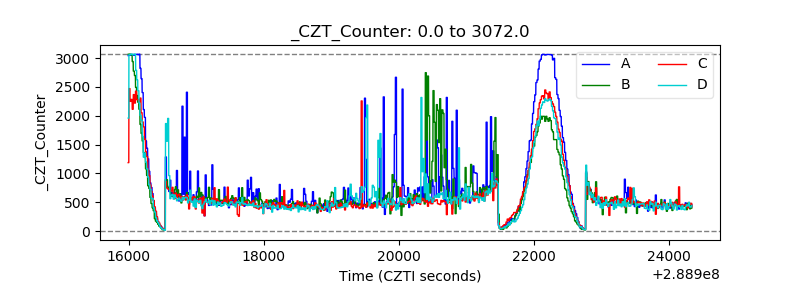 |
| +2.5 Volts monitor |  |
| +5 Volts monitor |  |
| _ROLL_ROT | 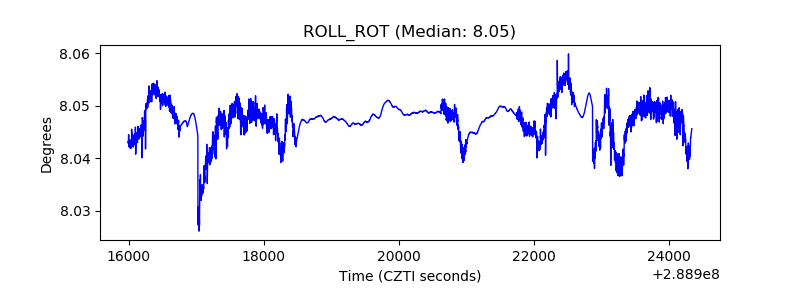 |
| _Roll_DEC | 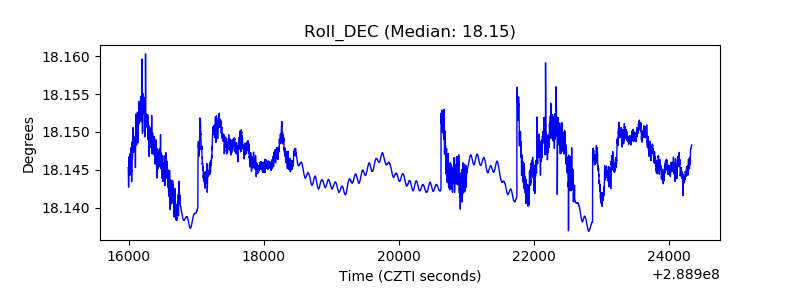 |
| _Roll_RA | 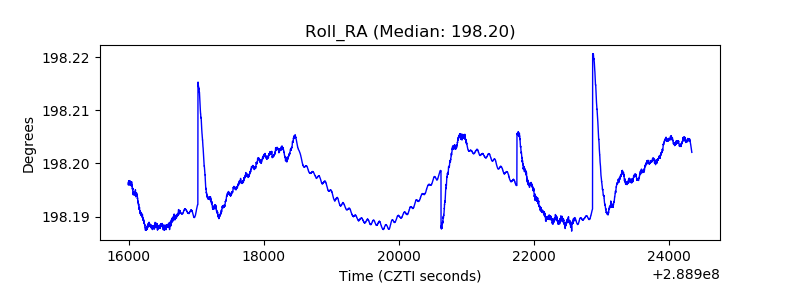 |
| Veto Counter | 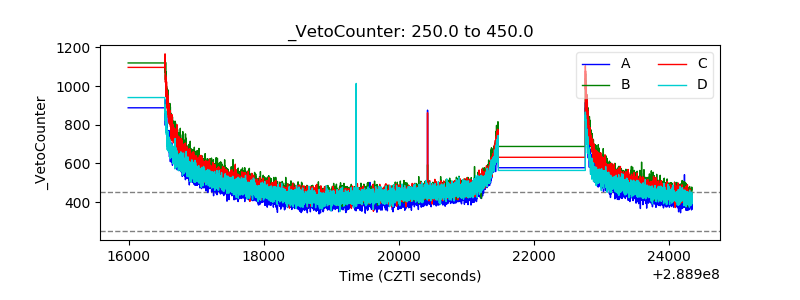 |