| Param | Original file | Final file |
|---|---|---|
| Filename | modeM0/AS1A05_072T02_9000002736_18471cztM0_level2.evt | modeM0/AS1A05_072T02_9000002736_18471cztM0_level2_quad_clean.evt |
| Size (bytes) | 471,957,120 | 98,968,320 |
| Size | 450.1 MB | 94.4 MB |
| Events in quadrant A | 3,464,405 | 629,702 |
| Events in quadrant B | 3,575,312 | 651,448 |
| Events in quadrant C | 3,395,149 | 623,812 |
| Events in quadrant D | 3,387,286 | 609,309 |
| Mode M0 | |||
|---|---|---|---|
| Quadrant | BADHDUFLAG | Total packets | Discarded packets |
| A | 0 | 14847 | 2 |
| B | 0 | 15060 | 2 |
| C | 0 | 14543 | 2 |
| D | 0 | 14730 | 2 |
| Mode M9 | |||
|---|---|---|---|
| Quadrant | BADHDUFLAG | Total packets | Discarded packets |
| A | 0 | 15 | 0 |
| B | 0 | 16 | 0 |
| C | 0 | 16 | 0 |
| D | 0 | 16 | 0 |
| Mode SS | |||
|---|---|---|---|
| Quadrant | BADHDUFLAG | Total packets | Discarded packets |
| A | 0 | 140 | 0 |
| B | 0 | 140 | 0 |
| C | 0 | 140 | 0 |
| D | 0 | 140 | 0 |
| Quadrant | Total seconds | Saturated seconds | Saturation percentage |
|---|---|---|---|
| A | 6935 | 73 | 1.052632% |
| B | 6935 | 140 | 2.018745% |
| C | 6935 | 105 | 1.514059% |
| D | 6935 | 36 | 0.519106% |
Noise dominated data is calculated using 1-second bins in cleaned event files. If a bin has >2000 counts, and if more than 50% of those come from <1% of pixels, then it is considered to be noise-dominated and hence unusable.
| Quadrant | # 1 sec bins | Bins with >0 counts | Bins with >2000 counts | High rate bins dominated by noise | Noise dominated (total time) | Noise dominated (detector-on time) | Marked lightcurve |
|---|---|---|---|---|---|---|---|
| A | 8015 | 6935 | 0 | 0 | 0.00% | 0.00% | 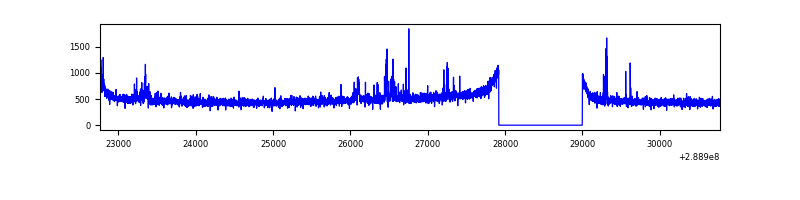 |
| B | 8015 | 6935 | 7 | 7 | 0.09% | 0.10% | 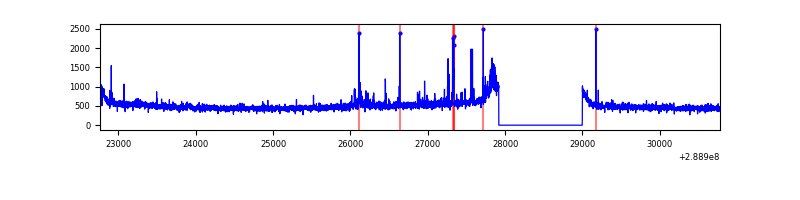 |
| C | 8015 | 6935 | 0 | 0 | 0.00% | 0.00% | 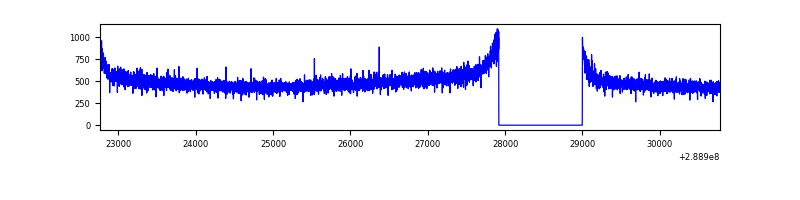 |
| D | 8015 | 6935 | 7 | 7 | 0.09% | 0.10% |  |
Top three noisy pixels from each quadrant. If the there are fewer than three noisy pixels in the level2.evt file, extra rows are filled as -1
| Pixel properties | Quadrant properties | ||||||
|---|---|---|---|---|---|---|---|
| Quadrant | DetID | PixID | Counts | Sigma | Mean | Median | Sigma |
| A | 15 | 174 | 56113 | 312.91 | 870 | 852 | 176.6 |
| A | 4 | 2 | 50656 | 282.01 | 870 | 852 | 176.6 |
| A | 0 | 13 | 8586 | 43.79 | 870 | 852 | 176.6 |
| B | 15 | 222 | 42244 | 247.38 | 874 | 854 | 167.3 |
| B | 12 | 18 | 42133 | 246.71 | 874 | 854 | 167.3 |
| B | 10 | 245 | 34711 | 202.36 | 874 | 854 | 167.3 |
| C | 14 | 238 | 130305 | 658.83 | 836 | 842 | 196.5 |
| C | 3 | 233 | 8577 | 39.36 | 836 | 842 | 196.5 |
| C | 13 | 61 | 6001 | 26.25 | 836 | 842 | 196.5 |
| D | 1 | 52 | 66948 | 319.67 | 845 | 820 | 206.9 |
| D | 7 | 96 | 52069 | 247.74 | 845 | 820 | 206.9 |
| D | 13 | 249 | 30106 | 141.57 | 845 | 820 | 206.9 |
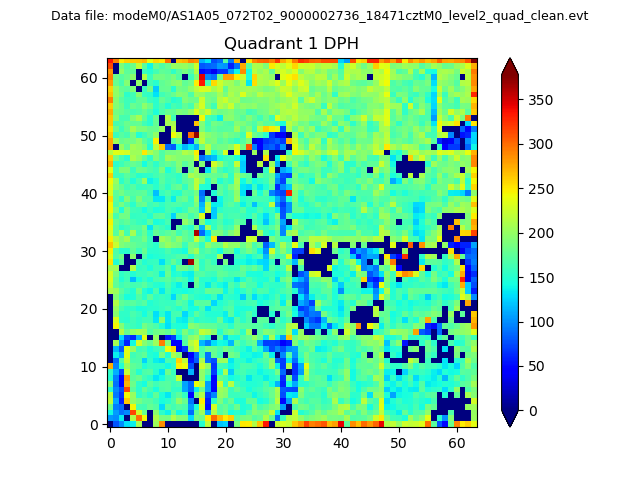
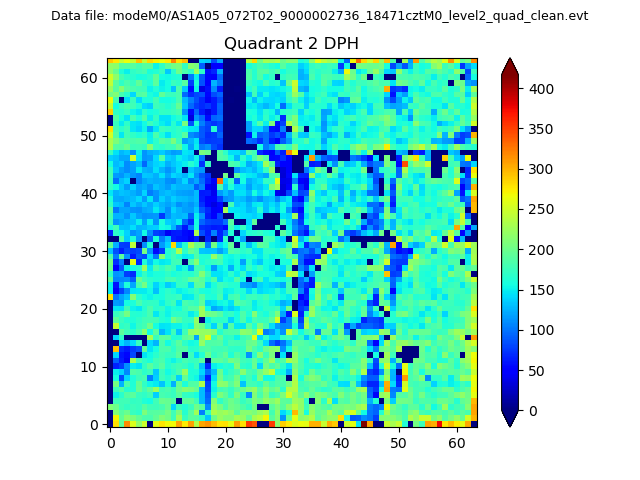
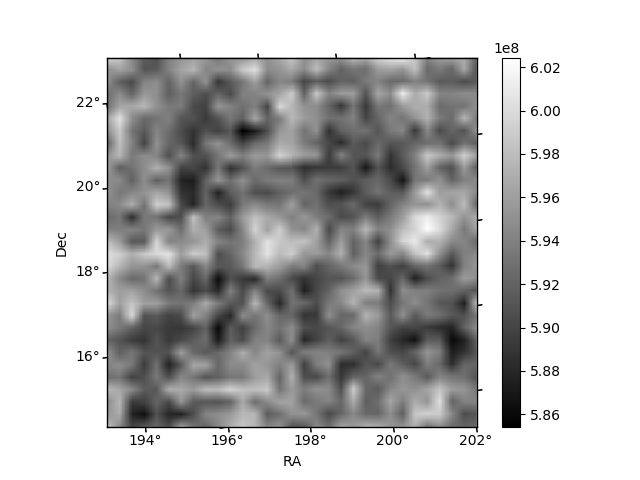
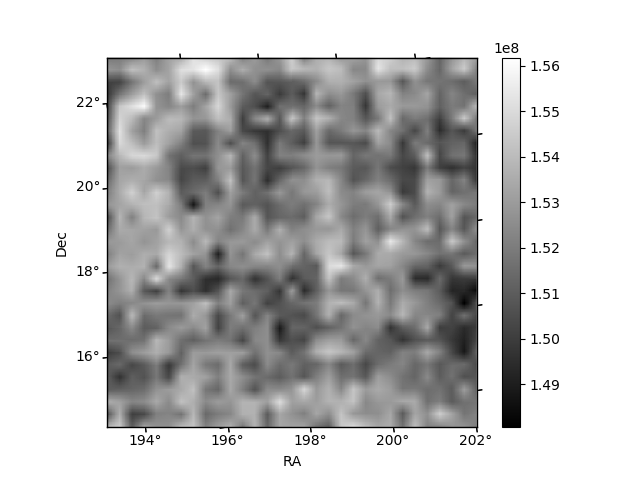
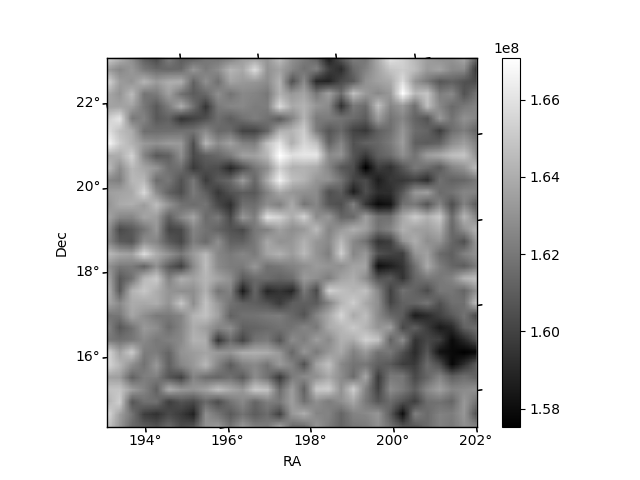
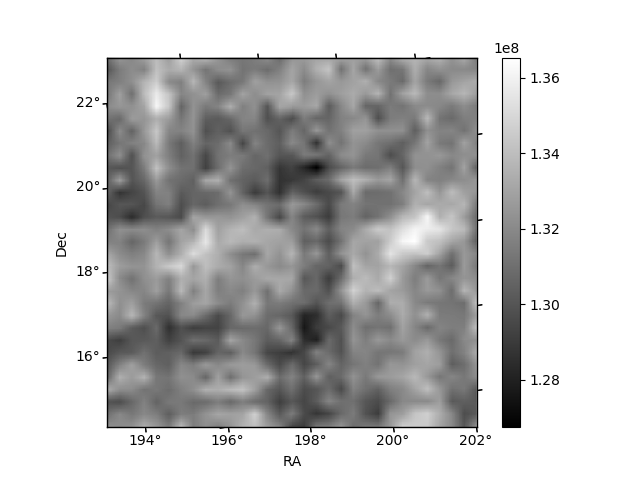
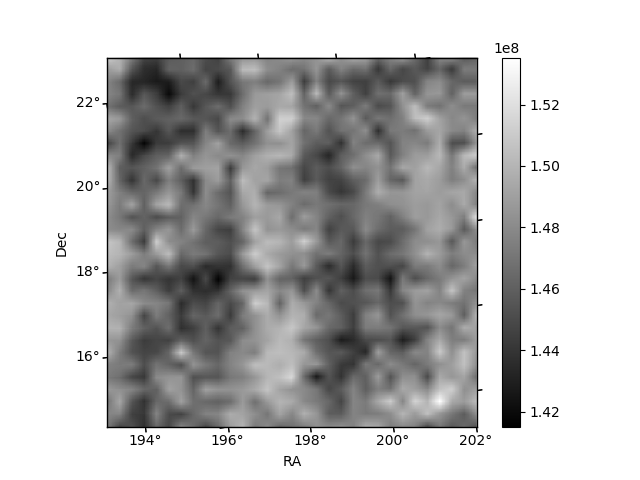
Histogram calculated using DETX and DETY for each event in the final _common_clean file
| Quadrant A | 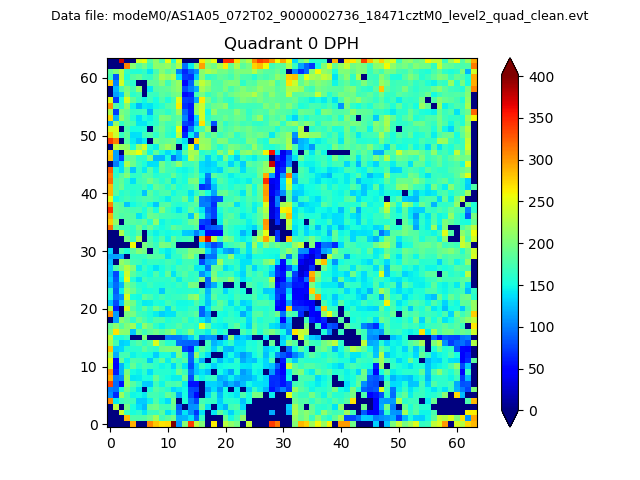 |
 |
Quadrant B |
|---|---|---|---|
| Quadrant D | 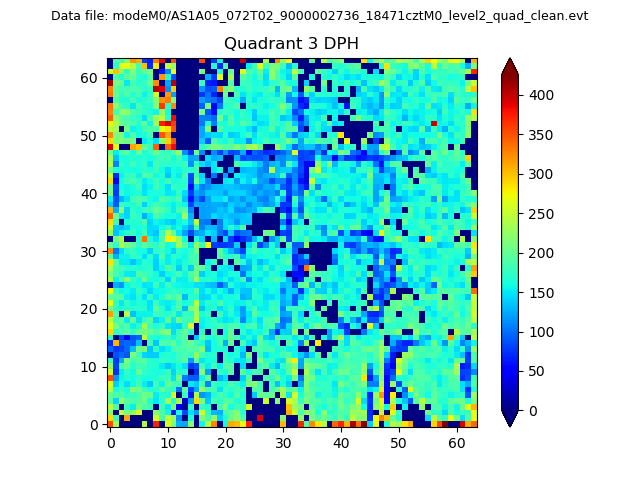 |
 |
Quadrant C |
| Plot type | Count rate plots | Images |
|---|---|---|
| Comparison with Poisson distribution Blue bars denote a histogram of data divided into 1 sec bins. Red curve is a Poisson curve with rate = median count rate of data. |
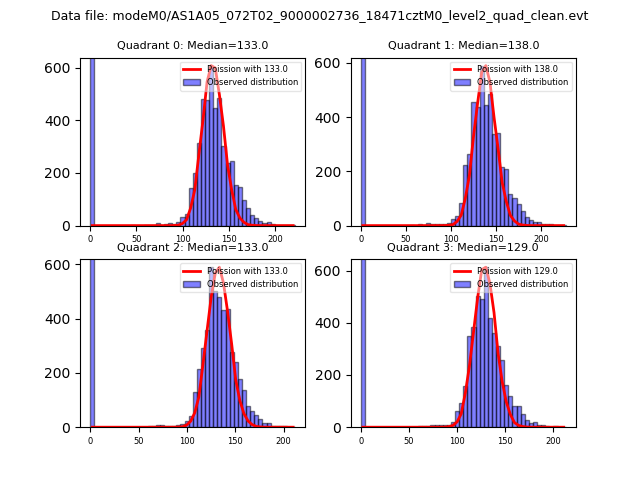 |
 |
| Quadrant-wise count rates Data is divided into 100 sec bins |
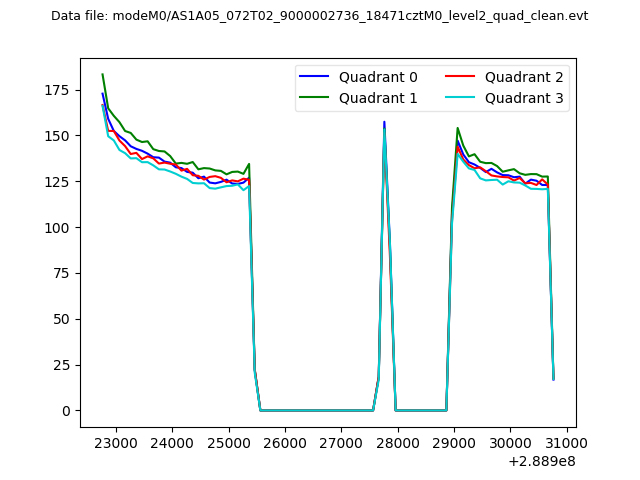 |
|
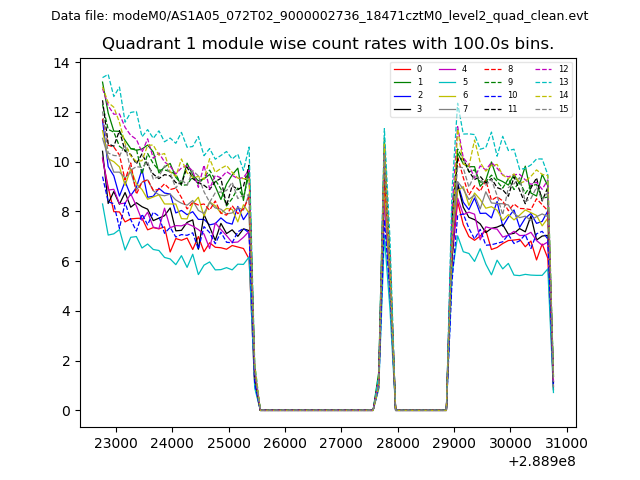
| Module-wise count rates for Quadrant A Data is divided into 100 sec bins |
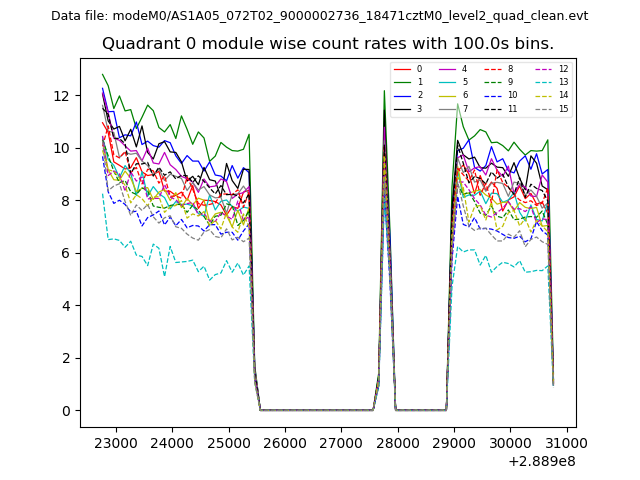 |
 |
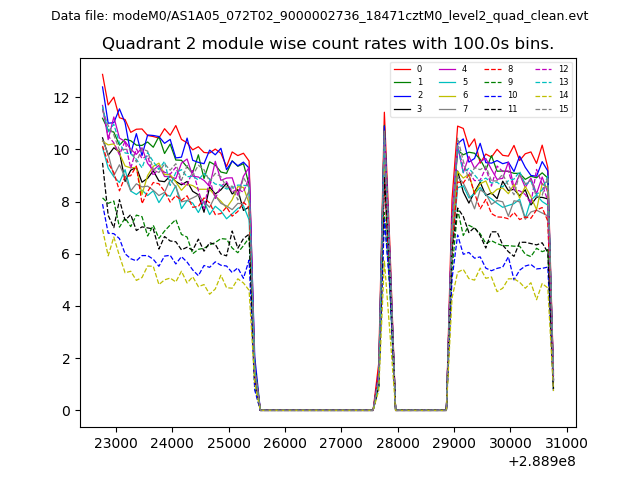
| Module-wise count rates for Quadrant B Data is divided into 100 sec bins |
 |
 |
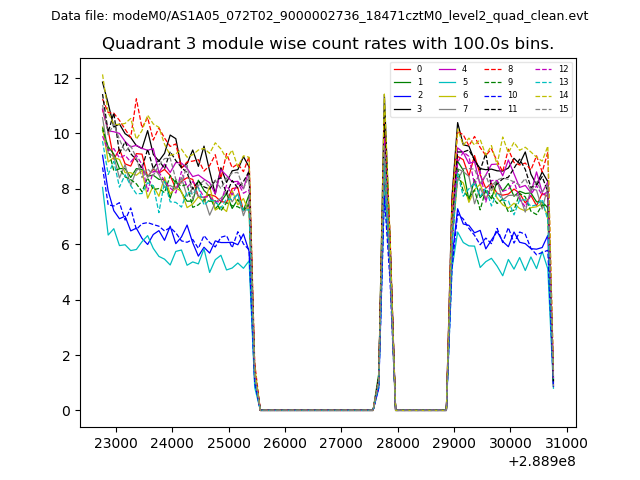
| Module-wise count rates for Quadrant C Data is divided into 100 sec bins |
 |
 |
| Module-wise count rates for Quadrant D Data is divided into 100 sec bins |
 |
 |
| Parameter | Plot |
|---|---|
| CZT HV Monitor | 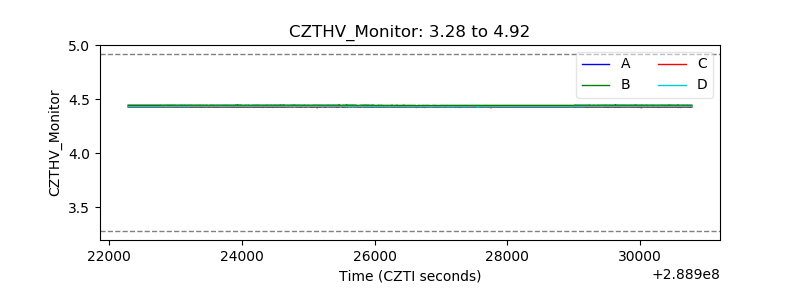 |
| D_VDD | 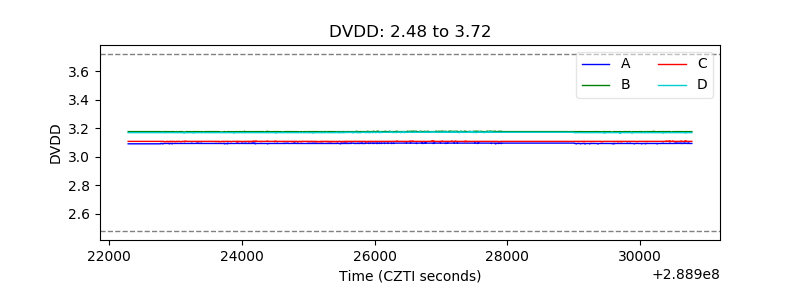 |
| Temperature 1 | 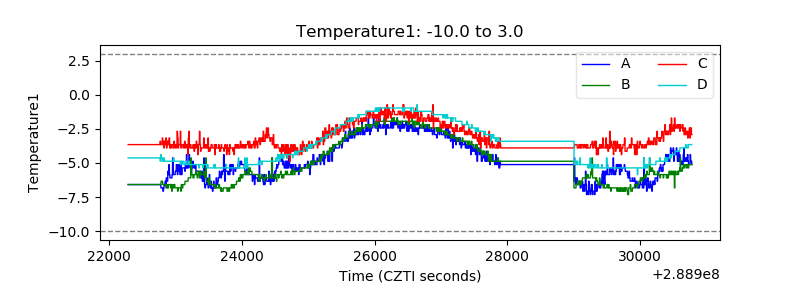 |
| Veto HV Monitor | 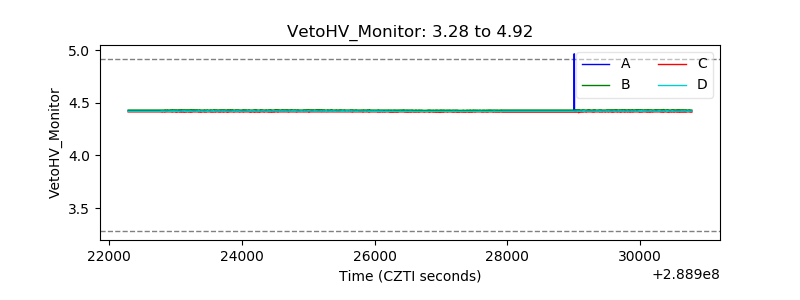 |
| Veto LLD | 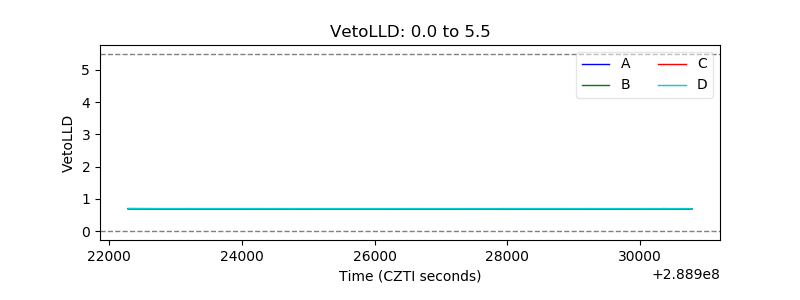 |
| Alpha Counter | 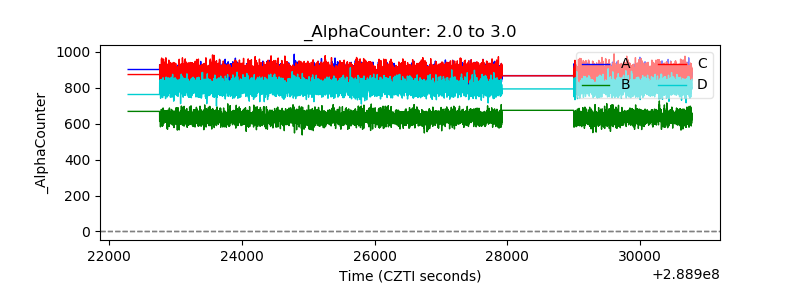 |
| _CPM_Rate | 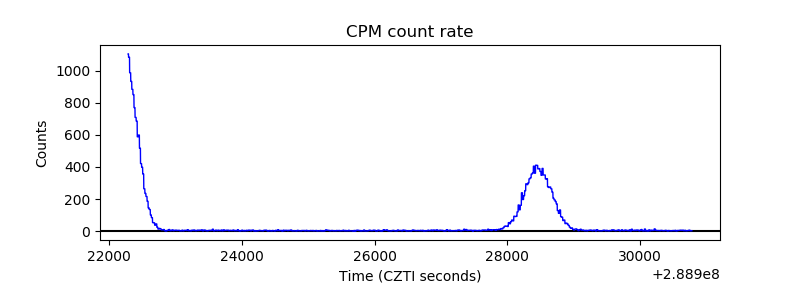 |
| CZT Counter | 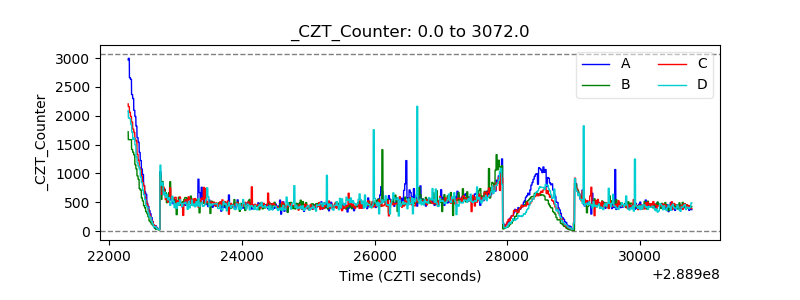 |
| +2.5 Volts monitor | 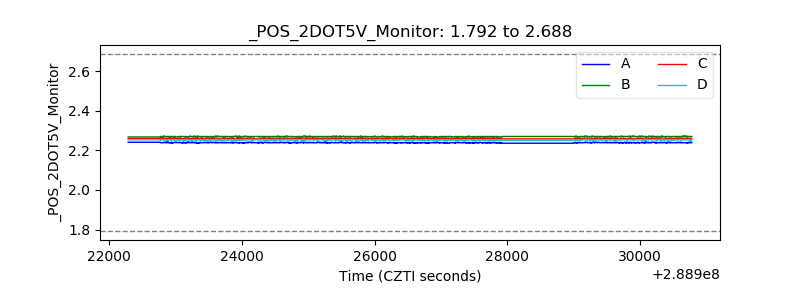 |
| +5 Volts monitor |  |
| _ROLL_ROT | 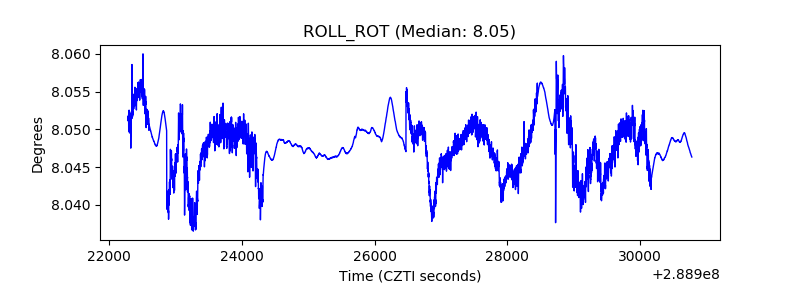 |
| _Roll_DEC |  |
| _Roll_RA | 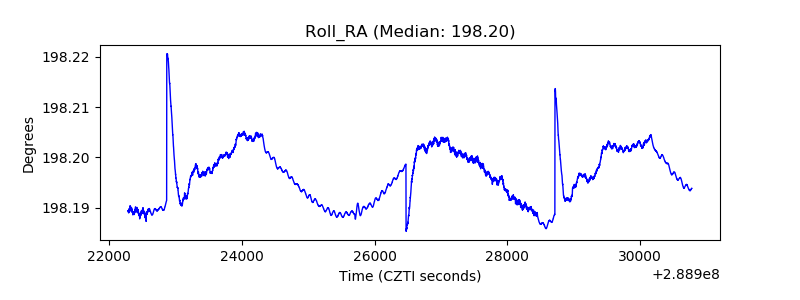 |
| Veto Counter | 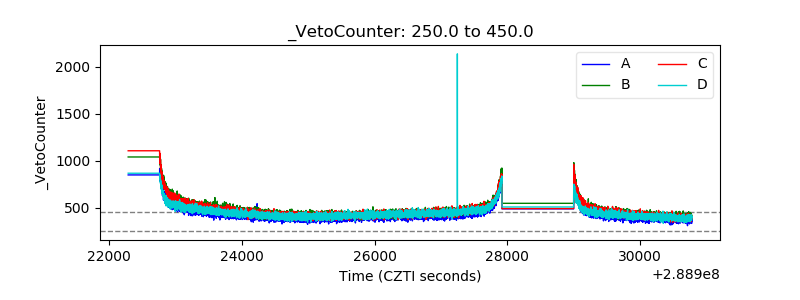 |