| Param | Original file | Final file |
|---|---|---|
| Filename | modeM0/AS1A05_072T02_9000002736_18473cztM0_level2.evt | modeM0/AS1A05_072T02_9000002736_18473cztM0_level2_quad_clean.evt |
| Size (bytes) | 471,015,360 | 86,169,600 |
| Size | 449.2 MB | 82.2 MB |
| Events in quadrant A | 3,671,321 | 533,021 |
| Events in quadrant B | 3,605,627 | 551,344 |
| Events in quadrant C | 3,226,827 | 532,563 |
| Events in quadrant D | 3,301,621 | 521,423 |
| Mode M0 | |||
|---|---|---|---|
| Quadrant | BADHDUFLAG | Total packets | Discarded packets |
| A | 0 | 15315 | 2 |
| B | 0 | 15000 | 2 |
| C | 0 | 13940 | 2 |
| D | 0 | 14582 | 2 |
| Mode M9 | |||
|---|---|---|---|
| Quadrant | BADHDUFLAG | Total packets | Discarded packets |
| A | 0 | 3 | 0 |
| B | 0 | 3 | 0 |
| C | 0 | 3 | 0 |
| D | 0 | 3 | 0 |
| Mode SS | |||
|---|---|---|---|
| Quadrant | BADHDUFLAG | Total packets | Discarded packets |
| A | 0 | 140 | 0 |
| B | 0 | 140 | 0 |
| C | 0 | 140 | 0 |
| D | 0 | 140 | 0 |
| Quadrant | Total seconds | Saturated seconds | Saturation percentage |
|---|---|---|---|
| A | 6751 | 262 | 3.880907% |
| B | 6751 | 243 | 3.599467% |
| C | 6751 | 151 | 2.236706% |
| D | 6751 | 125 | 1.851578% |
Noise dominated data is calculated using 1-second bins in cleaned event files. If a bin has >2000 counts, and if more than 50% of those come from <1% of pixels, then it is considered to be noise-dominated and hence unusable.
| Quadrant | # 1 sec bins | Bins with >0 counts | Bins with >2000 counts | High rate bins dominated by noise | Noise dominated (total time) | Noise dominated (detector-on time) | Marked lightcurve |
|---|---|---|---|---|---|---|---|
| A | 7041 | 6752 | 91 | 91 | 1.29% | 1.35% | 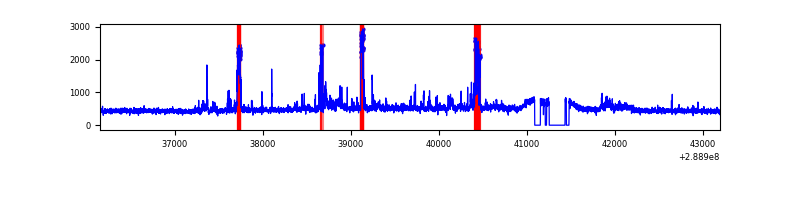 |
| B | 7041 | 6752 | 76 | 76 | 1.08% | 1.13% |  |
| C | 7041 | 6753 | 4 | 4 | 0.06% | 0.06% | 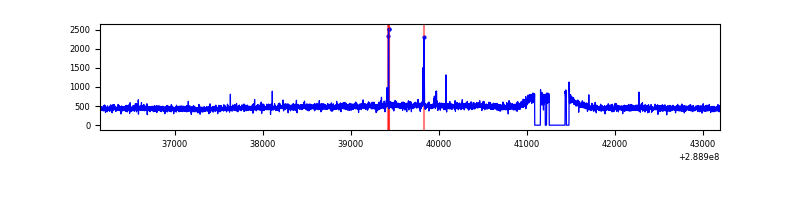 |
| D | 7041 | 6751 | 2 | 2 | 0.03% | 0.03% | 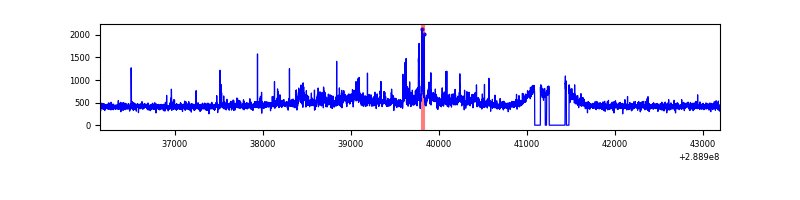 |
Top three noisy pixels from each quadrant. If the there are fewer than three noisy pixels in the level2.evt file, extra rows are filled as -1
| Pixel properties | Quadrant properties | ||||||
|---|---|---|---|---|---|---|---|
| Quadrant | DetID | PixID | Counts | Sigma | Mean | Median | Sigma |
| A | 15 | 174 | 458401 | 2772.26 | 808 | 788 | 165.1 |
| A | 4 | 2 | 97702 | 587.11 | 808 | 788 | 165.1 |
| A | 0 | 226 | 7128 | 38.41 | 808 | 788 | 165.1 |
| B | 15 | 222 | 178934 | 1132.45 | 809 | 787 | 157.3 |
| B | 10 | 245 | 142626 | 901.64 | 809 | 787 | 157.3 |
| B | 0 | 230 | 69653 | 437.77 | 809 | 787 | 157.3 |
| C | 14 | 238 | 120636 | 655.23 | 780 | 785 | 182.9 |
| C | 9 | 54 | 26865 | 142.58 | 780 | 785 | 182.9 |
| C | 3 | 233 | 24127 | 127.61 | 780 | 785 | 182.9 |
| D | 7 | 38 | 95800 | 488.39 | 796 | 773 | 194.6 |
| D | 13 | 168 | 83459 | 424.97 | 796 | 773 | 194.6 |
| D | 12 | 110 | 41755 | 210.63 | 796 | 773 | 194.6 |
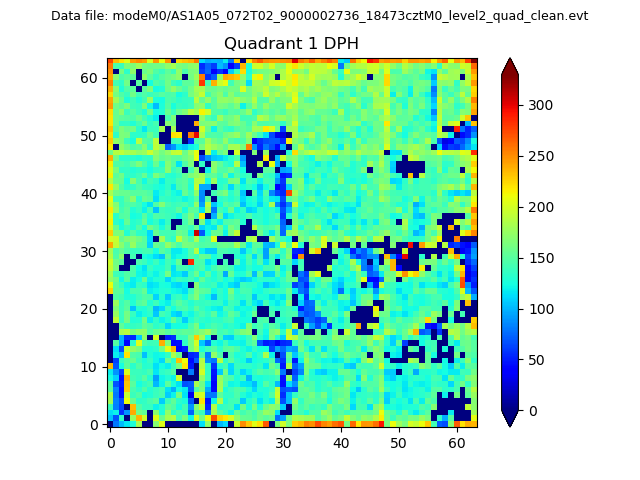
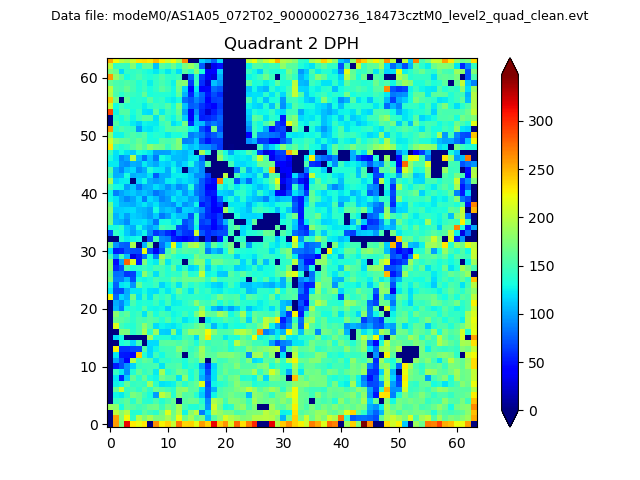
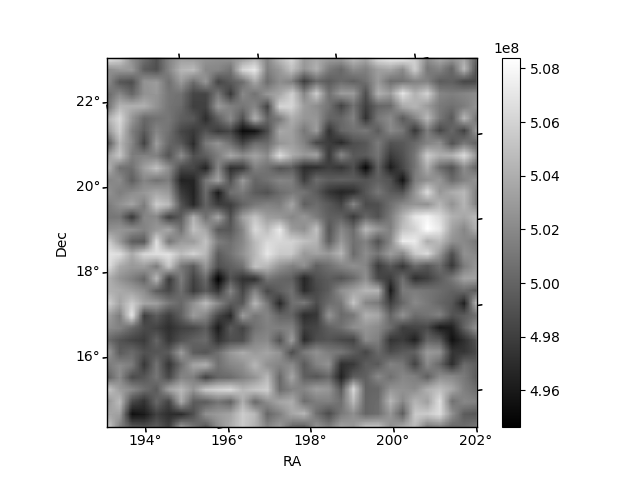
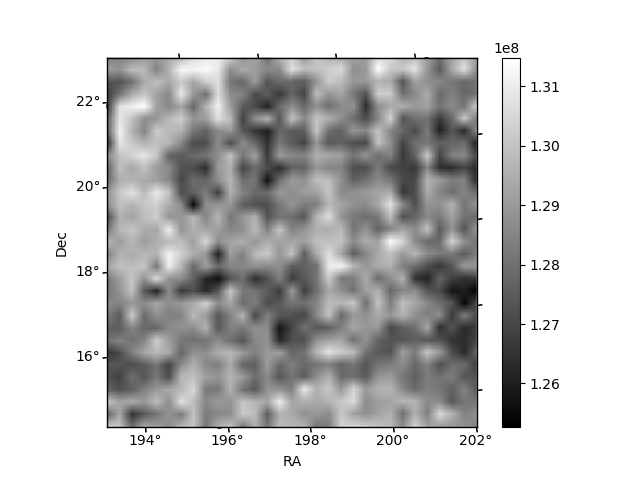
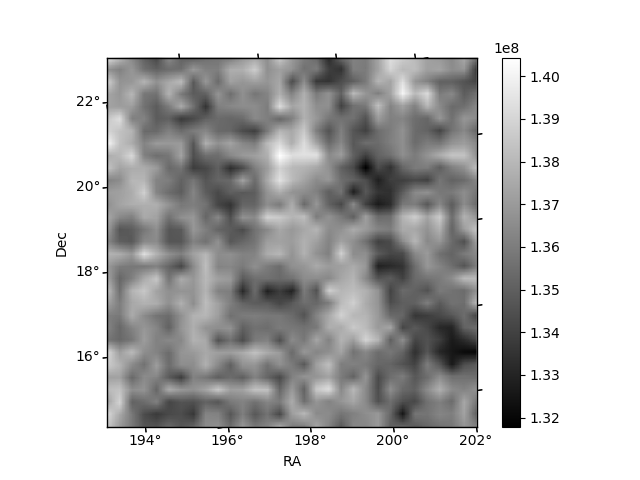
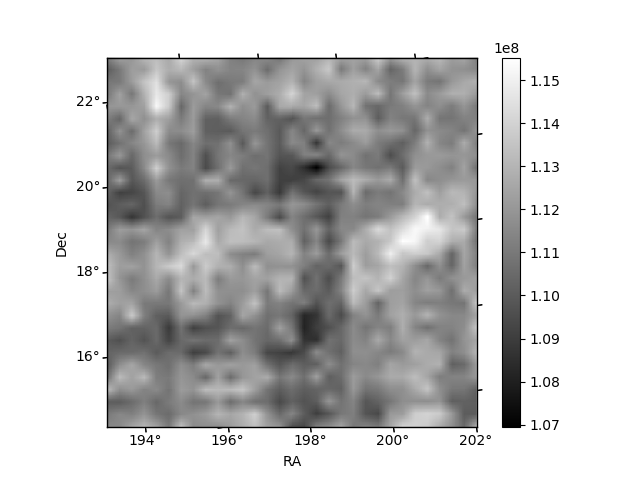
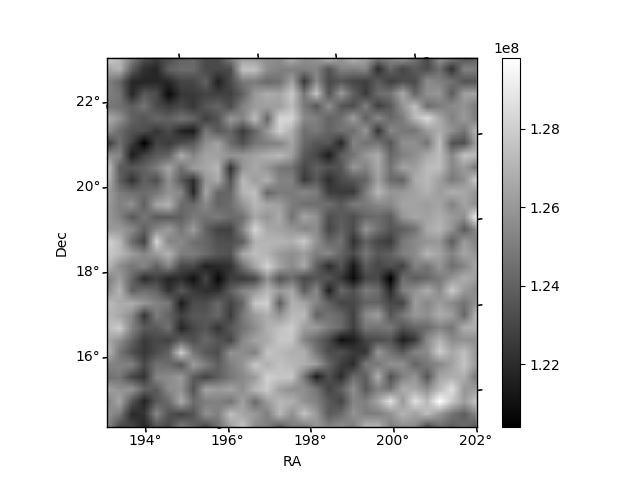
Histogram calculated using DETX and DETY for each event in the final _common_clean file
| Quadrant A | 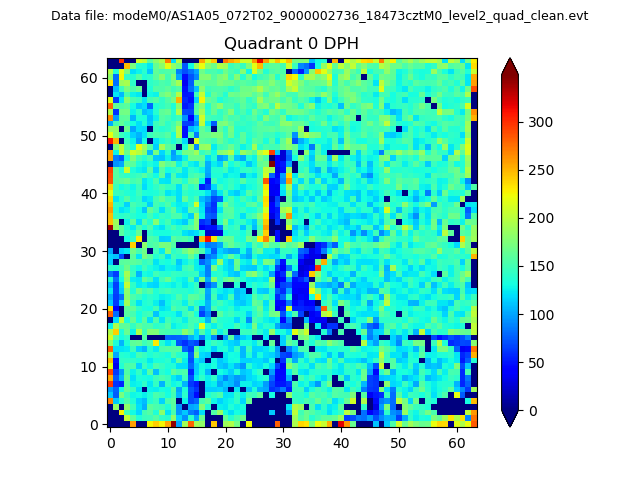 |
 |
Quadrant B |
|---|---|---|---|
| Quadrant D | 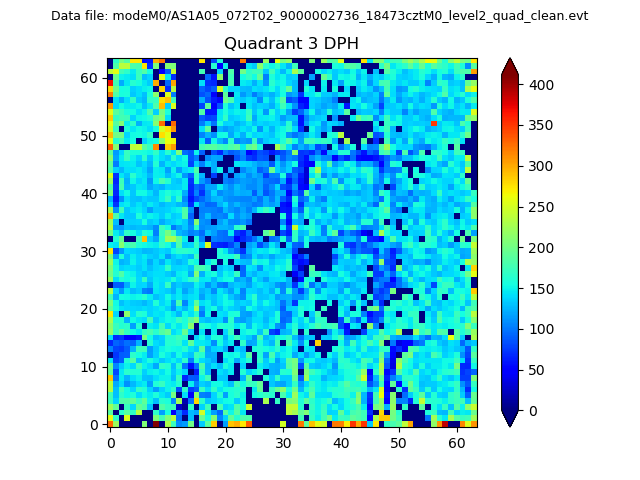 |
 |
Quadrant C |
| Plot type | Count rate plots | Images |
|---|---|---|
| Comparison with Poisson distribution Blue bars denote a histogram of data divided into 1 sec bins. Red curve is a Poisson curve with rate = median count rate of data. |
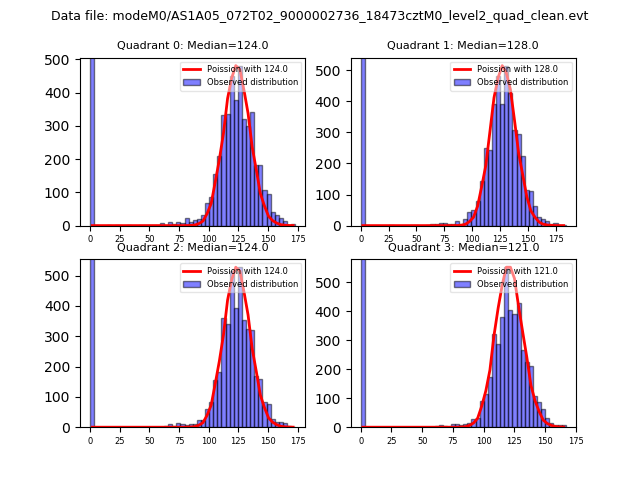 |
 |
| Quadrant-wise count rates Data is divided into 100 sec bins |
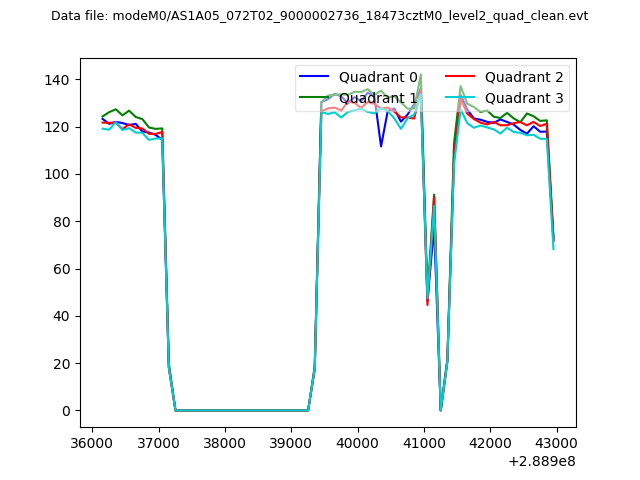 |
|
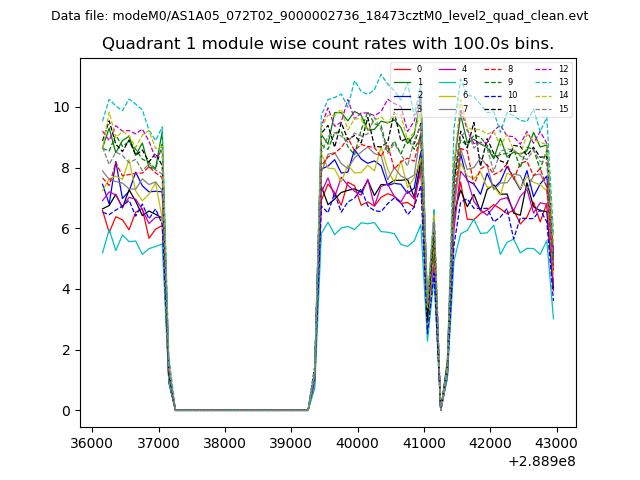
| Module-wise count rates for Quadrant A Data is divided into 100 sec bins |
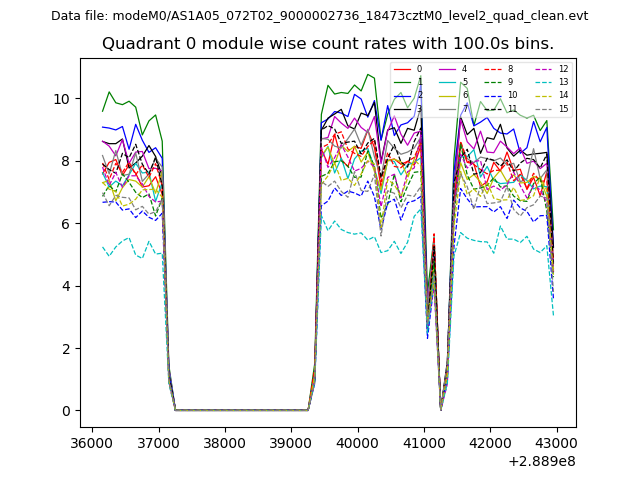 |
 |
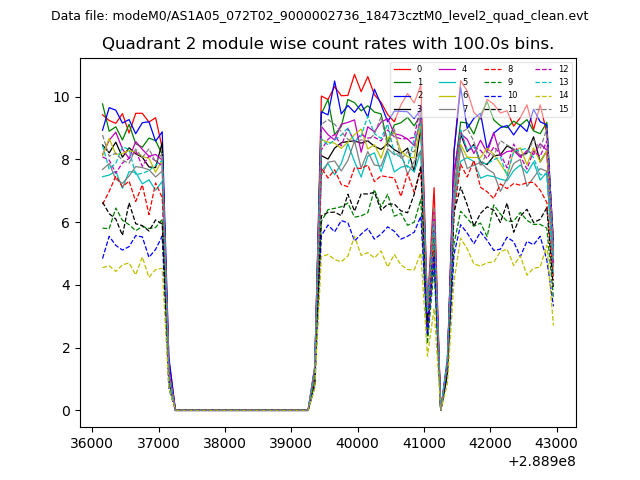
| Module-wise count rates for Quadrant B Data is divided into 100 sec bins |
 |
 |
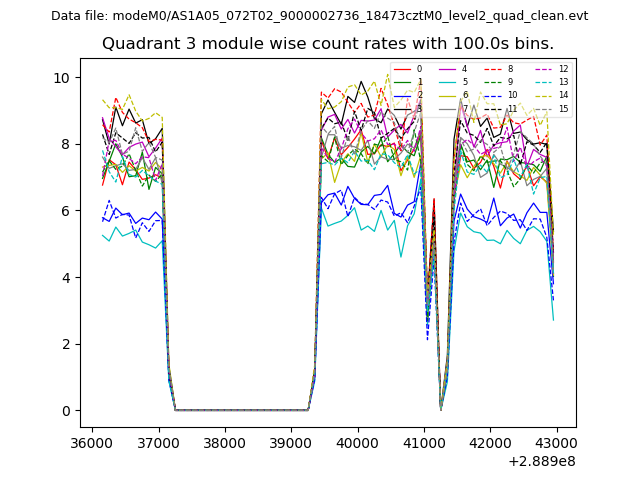
| Module-wise count rates for Quadrant C Data is divided into 100 sec bins |
 |
 |
| Module-wise count rates for Quadrant D Data is divided into 100 sec bins |
 |
 |
| Parameter | Plot |
|---|---|
| CZT HV Monitor | 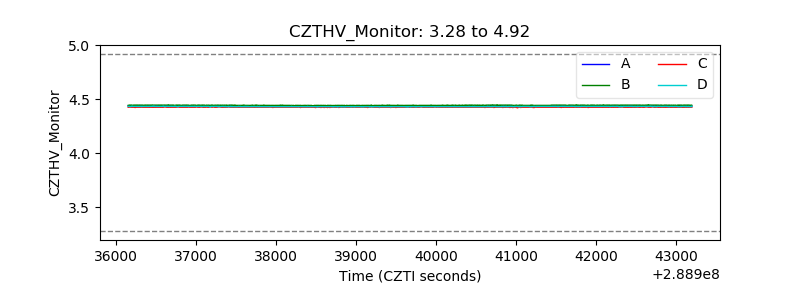 |
| D_VDD | 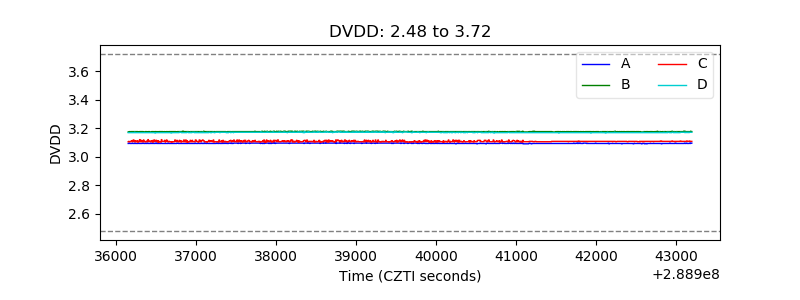 |
| Temperature 1 | 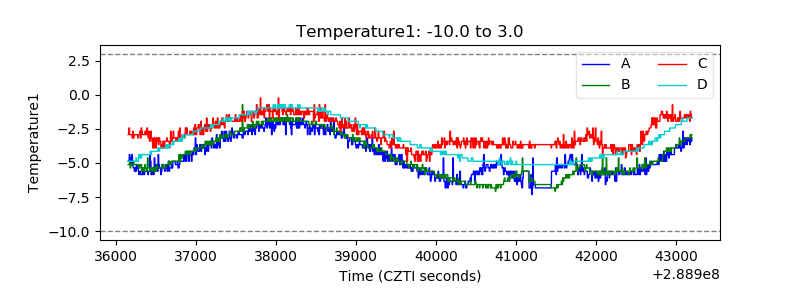 |
| Veto HV Monitor | 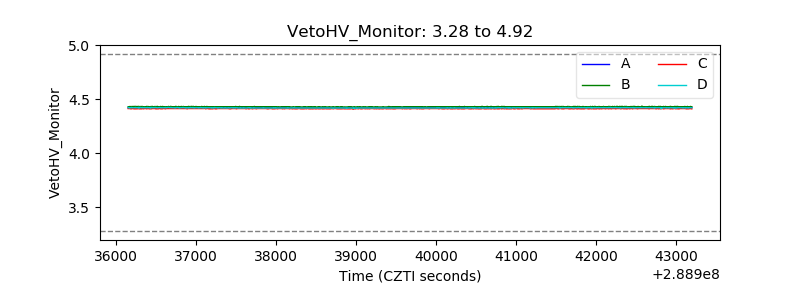 |
| Veto LLD | 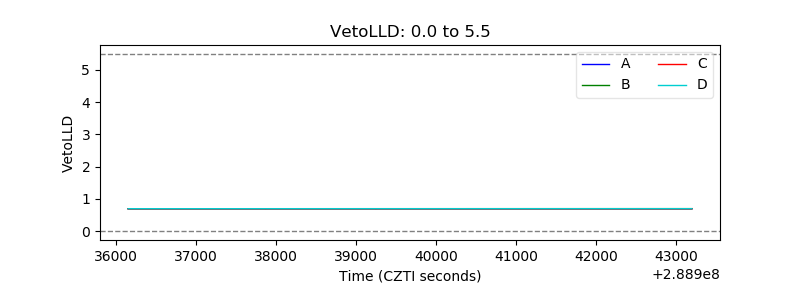 |
| Alpha Counter | 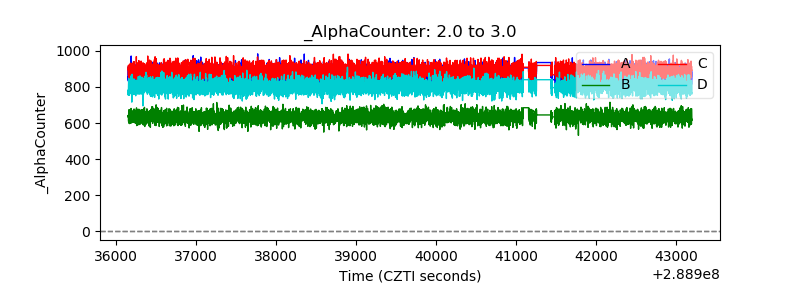 |
| _CPM_Rate | 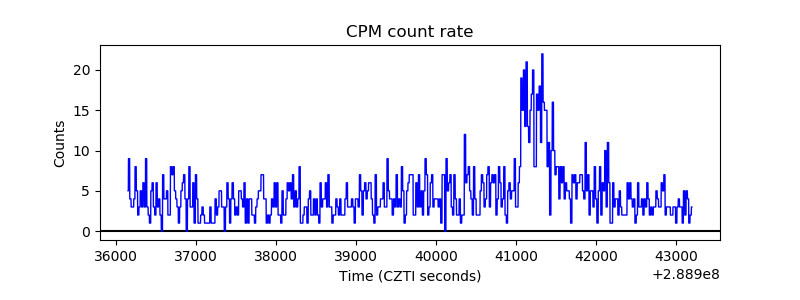 |
| CZT Counter | 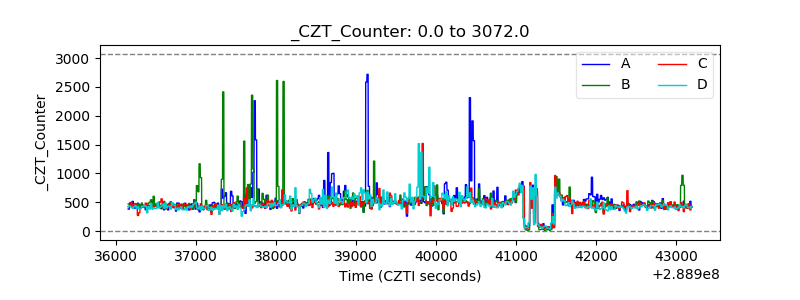 |
| +2.5 Volts monitor |  |
| +5 Volts monitor | 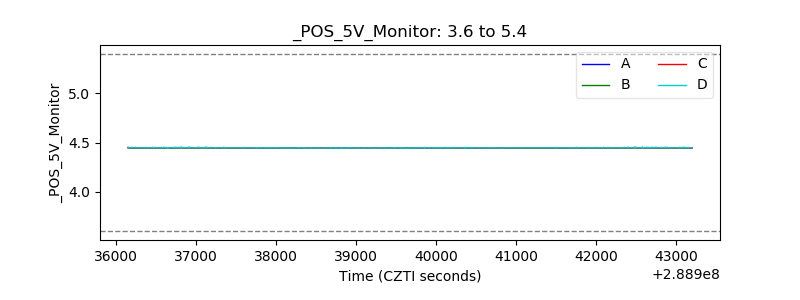 |
| _ROLL_ROT | 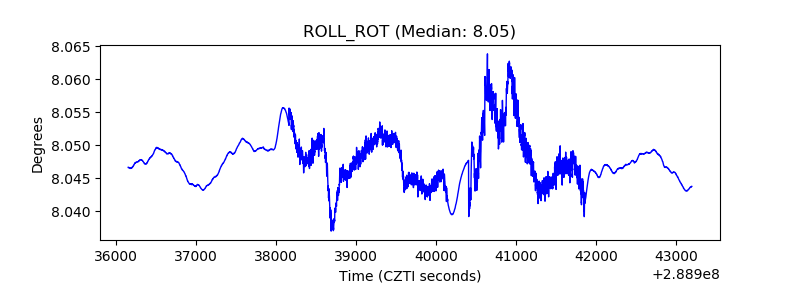 |
| _Roll_DEC | 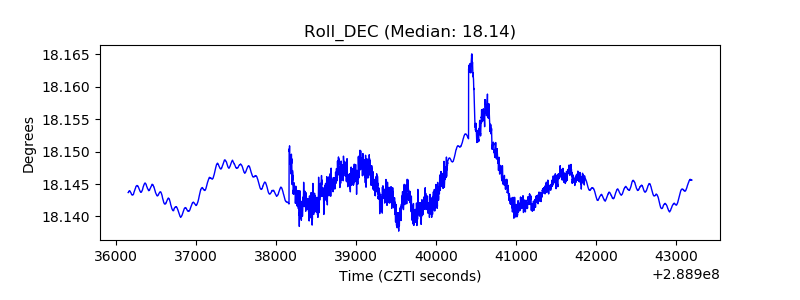 |
| _Roll_RA | 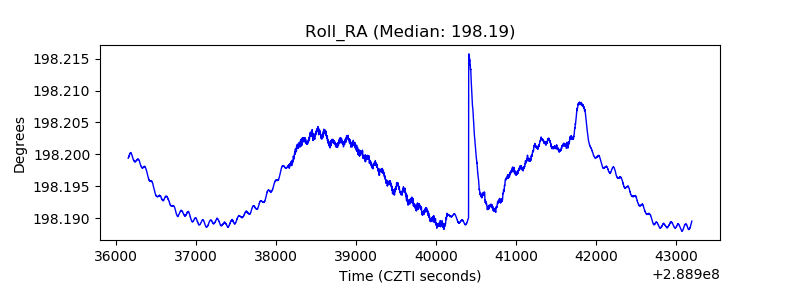 |
| Veto Counter | 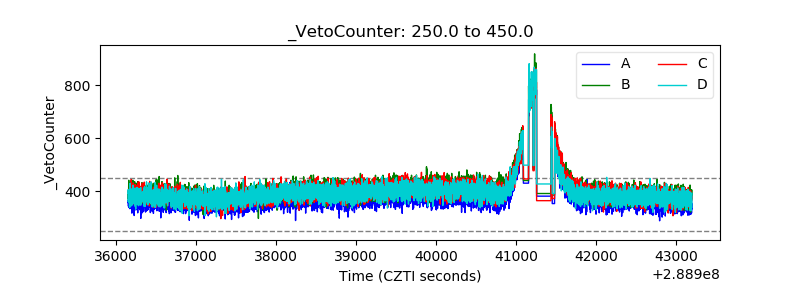 |