| Param | Original file | Final file |
|---|---|---|
| Filename | modeM0/AS1A05_072T02_9000002736_18474cztM0_level2.evt | modeM0/AS1A05_072T02_9000002736_18474cztM0_level2_quad_clean.evt |
| Size (bytes) | 547,122,240 | 101,505,600 |
| Size | 521.8 MB | 96.8 MB |
| Events in quadrant A | 4,071,830 | 633,971 |
| Events in quadrant B | 3,917,197 | 651,313 |
| Events in quadrant C | 3,860,985 | 634,313 |
| Events in quadrant D | 4,188,334 | 610,270 |
| Mode M0 | |||
|---|---|---|---|
| Quadrant | BADHDUFLAG | Total packets | Discarded packets |
| A | 0 | 17203 | 3 |
| B | 0 | 16660 | 3 |
| C | 0 | 16507 | 3 |
| D | 0 | 17830 | 3 |
| Mode M9 | |||
|---|---|---|---|
| Quadrant | BADHDUFLAG | Total packets | Discarded packets |
| A | 0 | 2 | 0 |
| B | 0 | 2 | 0 |
| C | 0 | 2 | 0 |
| D | 0 | 2 | 0 |
| Mode SS | |||
|---|---|---|---|
| Quadrant | BADHDUFLAG | Total packets | Discarded packets |
| A | 0 | 160 | 0 |
| B | 0 | 160 | 0 |
| C | 0 | 160 | 0 |
| D | 0 | 160 | 0 |
| Quadrant | Total seconds | Saturated seconds | Saturation percentage |
|---|---|---|---|
| A | 7815 | 324 | 4.145873% |
| B | 7816 | 301 | 3.851075% |
| C | 7815 | 297 | 3.800384% |
| D | 7815 | 277 | 3.544466% |
Noise dominated data is calculated using 1-second bins in cleaned event files. If a bin has >2000 counts, and if more than 50% of those come from <1% of pixels, then it is considered to be noise-dominated and hence unusable.
| Quadrant | # 1 sec bins | Bins with >0 counts | Bins with >2000 counts | High rate bins dominated by noise | Noise dominated (total time) | Noise dominated (detector-on time) | Marked lightcurve |
|---|---|---|---|---|---|---|---|
| A | 8085 | 7816 | 20 | 20 | 0.25% | 0.26% | 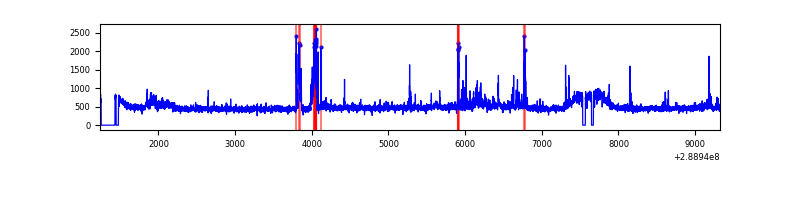 |
| B | 8086 | 7817 | 6 | 6 | 0.07% | 0.08% | 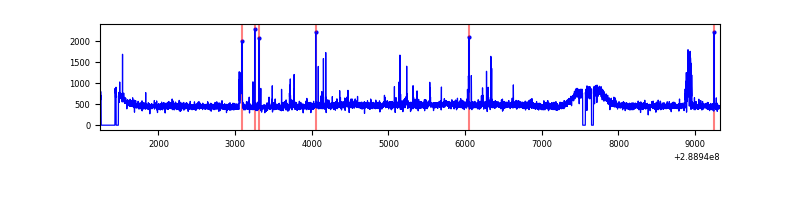 |
| C | 8085 | 7816 | 0 | 0 | 0.00% | 0.00% | 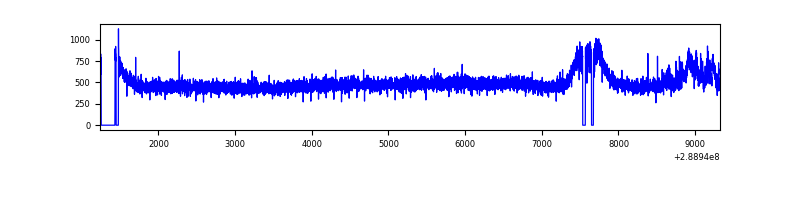 |
| D | 8085 | 7815 | 16 | 16 | 0.20% | 0.20% | 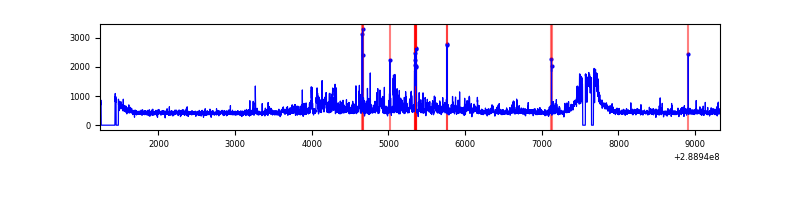 |
Top three noisy pixels from each quadrant. If the there are fewer than three noisy pixels in the level2.evt file, extra rows are filled as -1
| Pixel properties | Quadrant properties | ||||||
|---|---|---|---|---|---|---|---|
| Quadrant | DetID | PixID | Counts | Sigma | Mean | Median | Sigma |
| A | 15 | 174 | 330426 | 1685.72 | 956 | 933 | 195.5 |
| A | 0 | 13 | 60097 | 302.69 | 956 | 933 | 195.5 |
| A | 13 | 254 | 8478 | 38.6 | 956 | 933 | 195.5 |
| B | 0 | 230 | 80574 | 424.39 | 956 | 932 | 187.7 |
| B | 10 | 245 | 35182 | 182.51 | 956 | 932 | 187.7 |
| B | 15 | 222 | 26824 | 137.97 | 956 | 932 | 187.7 |
| C | 14 | 238 | 141704 | 648.06 | 921 | 926 | 217.2 |
| C | 3 | 233 | 129458 | 591.69 | 921 | 926 | 217.2 |
| C | 13 | 61 | 6488 | 25.6 | 921 | 926 | 217.2 |
| D | 7 | 238 | 251275 | 1098.3 | 924 | 895 | 228.0 |
| D | 13 | 168 | 239274 | 1045.66 | 924 | 895 | 228.0 |
| D | 7 | 38 | 91433 | 397.15 | 924 | 895 | 228.0 |
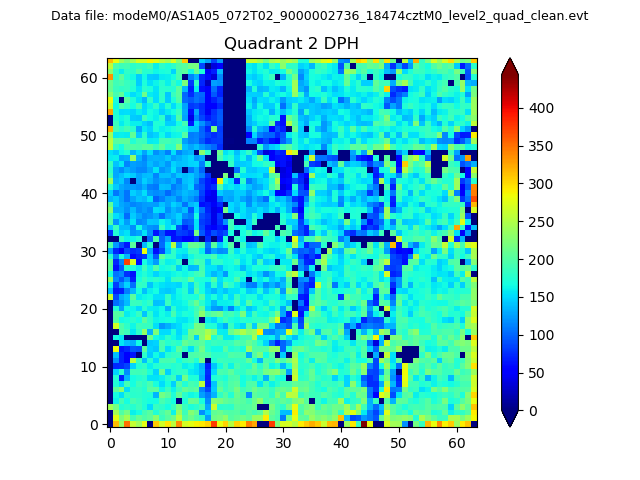
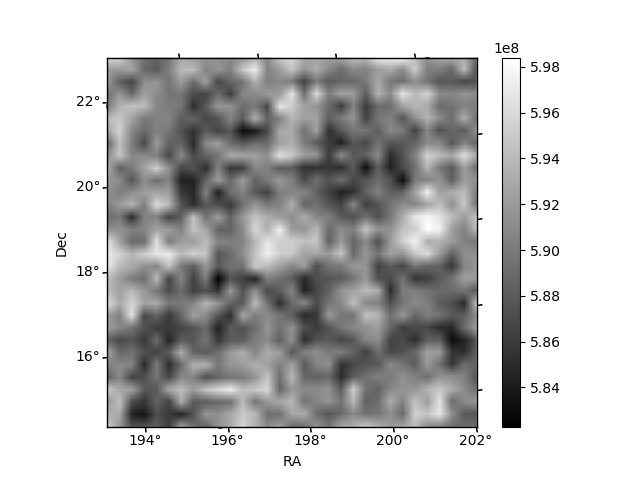
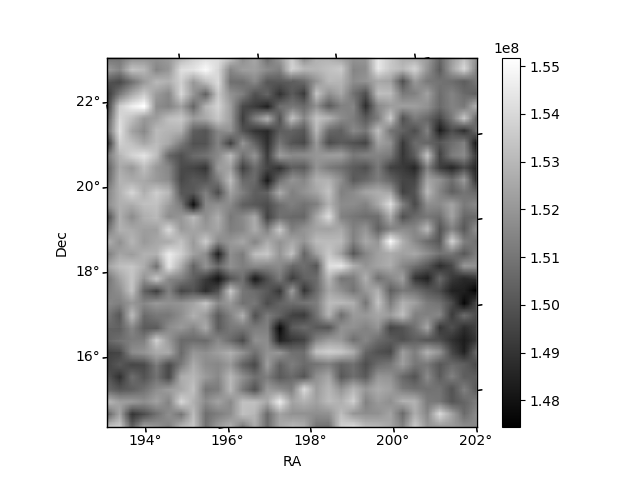
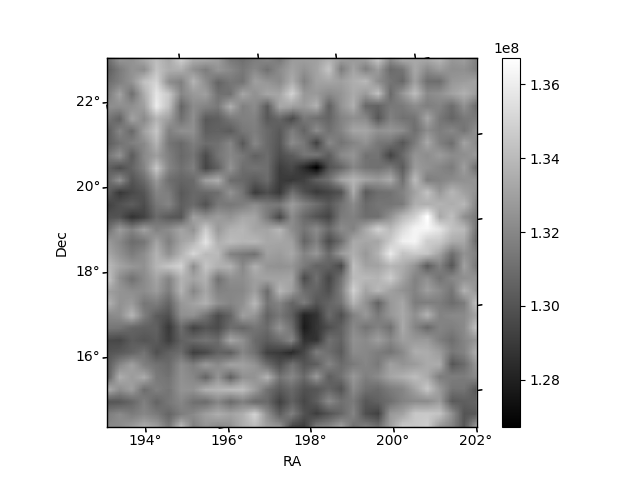
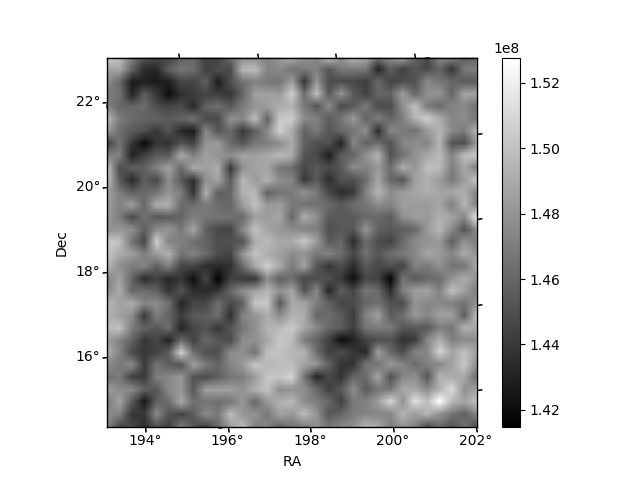
Histogram calculated using DETX and DETY for each event in the final _common_clean file
| Quadrant A | 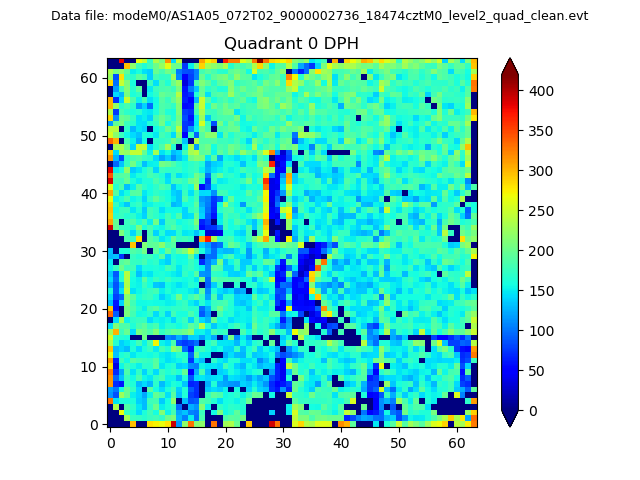 |
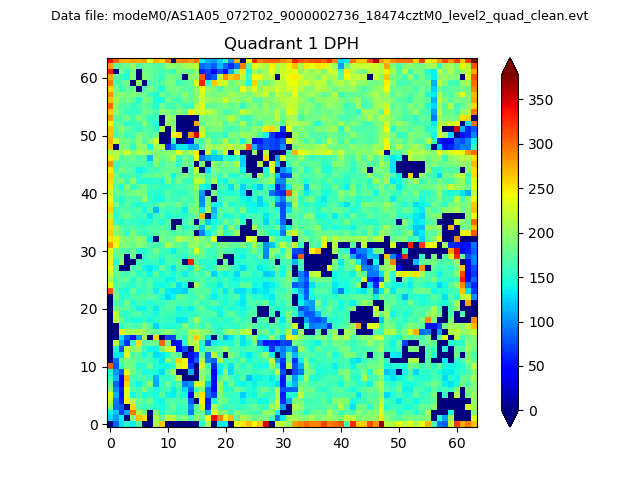 |
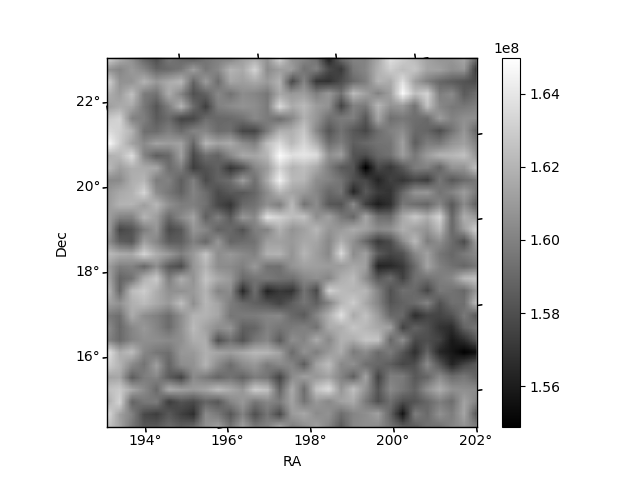
Quadrant B |
|---|---|---|---|
| Quadrant D | 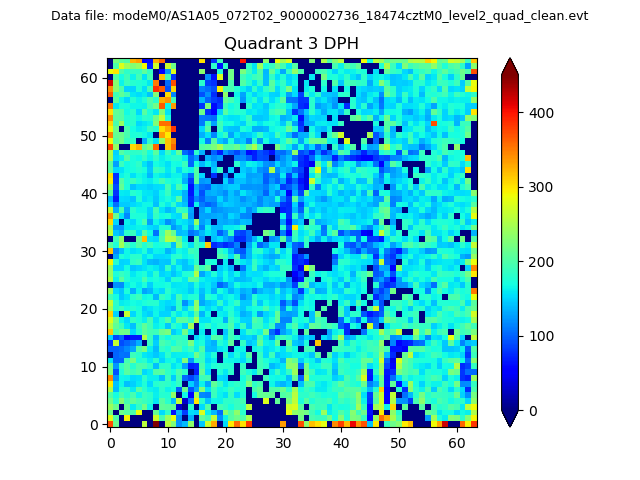 |
 |
Quadrant C |
| Plot type | Count rate plots | Images |
|---|---|---|
| Comparison with Poisson distribution Blue bars denote a histogram of data divided into 1 sec bins. Red curve is a Poisson curve with rate = median count rate of data. |
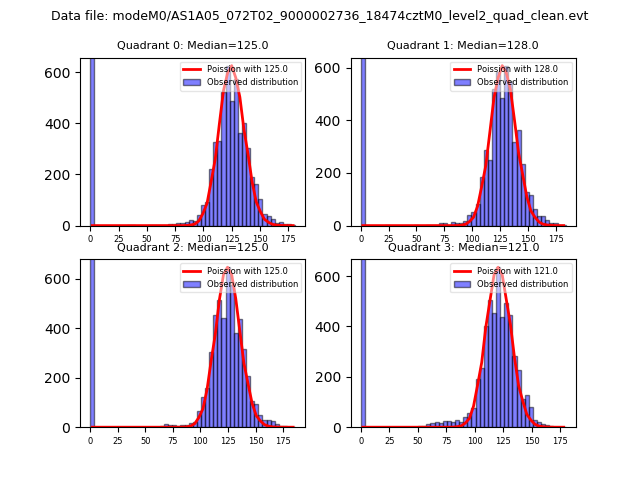 |
 |
| Quadrant-wise count rates Data is divided into 100 sec bins |
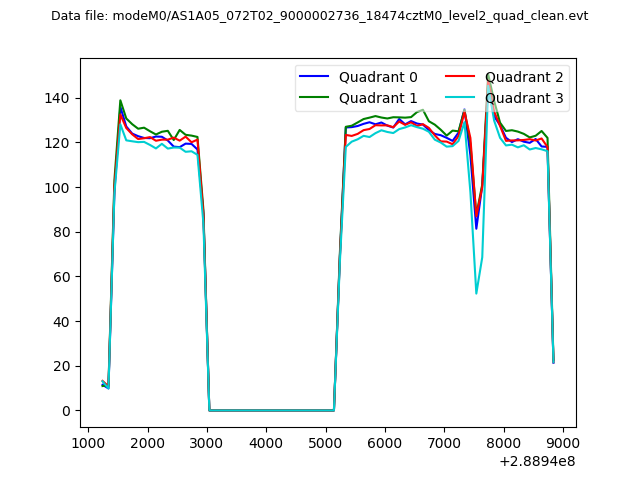 |
|
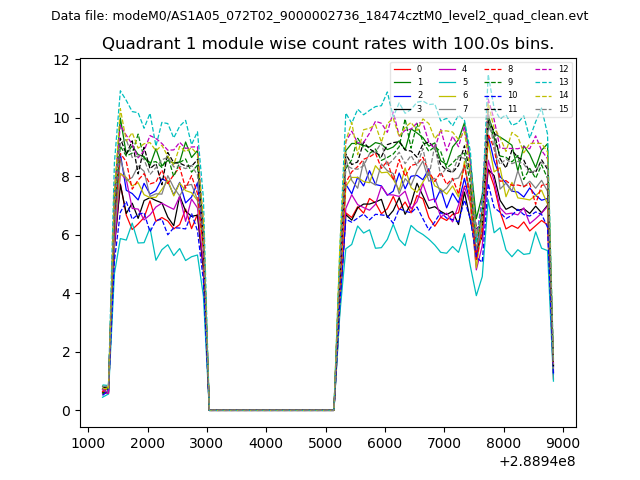
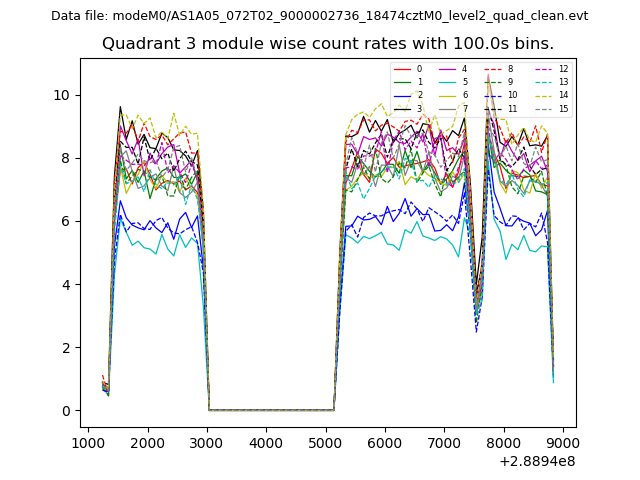
| Module-wise count rates for Quadrant A Data is divided into 100 sec bins |
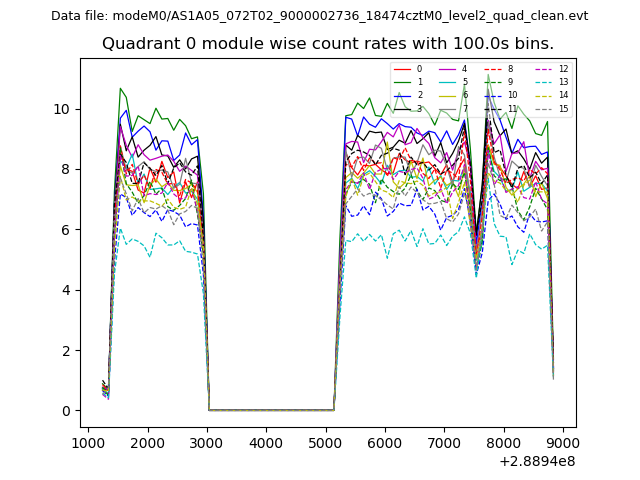 |
 |
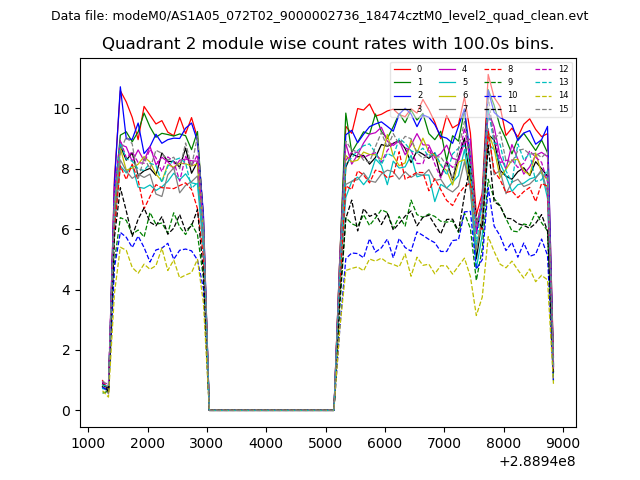
| Module-wise count rates for Quadrant B Data is divided into 100 sec bins |
 |
 |
| Module-wise count rates for Quadrant C Data is divided into 100 sec bins |
 |
 |
| Module-wise count rates for Quadrant D Data is divided into 100 sec bins |
 |
 |
| Parameter | Plot |
|---|---|
| CZT HV Monitor |  |
| D_VDD | 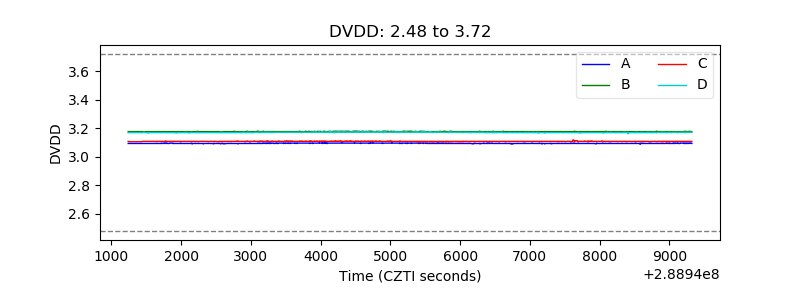 |
| Temperature 1 | 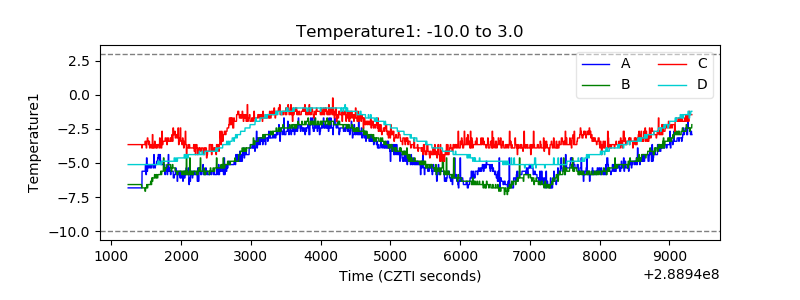 |
| Veto HV Monitor | 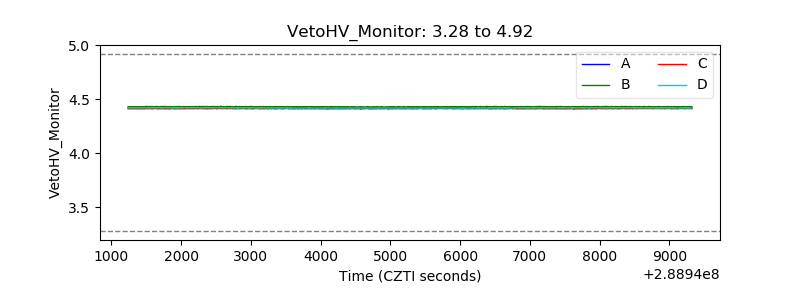 |
| Veto LLD | 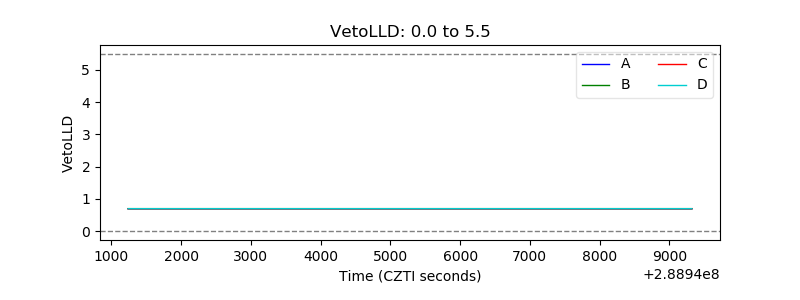 |
| Alpha Counter | 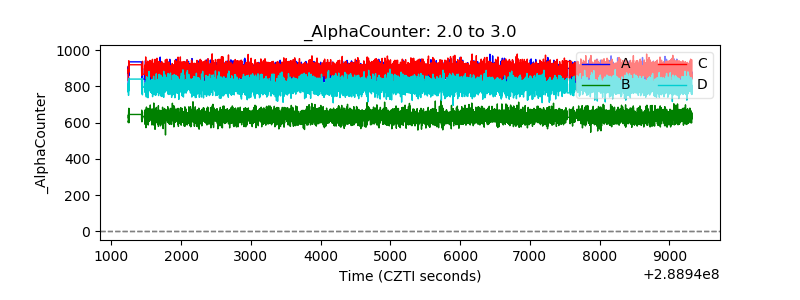 |
| _CPM_Rate | 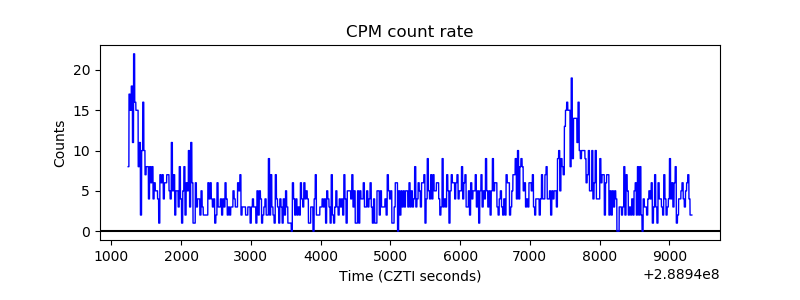 |
| CZT Counter | 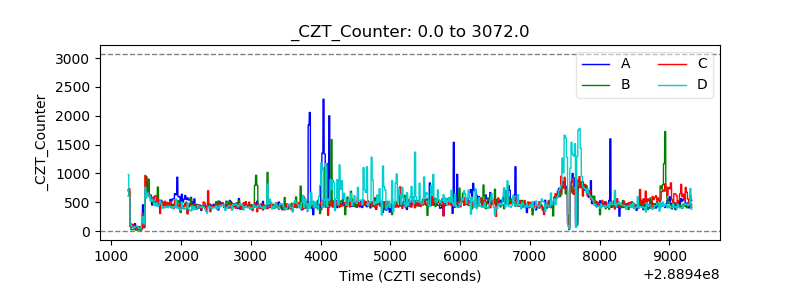 |
| +2.5 Volts monitor | 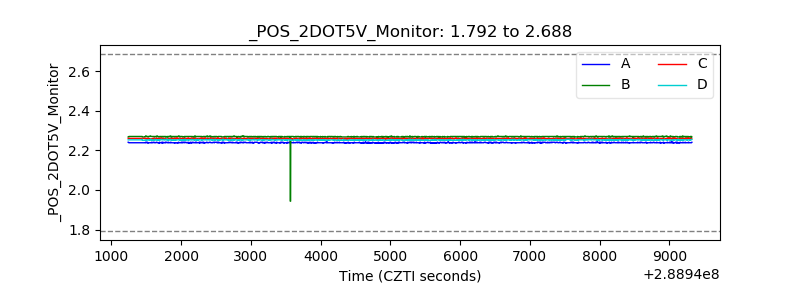 |
| +5 Volts monitor |  |
| _ROLL_ROT | 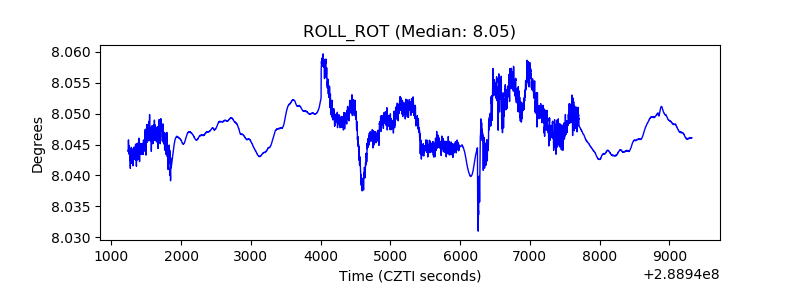 |
| _Roll_DEC | 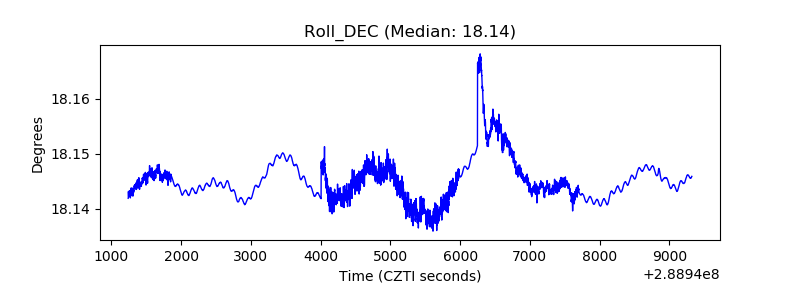 |
| _Roll_RA | 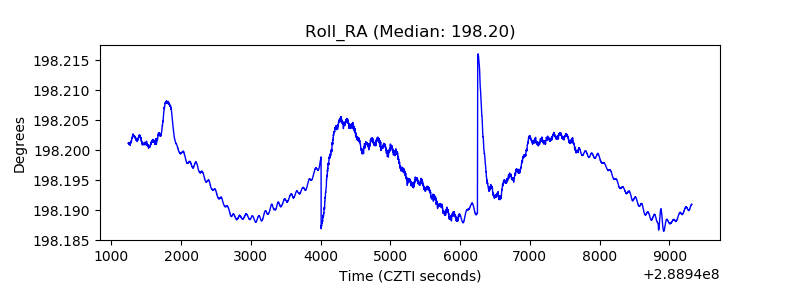 |
| Veto Counter | 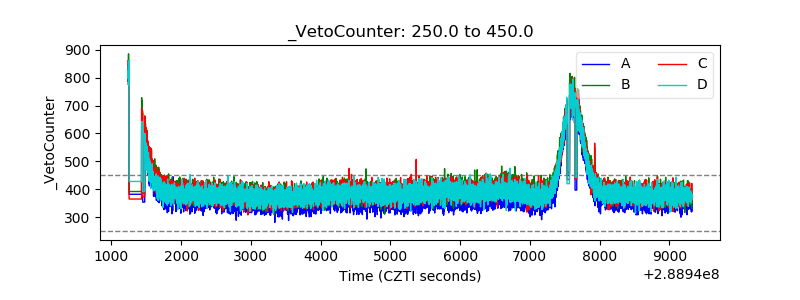 |