| Param | Original file | Final file |
|---|---|---|
| Filename | modeM0/AS1A05_072T02_9000002736_18477cztM0_level2.evt | modeM0/AS1A05_072T02_9000002736_18477cztM0_level2_quad_clean.evt |
| Size (bytes) | 269,147,520 | 29,234,880 |
| Size | 256.7 MB | 27.9 MB |
| Events in quadrant A | 1,628,426 | 158,962 |
| Events in quadrant B | 1,801,877 | 162,251 |
| Events in quadrant C | 2,733,988 | 154,989 |
| Events in quadrant D | 1,741,704 | 154,365 |
| Mode M0 | |||
|---|---|---|---|
| Quadrant | BADHDUFLAG | Total packets | Discarded packets |
| A | 0 | 7195 | 0 |
| B | 0 | 7644 | 0 |
| C | 0 | 10700 | 0 |
| D | 0 | 7599 | 0 |
| Mode SS | |||
|---|---|---|---|
| Quadrant | BADHDUFLAG | Total packets | Discarded packets |
| A | 0 | 72 | 0 |
| B | 0 | 72 | 0 |
| C | 0 | 72 | 0 |
| D | 0 | 72 | 0 |
| Quadrant | Total seconds | Saturated seconds | Saturation percentage |
|---|---|---|---|
| A | 3585 | 2 | 0.055788% |
| B | 3586 | 14 | 0.390407% |
| C | 3586 | 59 | 1.645287% |
| D | 3586 | 19 | 0.529838% |
Noise dominated data is calculated using 1-second bins in cleaned event files. If a bin has >2000 counts, and if more than 50% of those come from <1% of pixels, then it is considered to be noise-dominated and hence unusable.
| Quadrant | # 1 sec bins | Bins with >0 counts | Bins with >2000 counts | High rate bins dominated by noise | Noise dominated (total time) | Noise dominated (detector-on time) | Marked lightcurve |
|---|---|---|---|---|---|---|---|
| A | 3585 | 3585 | 0 | 0 | 0.00% | 0.00% | 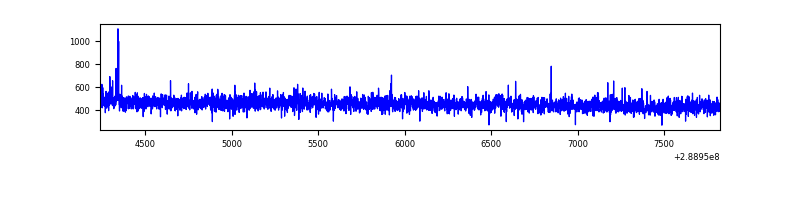 |
| B | 3586 | 3586 | 9 | 9 | 0.25% | 0.25% | 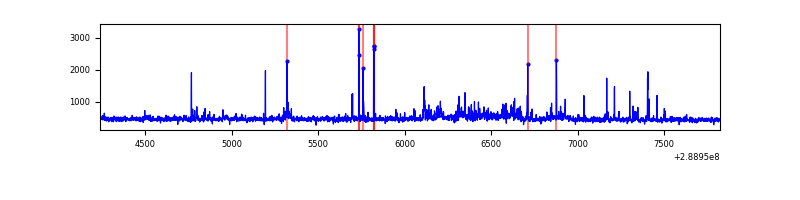 |
| C | 3586 | 3586 | 0 | 0 | 0.00% | 0.00% | 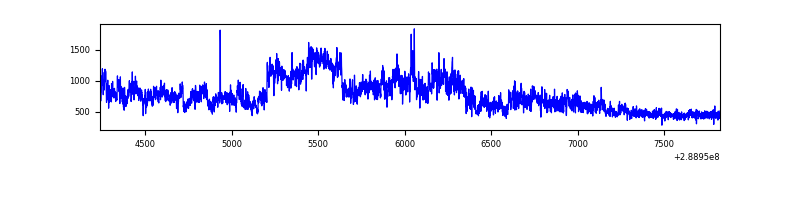 |
| D | 3586 | 3586 | 15 | 15 | 0.42% | 0.42% | 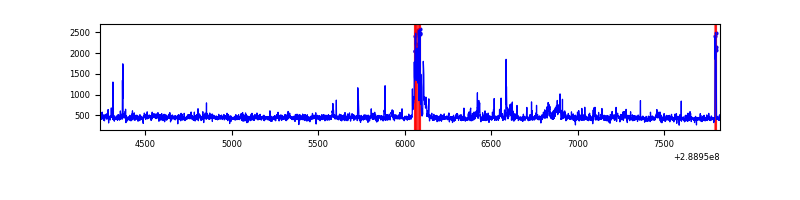 |
Top three noisy pixels from each quadrant. If the there are fewer than three noisy pixels in the level2.evt file, extra rows are filled as -1
| Pixel properties | Quadrant properties | ||||||
|---|---|---|---|---|---|---|---|
| Quadrant | DetID | PixID | Counts | Sigma | Mean | Median | Sigma |
| A | 0 | 13 | 6776 | 72.65 | 420 | 412 | 87.6 |
| A | 13 | 254 | 3872 | 39.5 | 420 | 412 | 87.6 |
| A | 0 | 226 | 3734 | 37.92 | 420 | 412 | 87.6 |
| B | 10 | 245 | 101727 | 1236.42 | 417 | 406 | 81.9 |
| B | 0 | 245 | 16864 | 200.84 | 417 | 406 | 81.9 |
| B | 15 | 222 | 12104 | 142.75 | 417 | 406 | 81.9 |
| C | 3 | 233 | 1096814 | 11483.02 | 399 | 401 | 95.5 |
| C | 14 | 238 | 62386 | 649.19 | 399 | 401 | 95.5 |
| C | 0 | 207 | 8826 | 88.24 | 399 | 401 | 95.5 |
| D | 7 | 38 | 87796 | 855.86 | 410 | 396 | 102.1 |
| D | 13 | 168 | 35326 | 342.05 | 410 | 396 | 102.1 |
| D | 2 | 234 | 19151 | 183.65 | 410 | 396 | 102.1 |
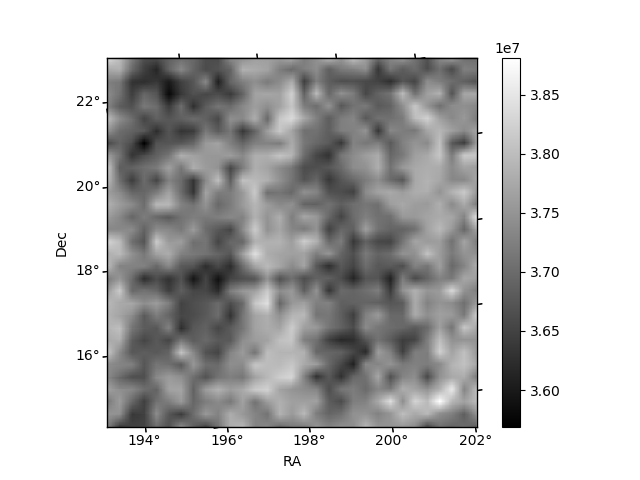
Histogram calculated using DETX and DETY for each event in the final _common_clean file
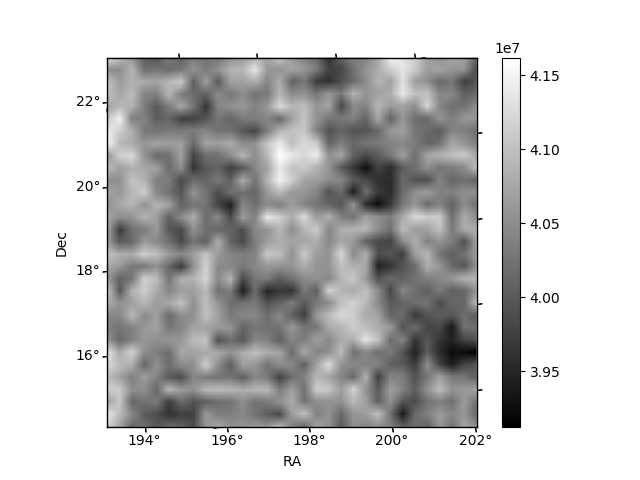
| Quadrant A | 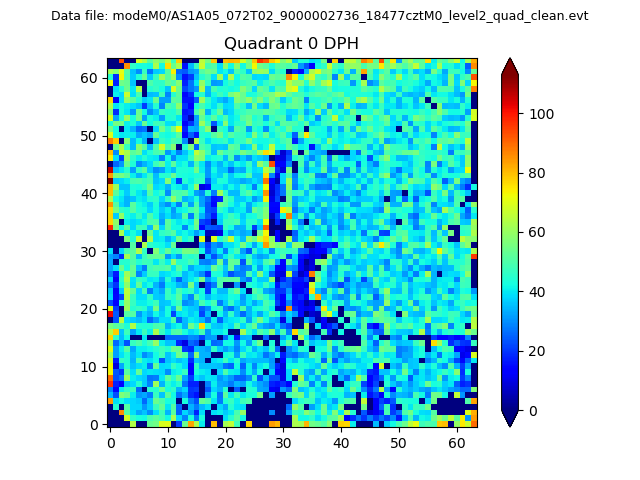 |
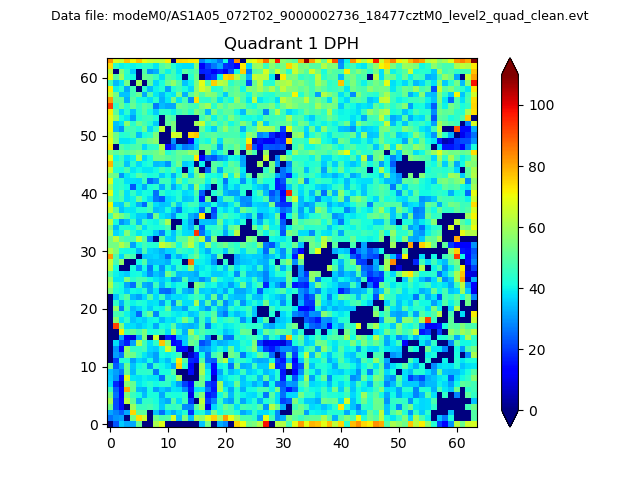 |
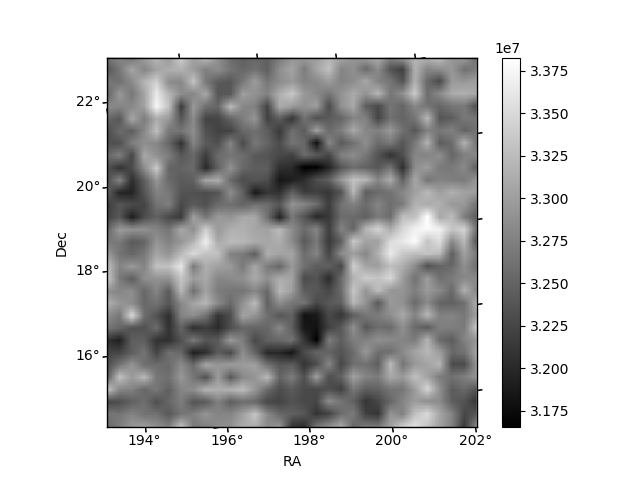
Quadrant B |
|---|---|---|---|
| Quadrant D | 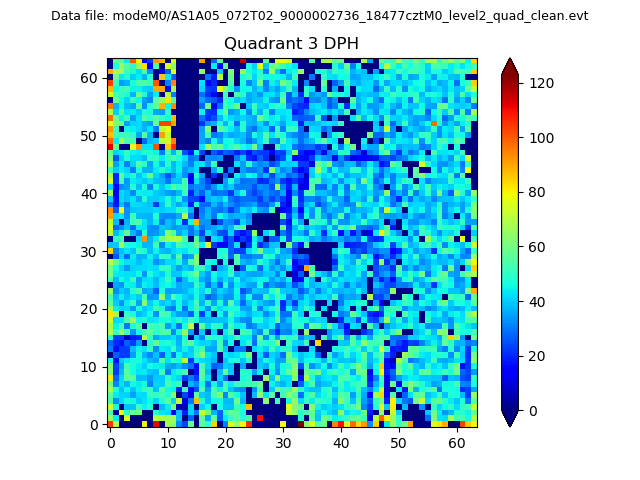 |
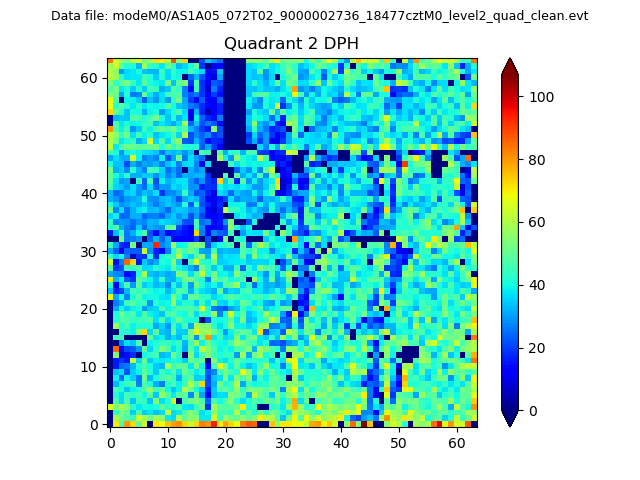 |
Quadrant C |
| Plot type | Count rate plots | Images |
|---|---|---|
| Comparison with Poisson distribution Blue bars denote a histogram of data divided into 1 sec bins. Red curve is a Poisson curve with rate = median count rate of data. |
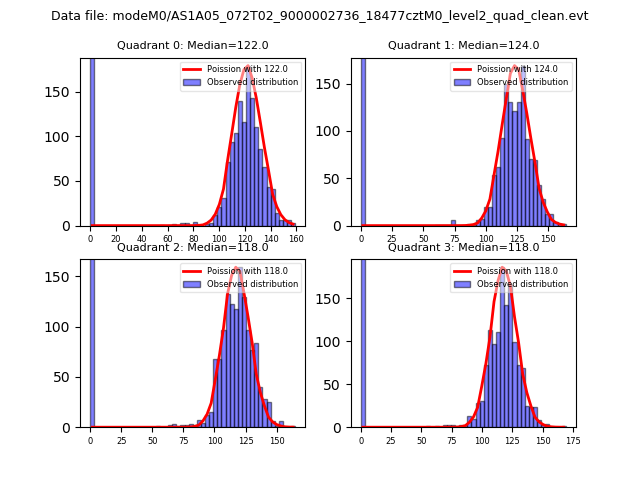 |
 |
| Quadrant-wise count rates Data is divided into 100 sec bins |
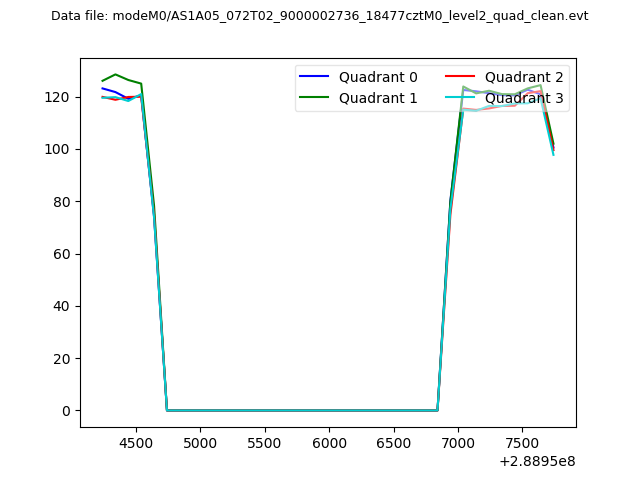 |
|
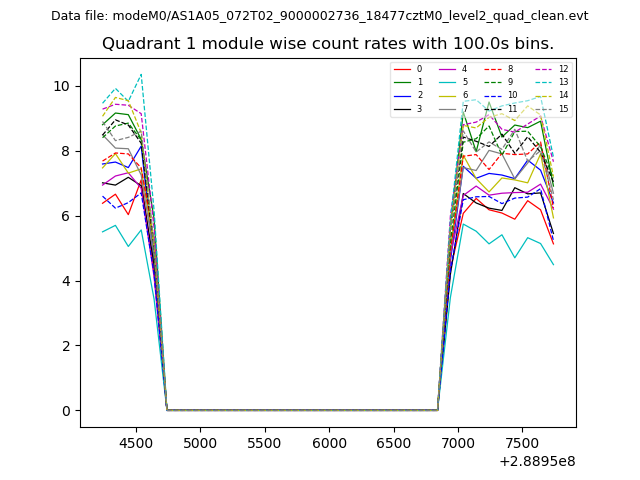
| Module-wise count rates for Quadrant A Data is divided into 100 sec bins |
 |
 |
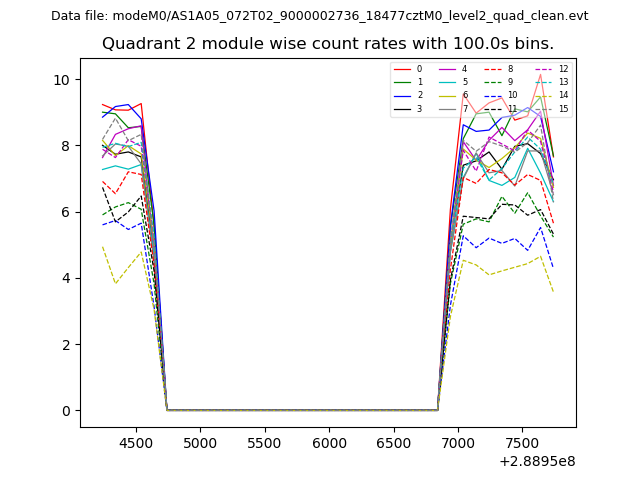
| Module-wise count rates for Quadrant B Data is divided into 100 sec bins |
 |
 |
| Module-wise count rates for Quadrant C Data is divided into 100 sec bins |
 |
 |
| Module-wise count rates for Quadrant D Data is divided into 100 sec bins |
 |
 |
| Parameter | Plot |
|---|---|
| CZT HV Monitor |  |
| D_VDD | 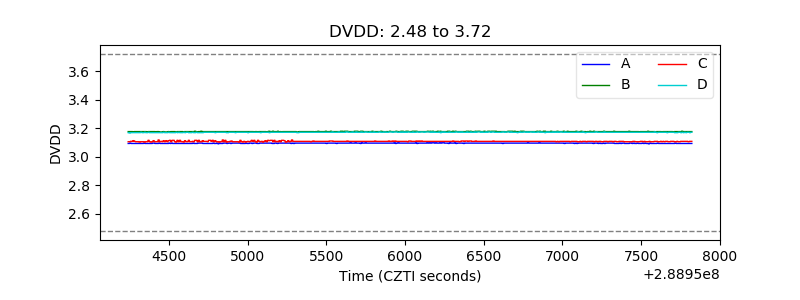 |
| Temperature 1 | 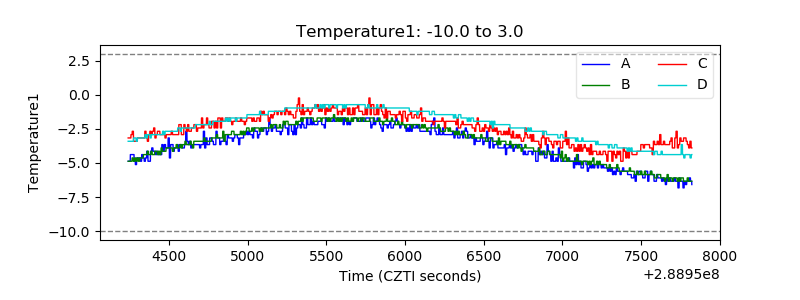 |
| Veto HV Monitor | 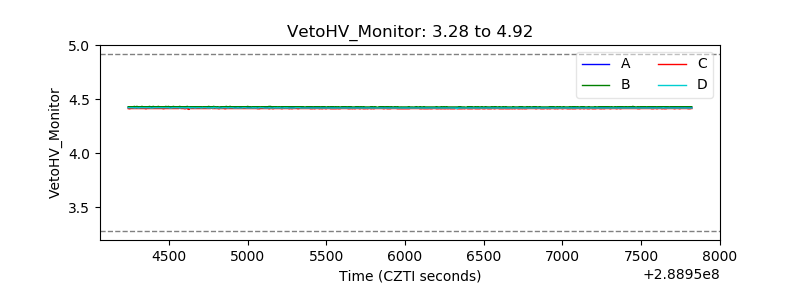 |
| Veto LLD | 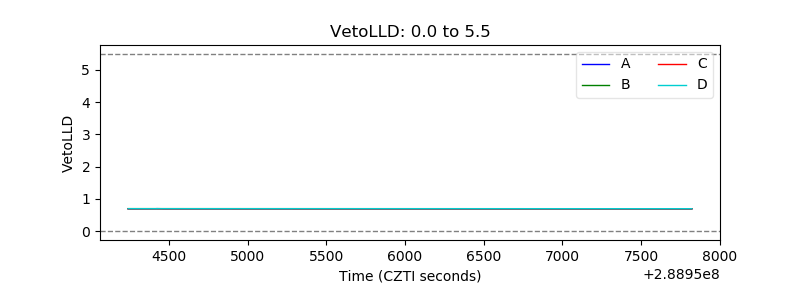 |
| Alpha Counter | 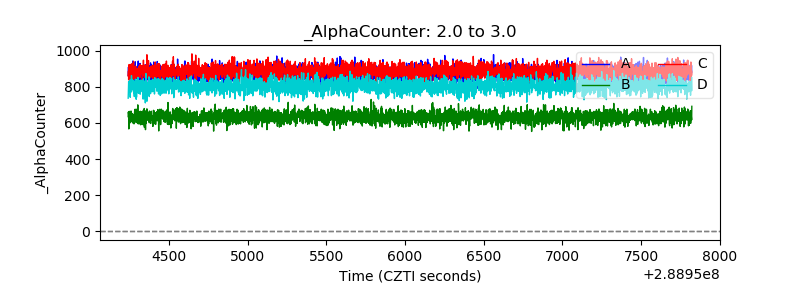 |
| _CPM_Rate | 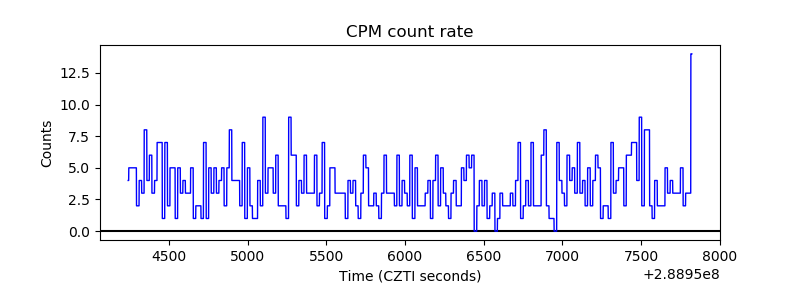 |
| CZT Counter | 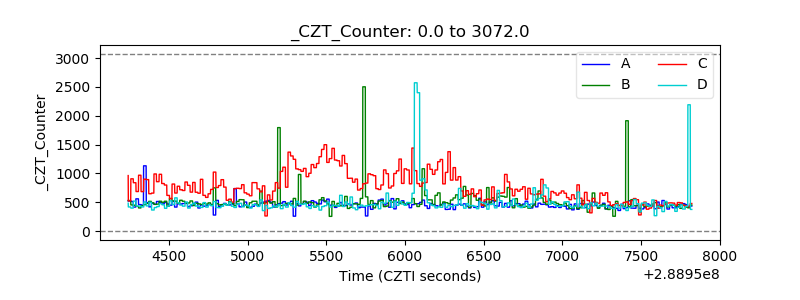 |
| +2.5 Volts monitor |  |
| +5 Volts monitor | 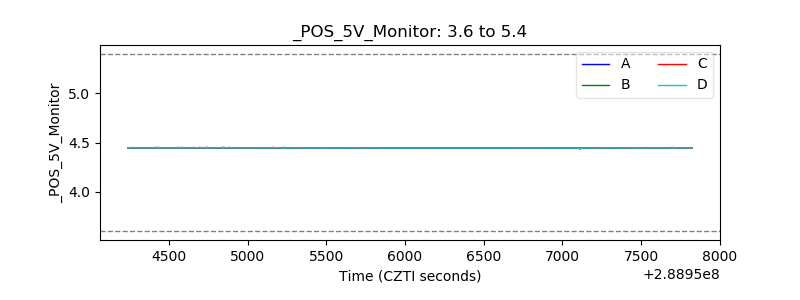 |
| _ROLL_ROT |  |
| _Roll_DEC | 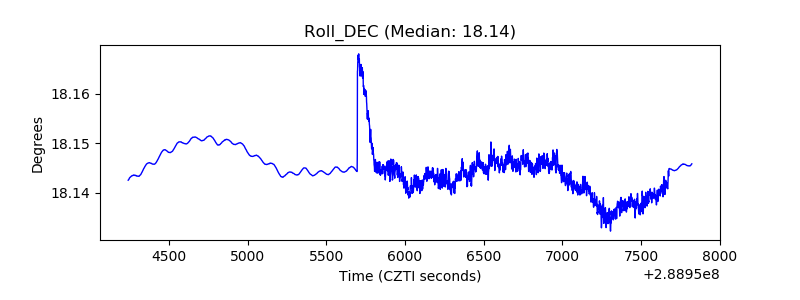 |
| _Roll_RA | 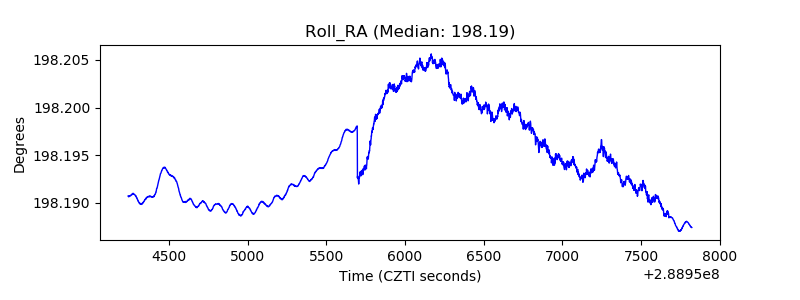 |
| Veto Counter | 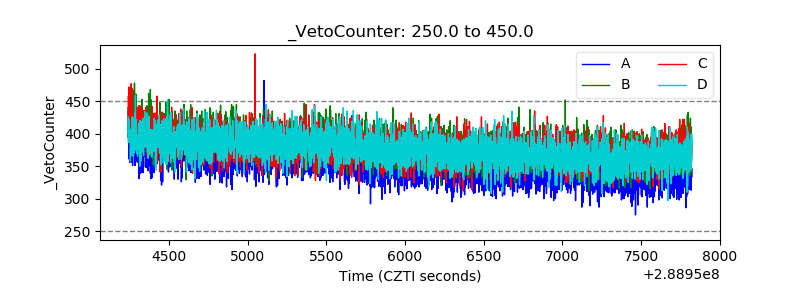 |