| Param | Original file | Final file |
|---|---|---|
| Filename | modeM0/AS1A05_144T02_9000002734cztM0_level2.fits | modeM0/AS1A05_144T02_9000002734cztM0_level2_quad_clean.evt |
| Size (bytes) | 403,251,840 | 458,611,200 |
| Size | 384.6 MB | 437.4 MB |
| Events in quadrant A | 2,387,076 | 2,759,656 |
| Events in quadrant B | 2,315,702 | 2,897,755 |
| Events in quadrant C | 2,415,734 | 2,744,722 |
| Events in quadrant D | 2,080,894 | 2,476,986 |
| Mode M0 | |||
|---|---|---|---|
| Quadrant | BADHDUFLAG | Total packets | Discarded packets |
| A | 0 | 111669 | 0 |
| B | 0 | 111175 | 0 |
| C | 0 | 90193 | 0 |
| D | 0 | 106436 | 0 |
| Mode SS | |||
|---|---|---|---|
| Quadrant | BADHDUFLAG | Total packets | Discarded packets |
| A | 0 | 892 | 0 |
| B | 0 | 892 | 0 |
| C | 0 | 892 | 0 |
| D | 0 | 892 | 0 |
| Mode M9 | |||
|---|---|---|---|
| Quadrant | BADHDUFLAG | Total packets | Discarded packets |
| A | 0 | 52 | 0 |
| B | 0 | 52 | 0 |
| C | 0 | 52 | 0 |
| D | 0 | 52 | 0 |
| Quadrant | Total seconds | Saturated seconds | Saturation percentage |
|---|---|---|---|
| A | 43855 | 2983 | 6.801961% |
| B | 43855 | 3041 | 6.934215% |
| C | 43855 | 696 | 1.587048% |
| D | 43855 | 1149 | 2.619998% |
Noise dominated data is calculated using 1-second bins in cleaned event files. If a bin has >2000 counts, and if more than 50% of those come from <1% of pixels, then it is considered to be noise-dominated and hence unusable.
| Quadrant | # 1 sec bins | Bins with >0 counts | Bins with >2000 counts | High rate bins dominated by noise | Noise dominated (total time) | Noise dominated (detector-on time) | Marked lightcurve |
|---|---|---|---|---|---|---|---|
| A | 49010 | 43802 | 0 | 0 | 0.00% | 0.00% |  |
| B | 49010 | 43791 | 0 | 0 | 0.00% | 0.00% |  |
| C | 49010 | 43850 | 0 | 0 | 0.00% | 0.00% |  |
| D | 49010 | 43843 | 0 | 0 | 0.00% | 0.00% |  |
Top three noisy pixels from each quadrant. If the there are fewer than three noisy pixels in the level2.evt file, extra rows are filled as -1
| Pixel properties | Quadrant properties | ||||||
|---|---|---|---|---|---|---|---|
| Quadrant | DetID | PixID | Counts | Sigma | Mean | Median | Sigma |
| A | 0 | 29 | 2109 | 9.75 | 620 | 581 | 156.7 |
| A | 7 | 110 | 1942 | 8.68 | 620 | 581 | 156.7 |
| A | 15 | 236 | 1797 | 7.76 | 620 | 581 | 156.7 |
| B | 2 | 9 | 1875 | 10.78 | 612 | 585 | 119.7 |
| B | 2 | 8 | 1549 | 8.06 | 612 | 585 | 119.7 |
| B | 14 | 254 | 1512 | 7.75 | 612 | 585 | 119.7 |
| C | 12 | 241 | 1784 | 7.17 | 638 | 593 | 166.1 |
| C | 2 | 191 | 1668 | 6.47 | 638 | 593 | 166.1 |
| C | 3 | 126 | 1586 | 5.98 | 638 | 593 | 166.1 |
| D | 3 | 14 | 1572 | 6.49 | 593 | 538 | 159.4 |
| D | 10 | 190 | 1554 | 6.38 | 593 | 538 | 159.4 |
| D | 6 | 231 | 1515 | 6.13 | 593 | 538 | 159.4 |
Histogram calculated using DETX and DETY for each event in the final _common_clean file
| Quadrant A | 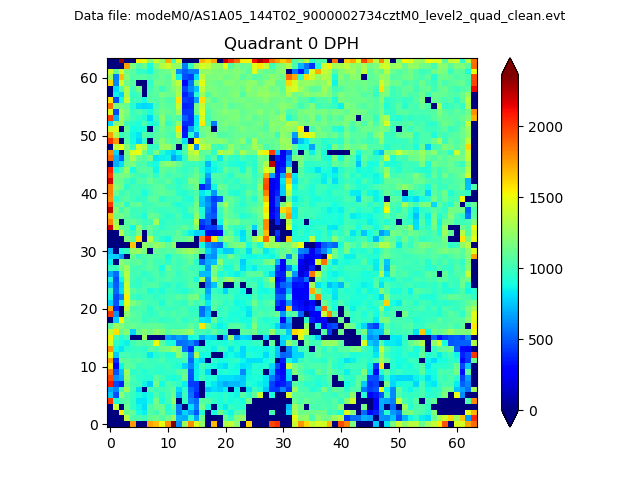 |
 |
Quadrant B |
|---|---|---|---|
| Quadrant D |  |
 |
Quadrant C |
| Plot type | Count rate plots | Images |
|---|---|---|
| Comparison with Poisson distribution Blue bars denote a histogram of data divided into 1 sec bins. Red curve is a Poisson curve with rate = median count rate of data. |
 |
 |
| Quadrant-wise count rates Data is divided into 100 sec bins |
 |
|
| Module-wise count rates for Quadrant A Data is divided into 100 sec bins |
 |
 |
| Module-wise count rates for Quadrant B Data is divided into 100 sec bins |
 |
 |
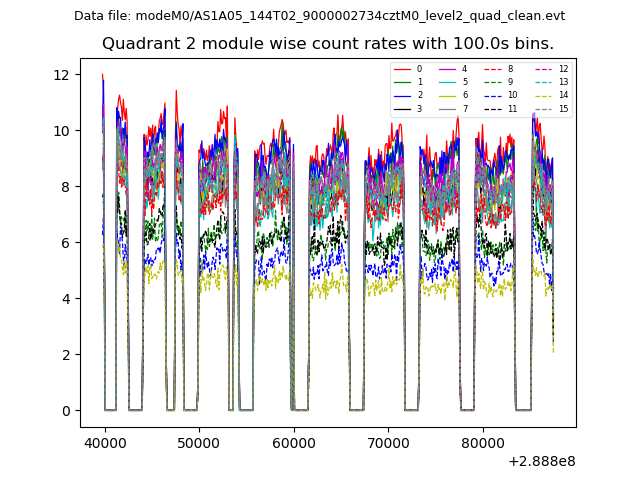
| Module-wise count rates for Quadrant C Data is divided into 100 sec bins |
 |
 |
| Module-wise count rates for Quadrant D Data is divided into 100 sec bins |
 |
 |
| Parameter | Plot |
|---|---|
| CZT HV Monitor |  |
| D_VDD | 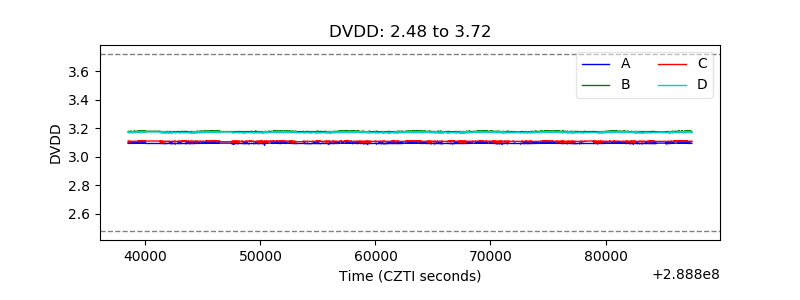 |
| Temperature 1 |  |
| Veto HV Monitor |  |
| Veto LLD |  |
| Alpha Counter |  |
| _CPM_Rate |  |
| CZT Counter |  |
| +2.5 Volts monitor |  |
| +5 Volts monitor |  |
| _ROLL_ROT |  |
| _Roll_DEC |  |
| _Roll_RA |  |
| Veto Counter |  |