| Param | Original file | Final file |
|---|---|---|
| Filename | modeM0/AS1A05_144T02_9000002734_18458cztM0_level2.evt | modeM0/AS1A05_144T02_9000002734_18458cztM0_level2_quad_clean.evt |
| Size (bytes) | 531,169,920 | 98,136,000 |
| Size | 506.6 MB | 93.6 MB |
| Events in quadrant A | 3,769,130 | 616,688 |
| Events in quadrant B | 4,075,069 | 638,845 |
| Events in quadrant C | 3,558,413 | 604,109 |
| Events in quadrant D | 4,171,590 | 587,070 |
| Mode M0 | |||
|---|---|---|---|
| Quadrant | BADHDUFLAG | Total packets | Discarded packets |
| A | 0 | 16473 | 2 |
| B | 0 | 17062 | 2 |
| C | 0 | 15658 | 2 |
| D | 0 | 17647 | 2 |
| Mode SS | |||
|---|---|---|---|
| Quadrant | BADHDUFLAG | Total packets | Discarded packets |
| A | 0 | 156 | 0 |
| B | 0 | 156 | 0 |
| C | 0 | 156 | 0 |
| D | 0 | 156 | 0 |
| Mode M9 | |||
|---|---|---|---|
| Quadrant | BADHDUFLAG | Total packets | Discarded packets |
| A | 0 | 14 | 0 |
| B | 0 | 14 | 0 |
| C | 0 | 14 | 0 |
| D | 0 | 14 | 0 |
| Quadrant | Total seconds | Saturated seconds | Saturation percentage |
|---|---|---|---|
| A | 7542 | 136 | 1.803235% |
| B | 7543 | 234 | 3.102214% |
| C | 7543 | 133 | 1.763224% |
| D | 7542 | 102 | 1.352426% |
Noise dominated data is calculated using 1-second bins in cleaned event files. If a bin has >2000 counts, and if more than 50% of those come from <1% of pixels, then it is considered to be noise-dominated and hence unusable.
| Quadrant | # 1 sec bins | Bins with >0 counts | Bins with >2000 counts | High rate bins dominated by noise | Noise dominated (total time) | Noise dominated (detector-on time) | Marked lightcurve |
|---|---|---|---|---|---|---|---|
| A | 9082 | 7543 | 36 | 36 | 0.40% | 0.48% | 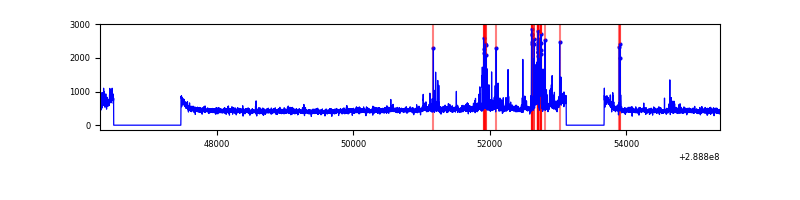 |
| B | 9083 | 7543 | 51 | 51 | 0.56% | 0.68% | 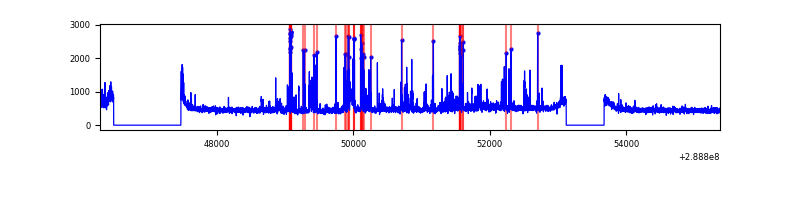 |
| C | 9083 | 7545 | 0 | 0 | 0.00% | 0.00% | 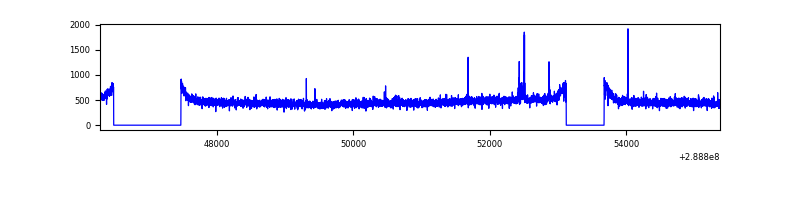 |
| D | 9082 | 7544 | 18 | 18 | 0.20% | 0.24% | 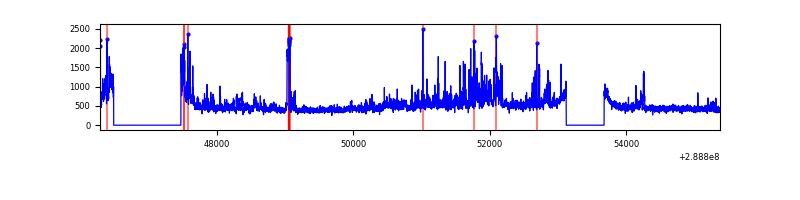 |
Top three noisy pixels from each quadrant. If the there are fewer than three noisy pixels in the level2.evt file, extra rows are filled as -1
| Pixel properties | Quadrant properties | ||||||
|---|---|---|---|---|---|---|---|
| Quadrant | DetID | PixID | Counts | Sigma | Mean | Median | Sigma |
| A | 0 | 13 | 260971 | 1442.53 | 890 | 870 | 180.3 |
| A | 14 | 238 | 49729 | 270.97 | 890 | 870 | 180.3 |
| A | 4 | 2 | 20668 | 109.8 | 890 | 870 | 180.3 |
| B | 10 | 245 | 393483 | 2310.58 | 901 | 880 | 169.9 |
| B | 7 | 220 | 115568 | 674.97 | 901 | 880 | 169.9 |
| B | 0 | 245 | 29369 | 167.67 | 901 | 880 | 169.9 |
| C | 14 | 238 | 135101 | 669.01 | 866 | 868 | 200.6 |
| C | 9 | 54 | 28091 | 135.68 | 866 | 868 | 200.6 |
| C | 3 | 233 | 21846 | 104.55 | 866 | 868 | 200.6 |
| D | 13 | 168 | 300686 | 1426.06 | 869 | 843 | 210.3 |
| D | 7 | 238 | 171906 | 813.58 | 869 | 843 | 210.3 |
| D | 1 | 52 | 148670 | 703.07 | 869 | 843 | 210.3 |
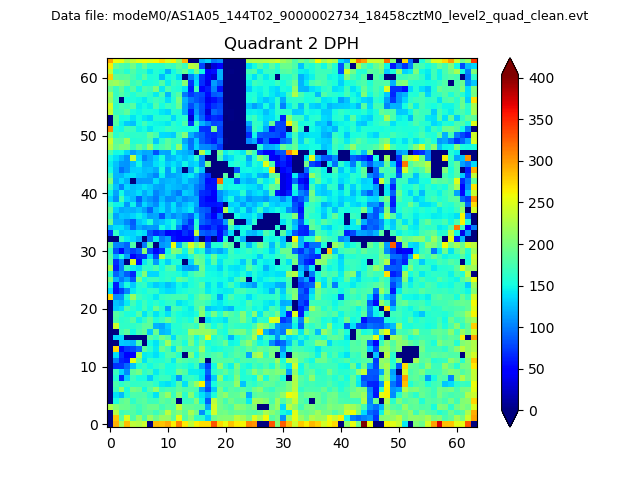
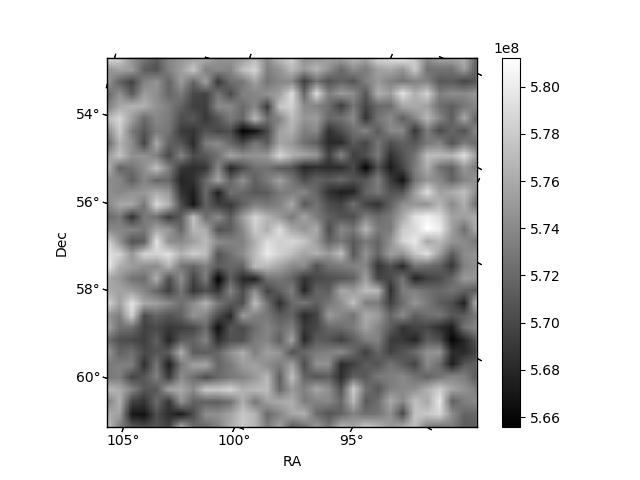
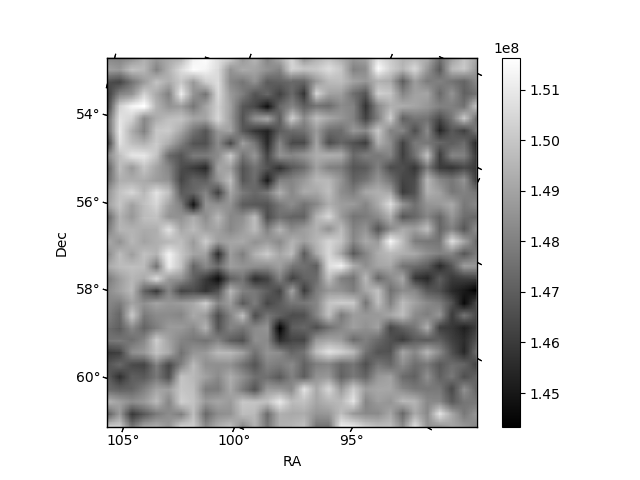
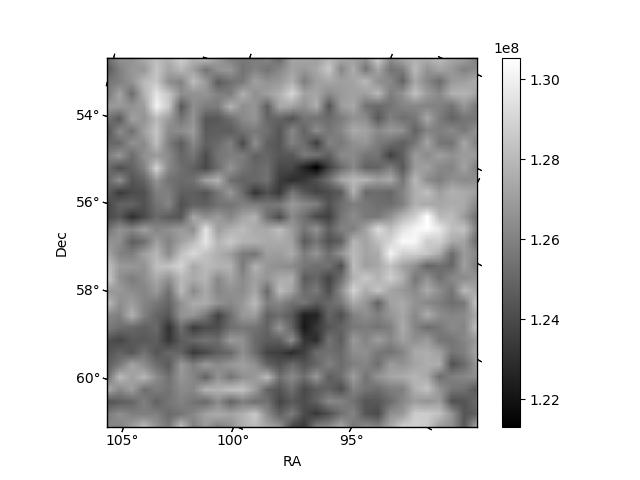
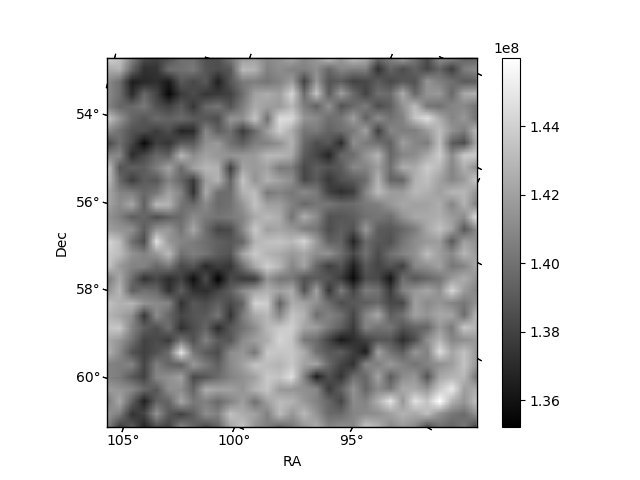
Histogram calculated using DETX and DETY for each event in the final _common_clean file
| Quadrant A | 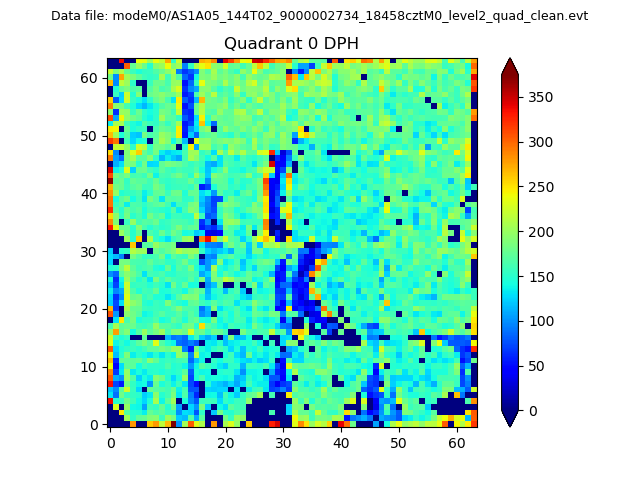 |
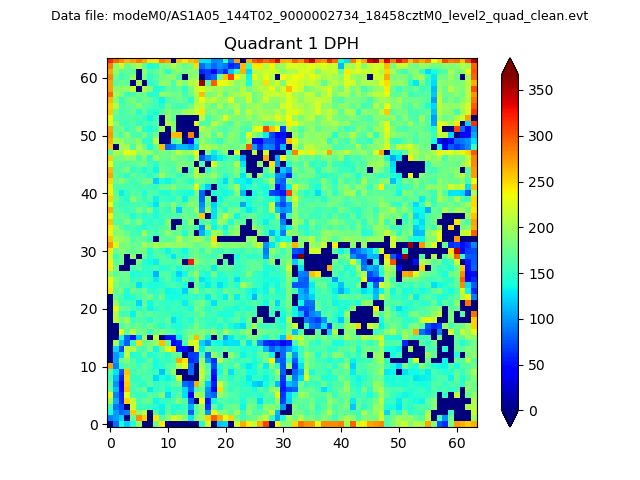 |
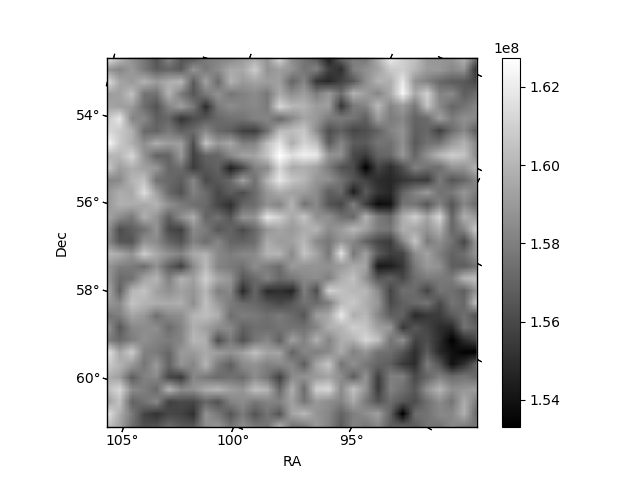
Quadrant B |
|---|---|---|---|
| Quadrant D | 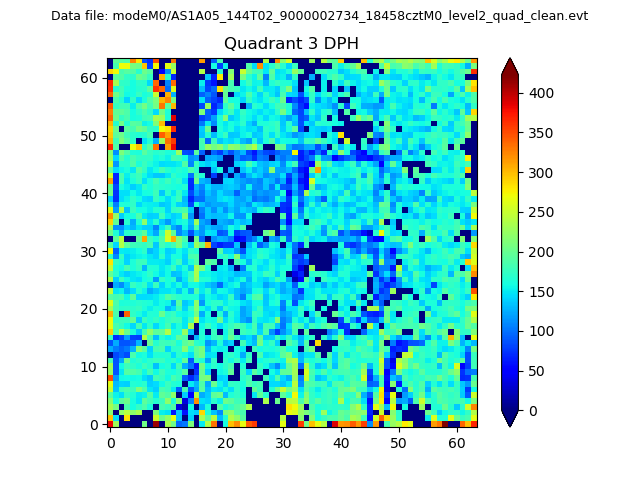 |
 |
Quadrant C |
| Plot type | Count rate plots | Images |
|---|---|---|
| Comparison with Poisson distribution Blue bars denote a histogram of data divided into 1 sec bins. Red curve is a Poisson curve with rate = median count rate of data. |
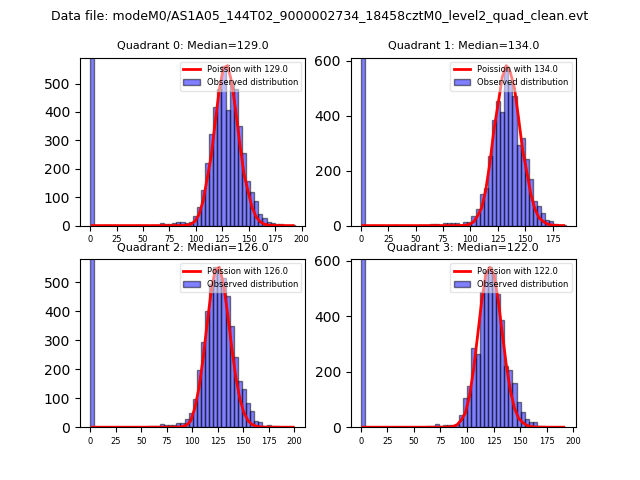 |
 |
| Quadrant-wise count rates Data is divided into 100 sec bins |
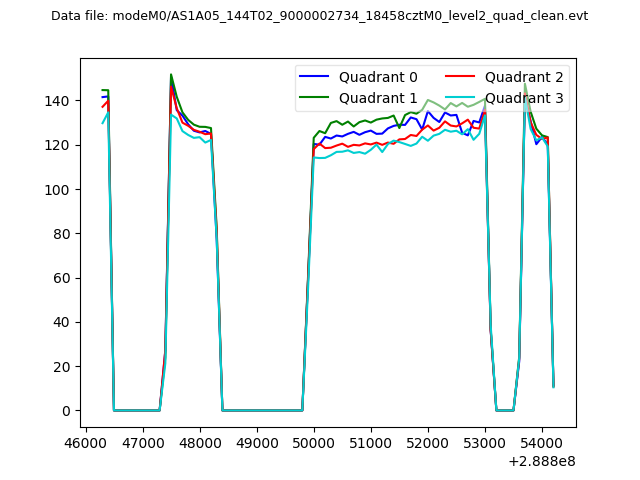 |
|
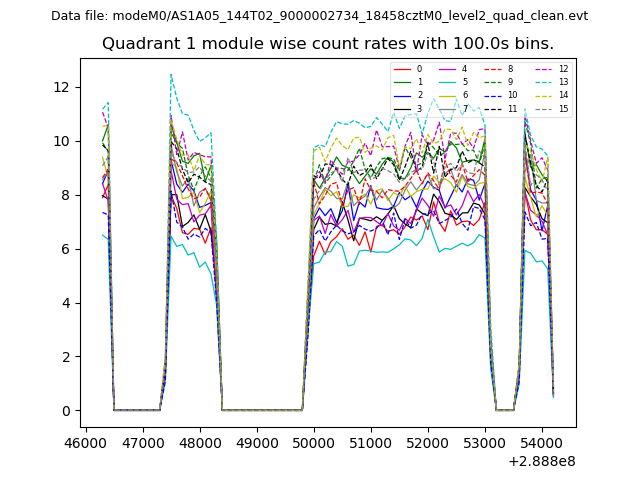
| Module-wise count rates for Quadrant A Data is divided into 100 sec bins |
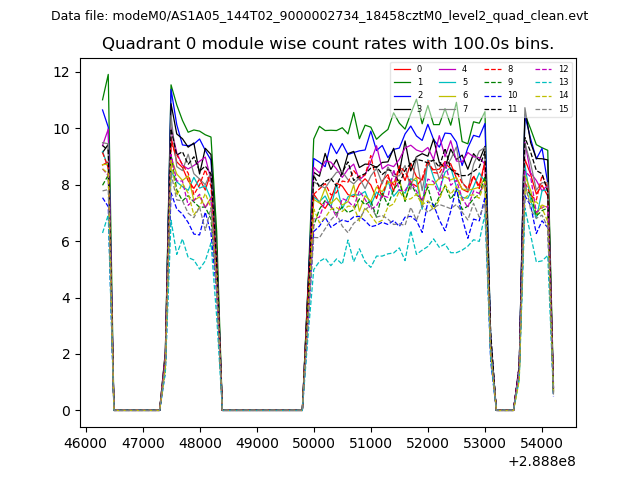 |
 |
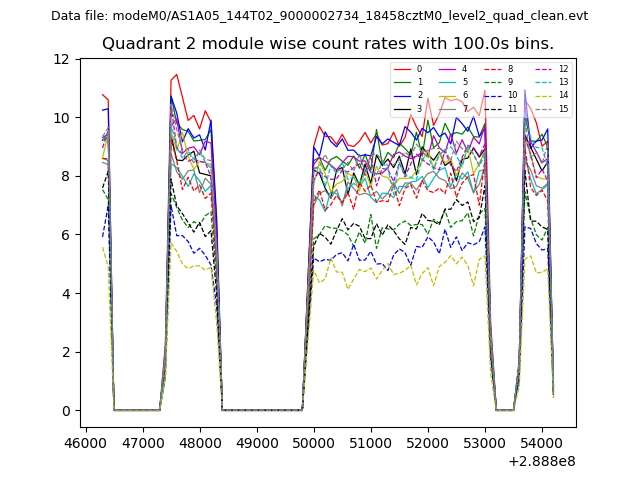
| Module-wise count rates for Quadrant B Data is divided into 100 sec bins |
 |
 |
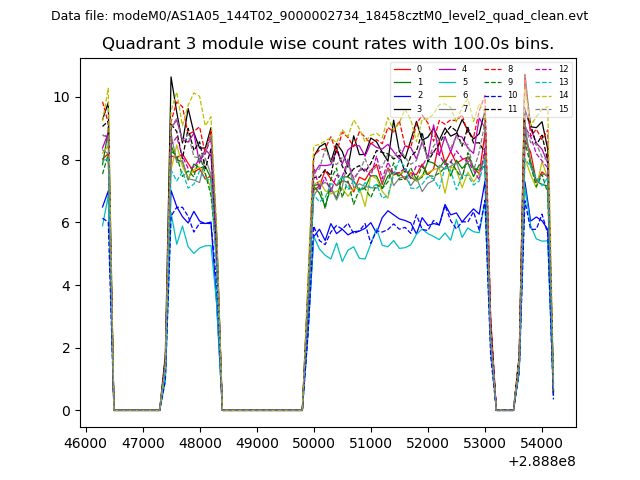
| Module-wise count rates for Quadrant C Data is divided into 100 sec bins |
 |
 |
| Module-wise count rates for Quadrant D Data is divided into 100 sec bins |
 |
 |
| Parameter | Plot |
|---|---|
| CZT HV Monitor | 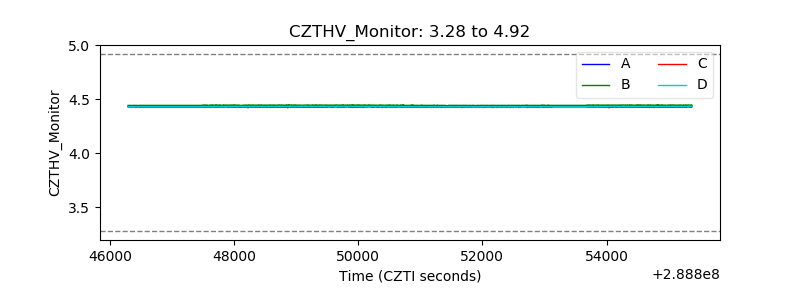 |
| D_VDD | 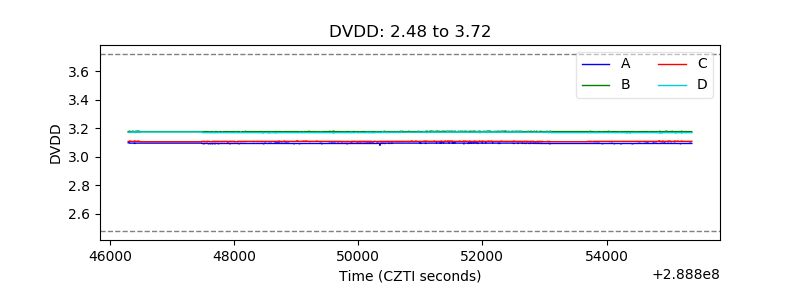 |
| Temperature 1 | 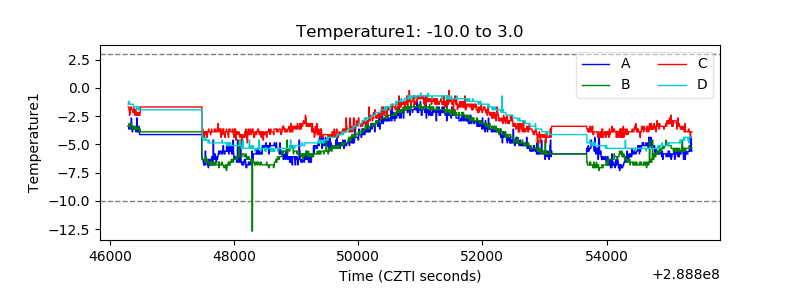 |
| Veto HV Monitor | 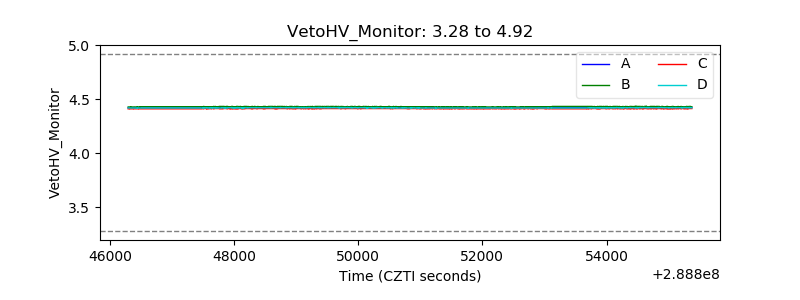 |
| Veto LLD | 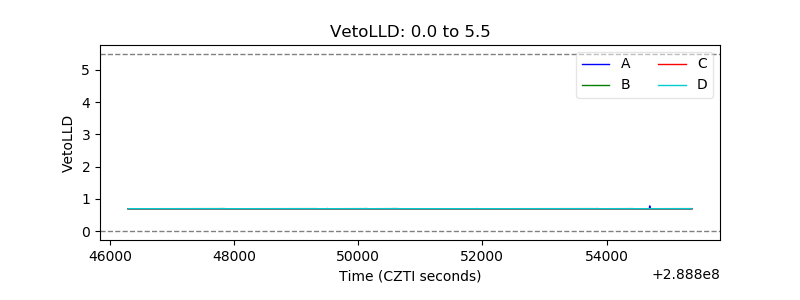 |
| Alpha Counter | 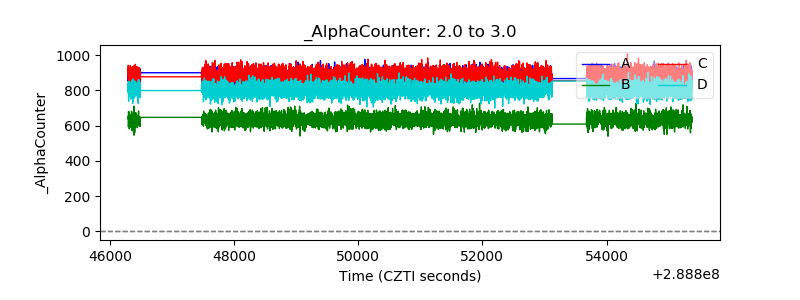 |
| _CPM_Rate | 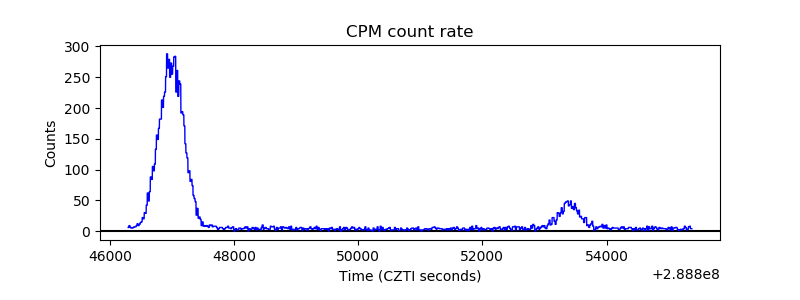 |
| CZT Counter | 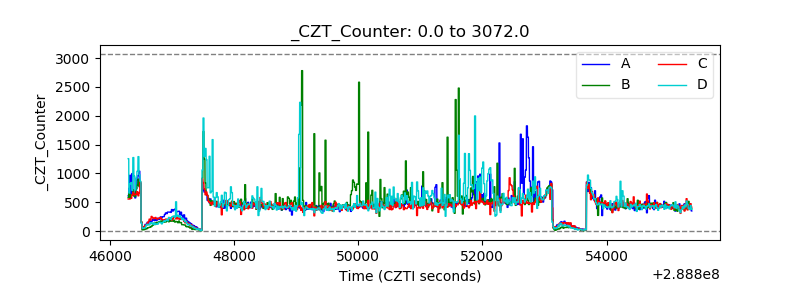 |
| +2.5 Volts monitor |  |
| +5 Volts monitor |  |
| _ROLL_ROT | 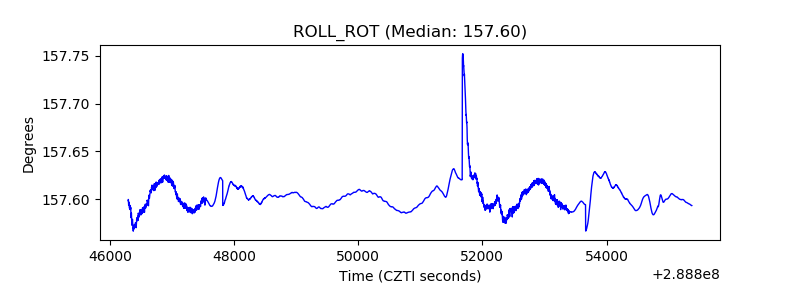 |
| _Roll_DEC | 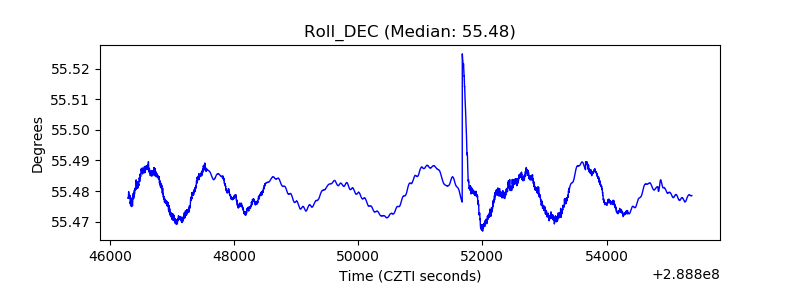 |
| _Roll_RA | 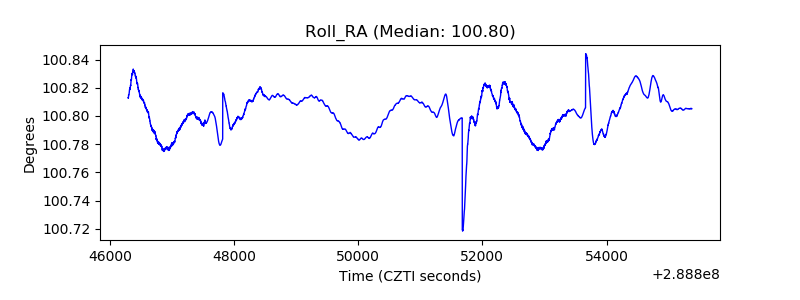 |
| Veto Counter | 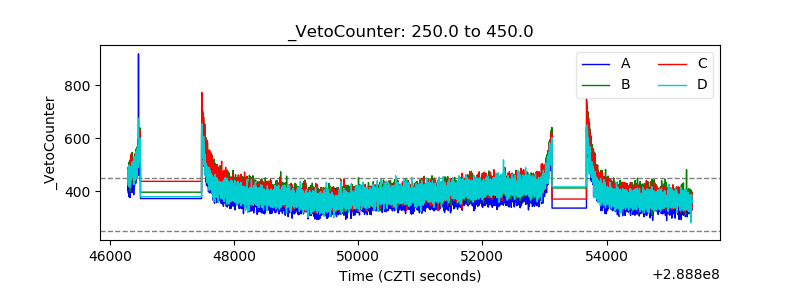 |