| Param | Original file | Final file |
|---|---|---|
| Filename | modeM0/AS1A05_144T02_9000002734_18459cztM0_level2.evt | modeM0/AS1A05_144T02_9000002734_18459cztM0_level2_quad_clean.evt |
| Size (bytes) | 594,685,440 | 104,353,920 |
| Size | 567.1 MB | 99.5 MB |
| Events in quadrant A | 4,722,431 | 649,702 |
| Events in quadrant B | 4,215,096 | 676,611 |
| Events in quadrant C | 3,900,786 | 641,011 |
| Events in quadrant D | 4,614,002 | 621,610 |
| Mode M0 | |||
|---|---|---|---|
| Quadrant | BADHDUFLAG | Total packets | Discarded packets |
| A | 0 | 19605 | 2 |
| B | 0 | 17890 | 2 |
| C | 0 | 17025 | 2 |
| D | 0 | 19424 | 2 |
| Mode SS | |||
|---|---|---|---|
| Quadrant | BADHDUFLAG | Total packets | Discarded packets |
| A | 0 | 168 | 0 |
| B | 0 | 168 | 0 |
| C | 0 | 168 | 0 |
| D | 0 | 168 | 0 |
| Mode M9 | |||
|---|---|---|---|
| Quadrant | BADHDUFLAG | Total packets | Discarded packets |
| A | 0 | 8 | 0 |
| B | 0 | 8 | 0 |
| C | 0 | 8 | 0 |
| D | 0 | 8 | 0 |
| Quadrant | Total seconds | Saturated seconds | Saturation percentage |
|---|---|---|---|
| A | 8219 | 399 | 4.854605% |
| B | 8220 | 286 | 3.479319% |
| C | 8220 | 203 | 2.469586% |
| D | 8220 | 192 | 2.335766% |
Noise dominated data is calculated using 1-second bins in cleaned event files. If a bin has >2000 counts, and if more than 50% of those come from <1% of pixels, then it is considered to be noise-dominated and hence unusable.
| Quadrant | # 1 sec bins | Bins with >0 counts | Bins with >2000 counts | High rate bins dominated by noise | Noise dominated (total time) | Noise dominated (detector-on time) | Marked lightcurve |
|---|---|---|---|---|---|---|---|
| A | 9009 | 8220 | 167 | 167 | 1.85% | 2.03% | 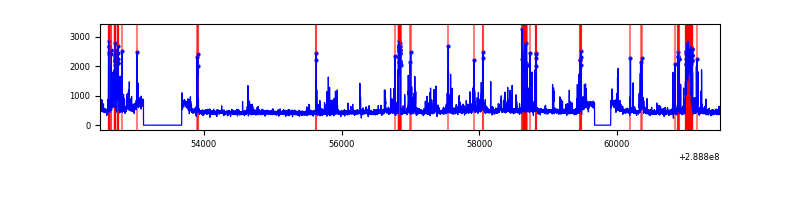 |
| B | 9010 | 8220 | 23 | 23 | 0.26% | 0.28% | 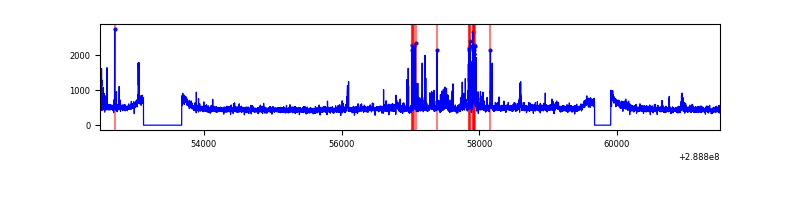 |
| C | 9010 | 8221 | 0 | 0 | 0.00% | 0.00% | 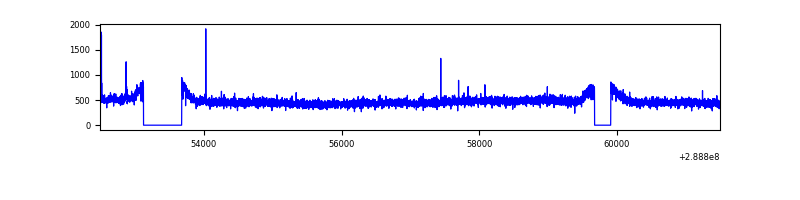 |
| D | 9010 | 8221 | 94 | 94 | 1.04% | 1.14% | 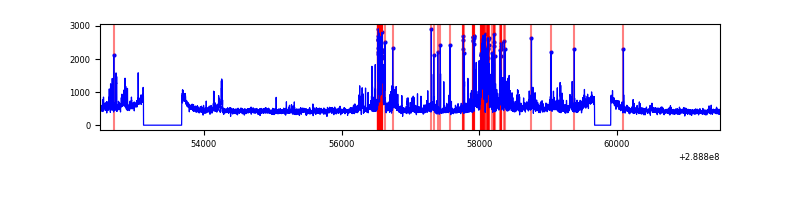 |
Top three noisy pixels from each quadrant. If the there are fewer than three noisy pixels in the level2.evt file, extra rows are filled as -1
| Pixel properties | Quadrant properties | ||||||
|---|---|---|---|---|---|---|---|
| Quadrant | DetID | PixID | Counts | Sigma | Mean | Median | Sigma |
| A | 0 | 13 | 793030 | 4060.18 | 967 | 946 | 195.1 |
| A | 14 | 238 | 149608 | 762.03 | 967 | 946 | 195.1 |
| A | 15 | 174 | 47008 | 236.11 | 967 | 946 | 195.1 |
| B | 10 | 245 | 135162 | 713.4 | 987 | 960 | 188.1 |
| B | 7 | 220 | 130126 | 686.63 | 987 | 960 | 188.1 |
| B | 12 | 111 | 22616 | 115.12 | 987 | 960 | 188.1 |
| C | 14 | 238 | 147101 | 660.26 | 948 | 951 | 221.4 |
| C | 3 | 233 | 35952 | 158.12 | 948 | 951 | 221.4 |
| C | 9 | 54 | 16871 | 71.92 | 948 | 951 | 221.4 |
| D | 7 | 238 | 258069 | 1113.0 | 953 | 921 | 231.0 |
| D | 14 | 34 | 257414 | 1110.16 | 953 | 921 | 231.0 |
| D | 13 | 168 | 217273 | 936.42 | 953 | 921 | 231.0 |
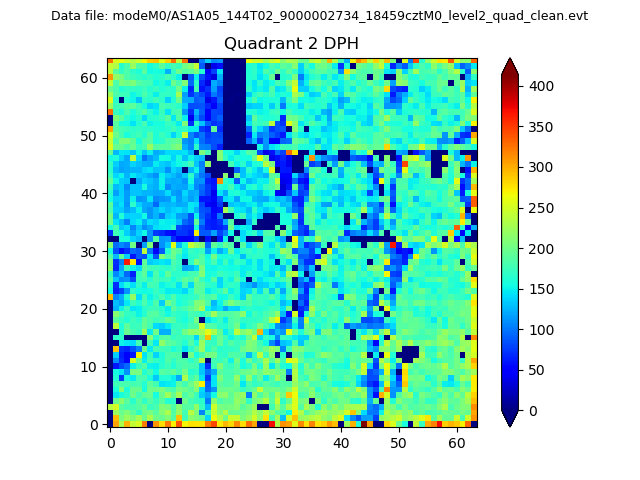
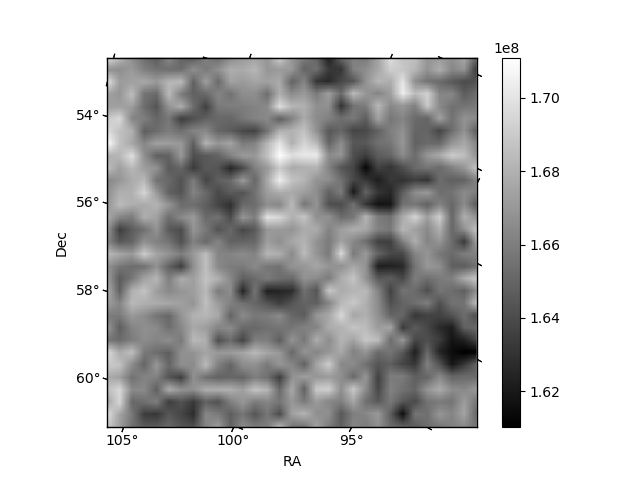
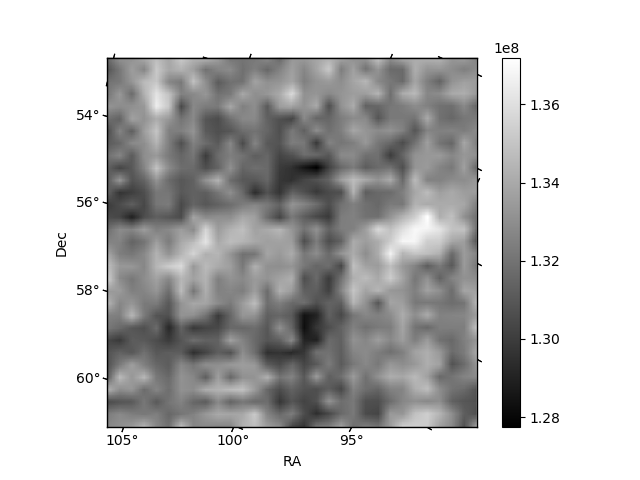
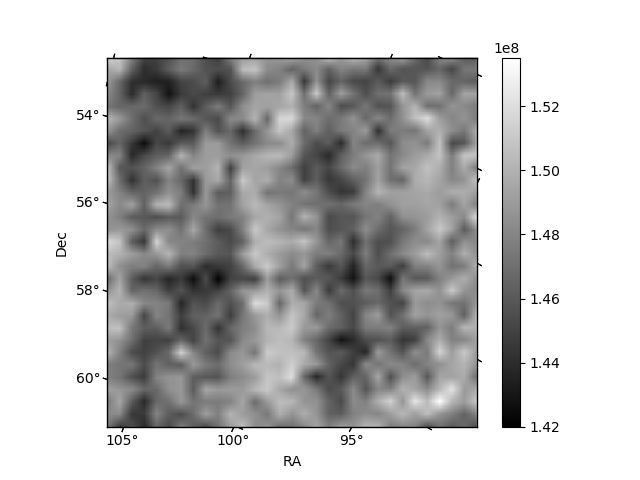
Histogram calculated using DETX and DETY for each event in the final _common_clean file
| Quadrant A | 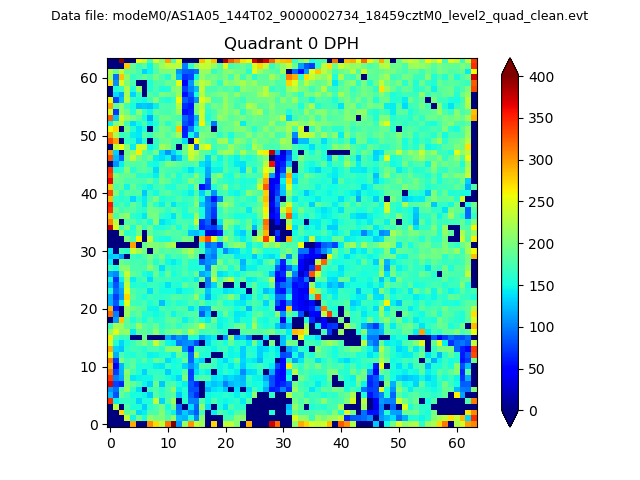 |
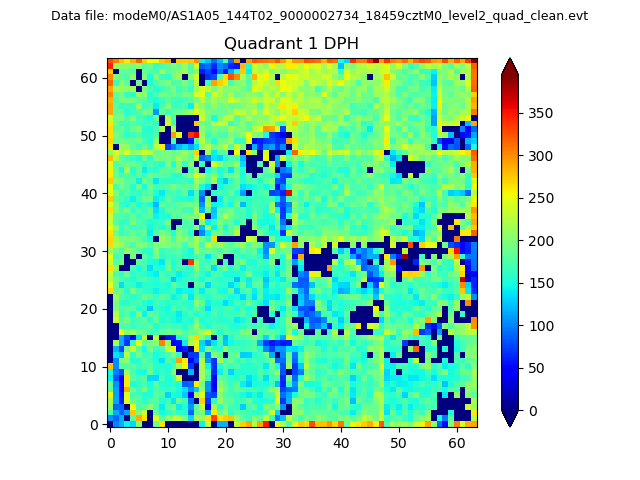 |
Quadrant B |
|---|---|---|---|
| Quadrant D | 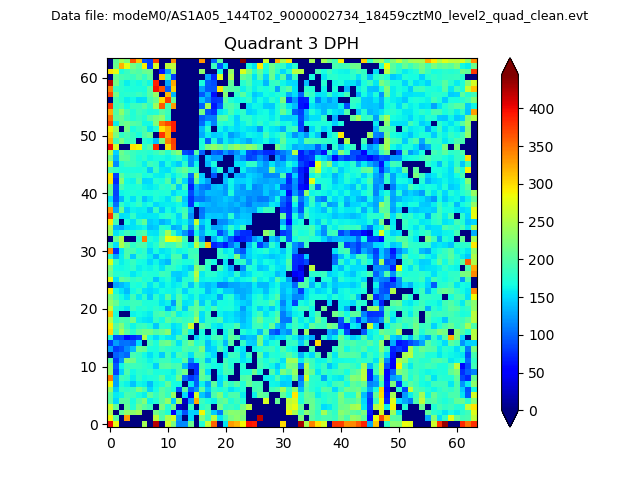 |
 |
Quadrant C |
| Plot type | Count rate plots | Images |
|---|---|---|
| Comparison with Poisson distribution Blue bars denote a histogram of data divided into 1 sec bins. Red curve is a Poisson curve with rate = median count rate of data. |
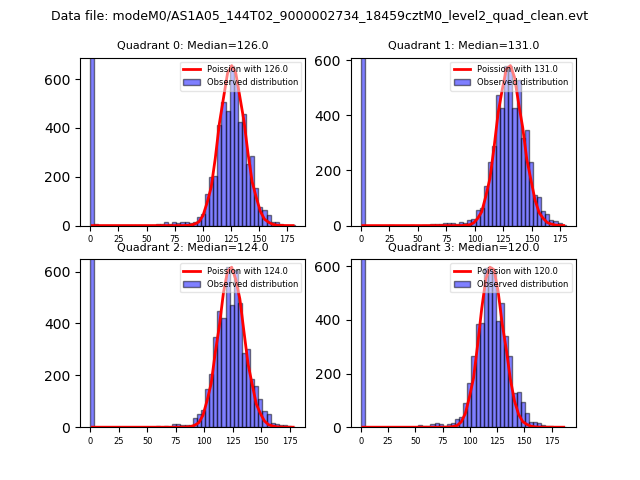 |
 |
| Quadrant-wise count rates Data is divided into 100 sec bins |
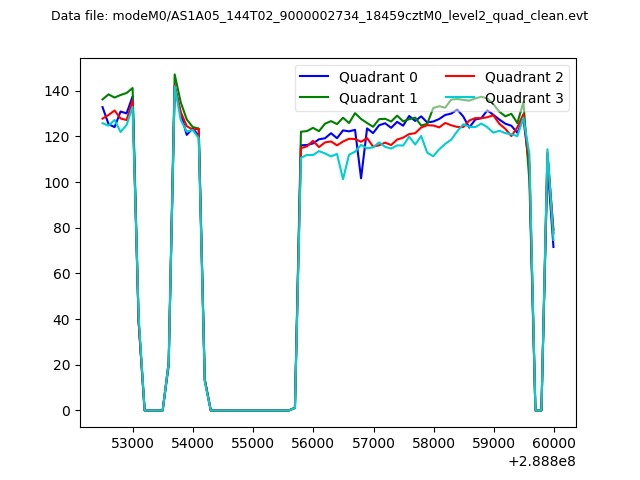 |
|
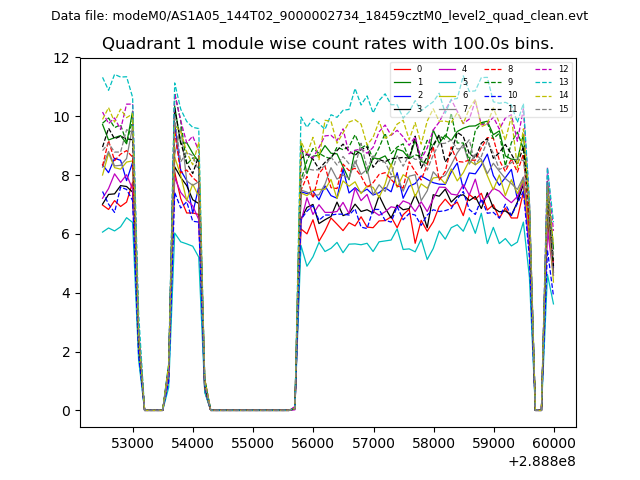
| Module-wise count rates for Quadrant A Data is divided into 100 sec bins |
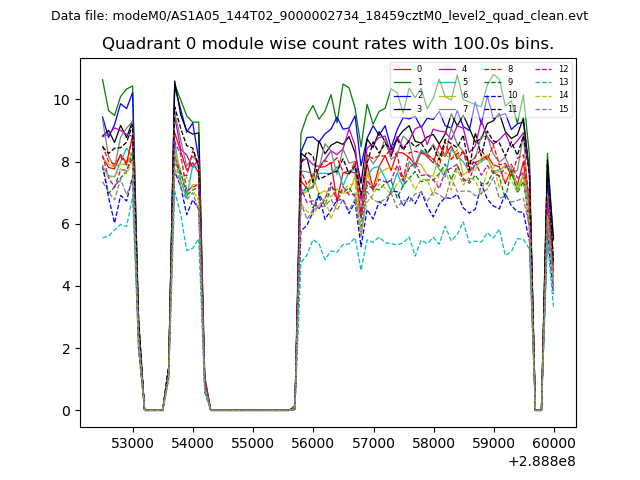 |
 |
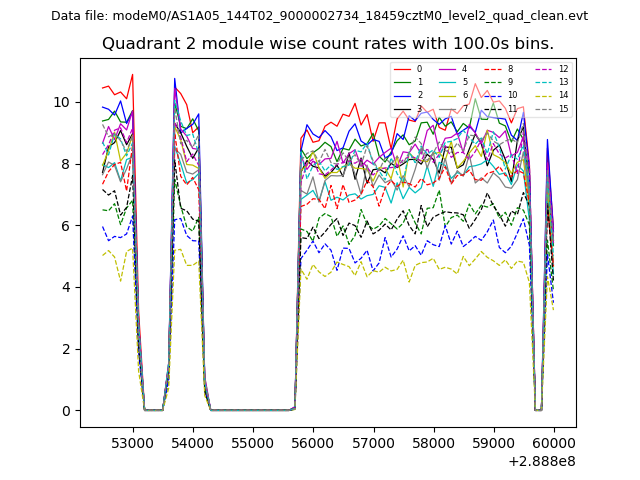
| Module-wise count rates for Quadrant B Data is divided into 100 sec bins |
 |
 |
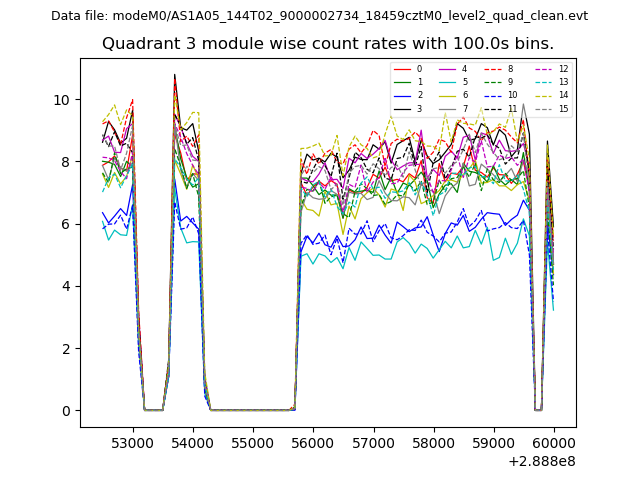
| Module-wise count rates for Quadrant C Data is divided into 100 sec bins |
 |
 |
| Module-wise count rates for Quadrant D Data is divided into 100 sec bins |
 |
 |
| Parameter | Plot |
|---|---|
| CZT HV Monitor | 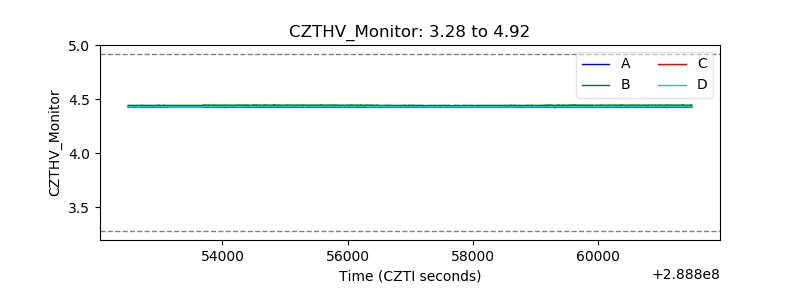 |
| D_VDD | 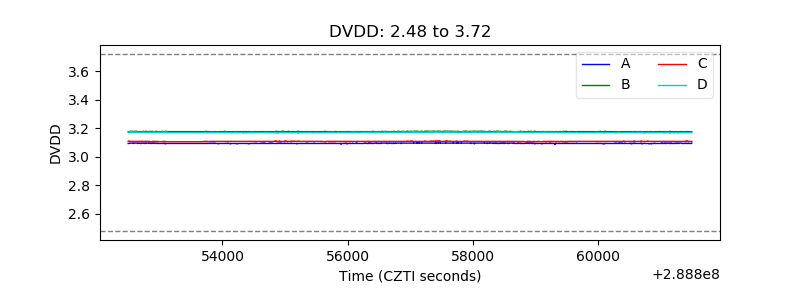 |
| Temperature 1 | 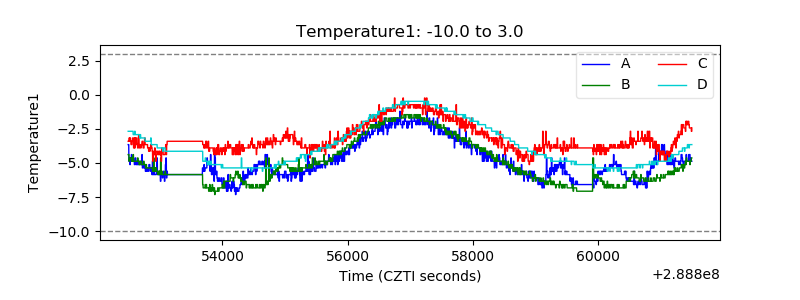 |
| Veto HV Monitor | 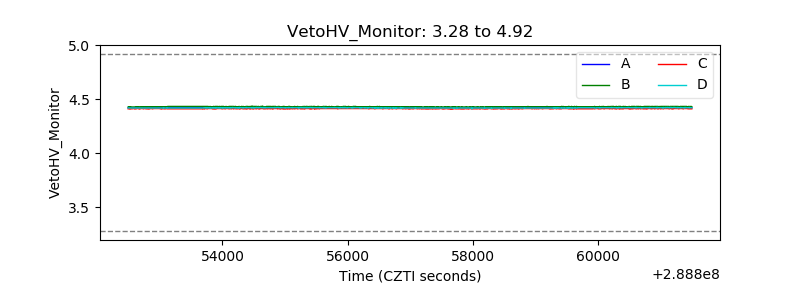 |
| Veto LLD | 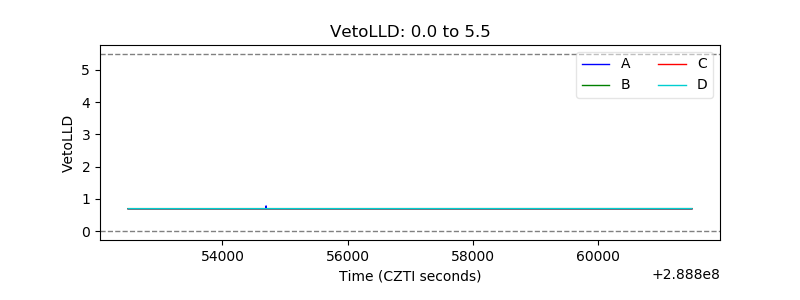 |
| Alpha Counter | 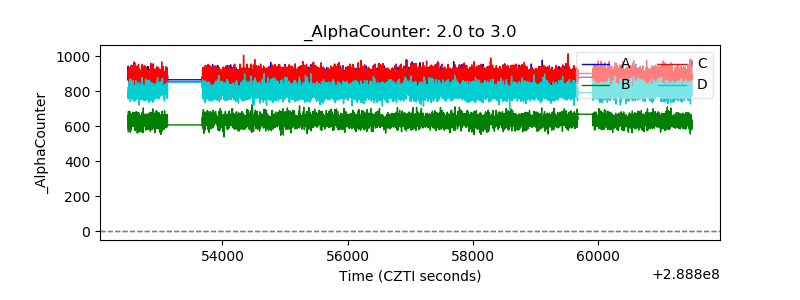 |
| _CPM_Rate | 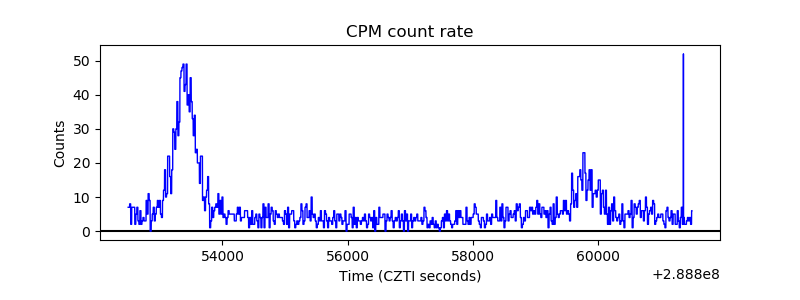 |
| CZT Counter | 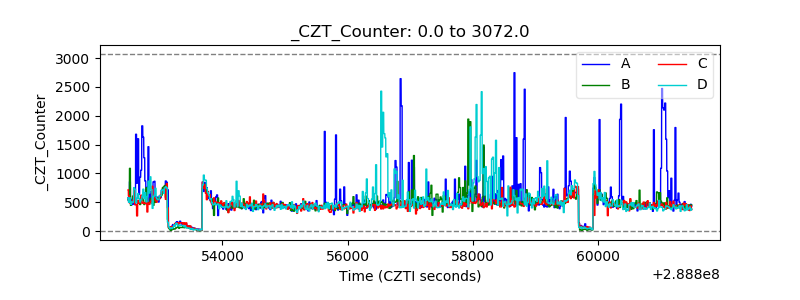 |
| +2.5 Volts monitor |  |
| +5 Volts monitor | 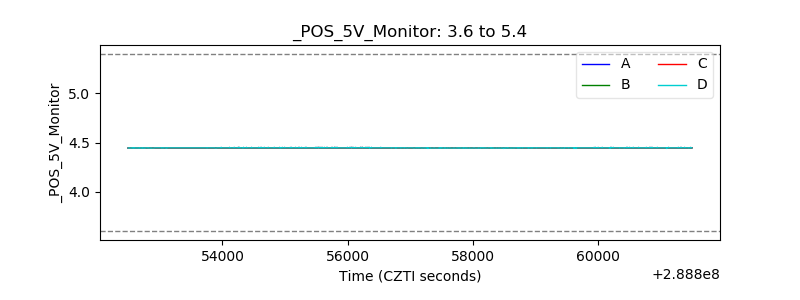 |
| _ROLL_ROT | 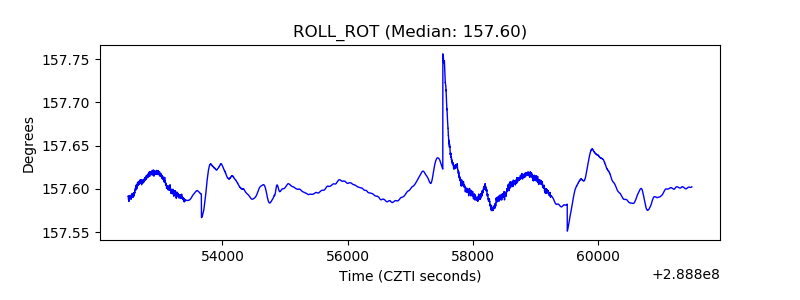 |
| _Roll_DEC | 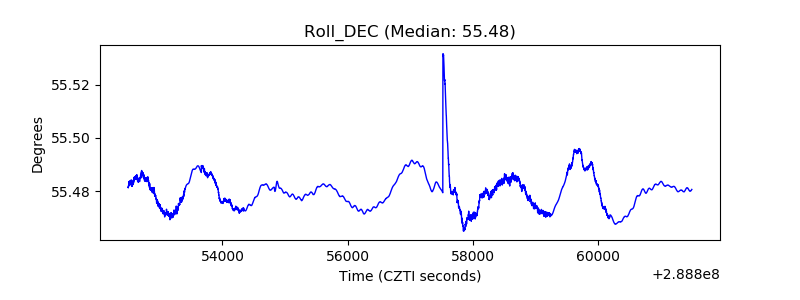 |
| _Roll_RA | 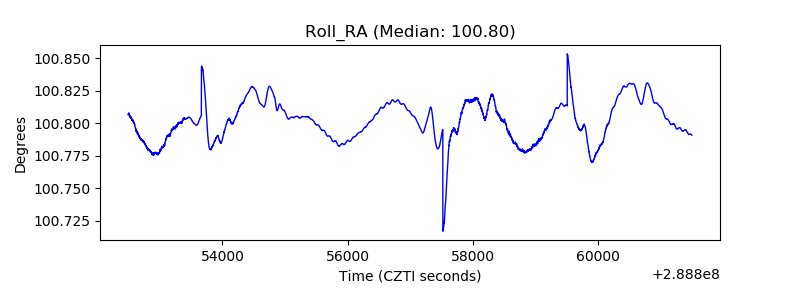 |
| Veto Counter | 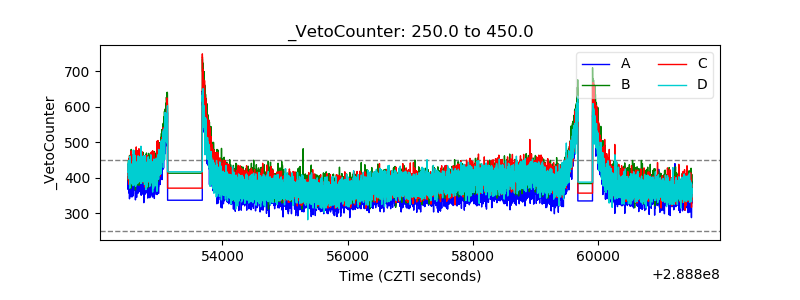 |