| Param | Original file | Final file |
|---|---|---|
| Filename | modeM0/AS1A05_144T02_9000002734_18463cztM0_level2.evt | modeM0/AS1A05_144T02_9000002734_18463cztM0_level2_quad_clean.evt |
| Size (bytes) | 1,538,660,160 | 264,473,280 |
| Size | 1.4 GB | 252.2 MB |
| Events in quadrant A | 13,473,075 | 1,662,145 |
| Events in quadrant B | 11,858,212 | 1,759,165 |
| Events in quadrant C | 8,712,431 | 1,688,828 |
| Events in quadrant D | 11,299,175 | 1,618,215 |
| Mode M0 | |||
|---|---|---|---|
| Quadrant | BADHDUFLAG | Total packets | Discarded packets |
| A | 0 | 52399 | 4 |
| B | 0 | 47636 | 4 |
| C | 0 | 38100 | 4 |
| D | 0 | 46293 | 8 |
| Mode SS | |||
|---|---|---|---|
| Quadrant | BADHDUFLAG | Total packets | Discarded packets |
| A | 0 | 376 | 0 |
| B | 0 | 376 | 0 |
| C | 0 | 376 | 0 |
| D | 0 | 376 | 0 |
| Mode M9 | |||
|---|---|---|---|
| Quadrant | BADHDUFLAG | Total packets | Discarded packets |
| A | 0 | 23 | 0 |
| B | 0 | 23 | 0 |
| C | 0 | 23 | 0 |
| D | 0 | 23 | 0 |
| Quadrant | Total seconds | Saturated seconds | Saturation percentage |
|---|---|---|---|
| A | 18608 | 2064 | 11.092003% |
| B | 18609 | 1331 | 7.152453% |
| C | 18609 | 301 | 1.617497% |
| D | 18608 | 606 | 3.256664% |
Noise dominated data is calculated using 1-second bins in cleaned event files. If a bin has >2000 counts, and if more than 50% of those come from <1% of pixels, then it is considered to be noise-dominated and hence unusable.
| Quadrant | # 1 sec bins | Bins with >0 counts | Bins with >2000 counts | High rate bins dominated by noise | Noise dominated (total time) | Noise dominated (detector-on time) | Marked lightcurve |
|---|---|---|---|---|---|---|---|
| A | 20728 | 18608 | 1268 | 1268 | 6.12% | 6.81% | 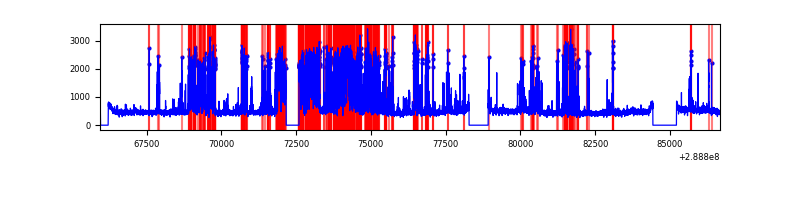 |
| B | 20729 | 18609 | 837 | 837 | 4.04% | 4.50% | 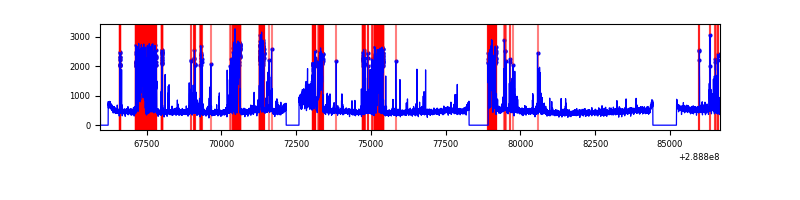 |
| C | 20729 | 18609 | 1 | 1 | 0.00% | 0.01% | 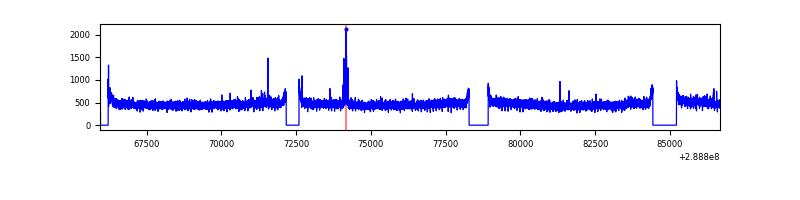 |
| D | 20727 | 18608 | 402 | 402 | 1.94% | 2.16% | 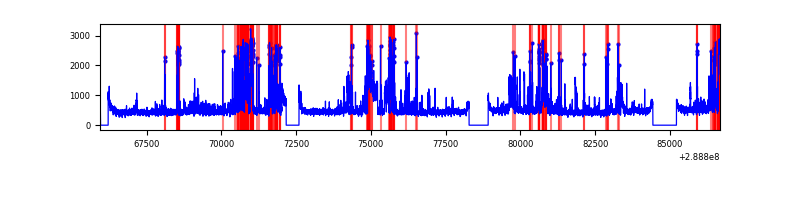 |
Top three noisy pixels from each quadrant. If the there are fewer than three noisy pixels in the level2.evt file, extra rows are filled as -1
| Pixel properties | Quadrant properties | ||||||
|---|---|---|---|---|---|---|---|
| Quadrant | DetID | PixID | Counts | Sigma | Mean | Median | Sigma |
| A | 0 | 13 | 5159800 | 12353.36 | 2080 | 2029 | 417.5 |
| A | 15 | 174 | 126452 | 298.01 | 2080 | 2029 | 417.5 |
| A | 14 | 238 | 116233 | 273.53 | 2080 | 2029 | 417.5 |
| B | 15 | 222 | 2652792 | 6519.44 | 2151 | 2094 | 406.6 |
| B | 7 | 220 | 685521 | 1680.9 | 2151 | 2094 | 406.6 |
| B | 12 | 111 | 49358 | 116.25 | 2151 | 2094 | 406.6 |
| C | 14 | 238 | 326285 | 660.61 | 2105 | 2115 | 490.7 |
| C | 3 | 233 | 183135 | 368.89 | 2105 | 2115 | 490.7 |
| C | 13 | 61 | 15079 | 26.42 | 2105 | 2115 | 490.7 |
| D | 7 | 238 | 1916888 | 3735.26 | 2108 | 2043 | 512.6 |
| D | 8 | 230 | 645543 | 1255.27 | 2108 | 2043 | 512.6 |
| D | 13 | 168 | 282789 | 547.65 | 2108 | 2043 | 512.6 |
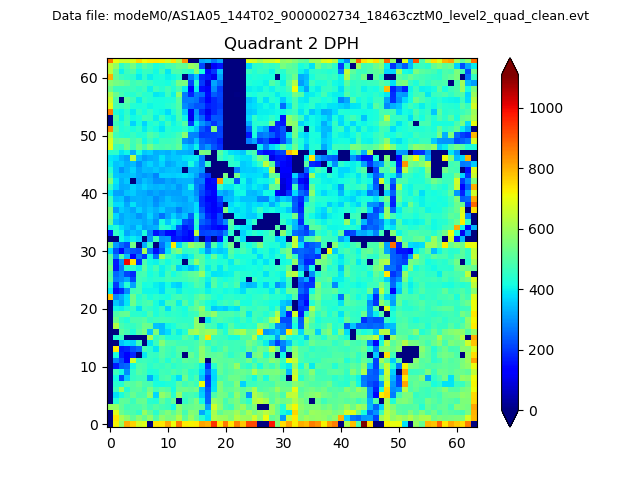
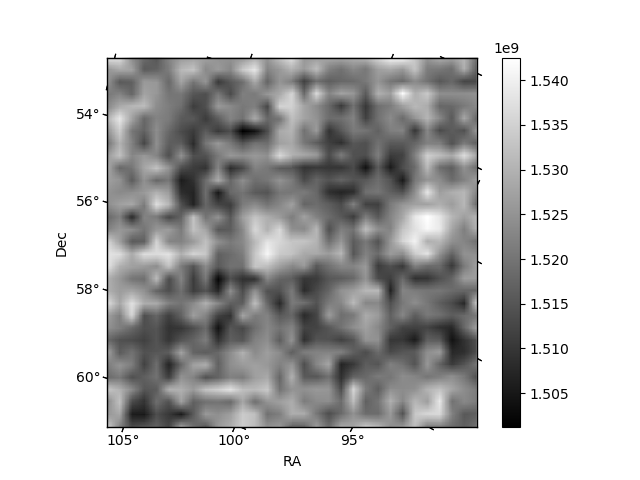
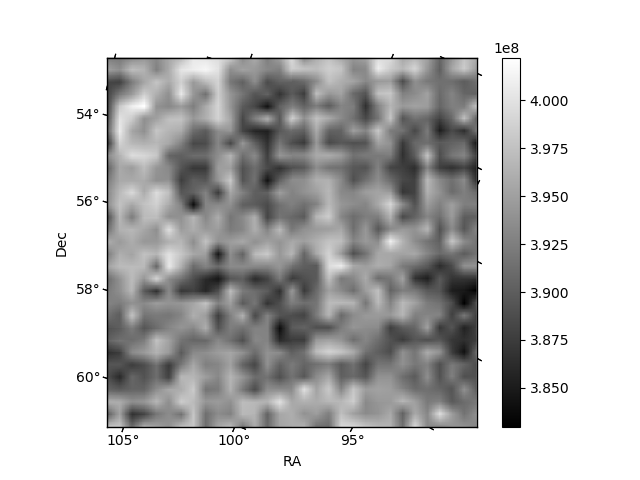
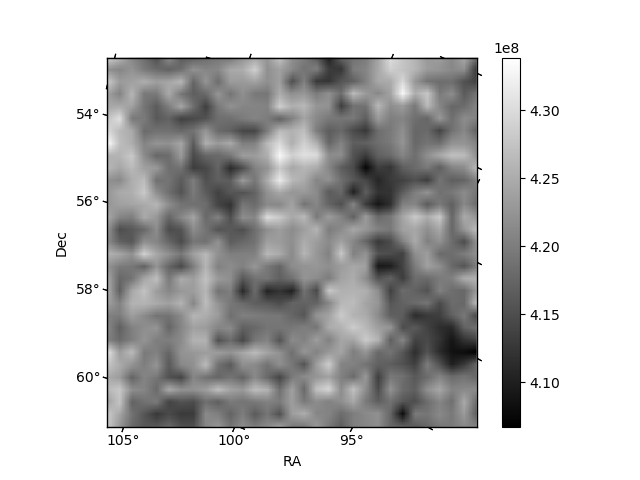
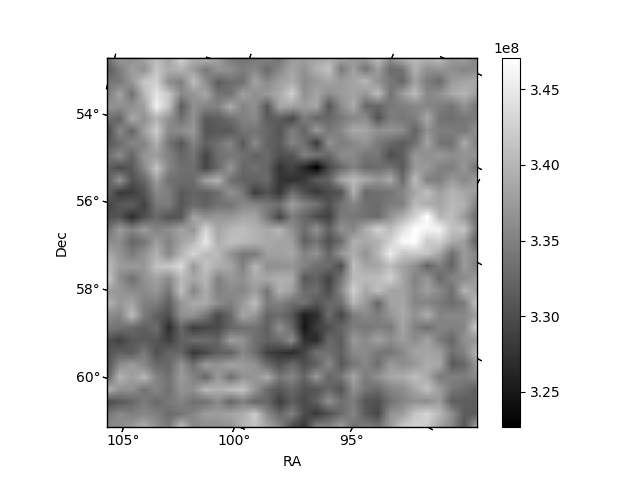
Histogram calculated using DETX and DETY for each event in the final _common_clean file
| Quadrant A | 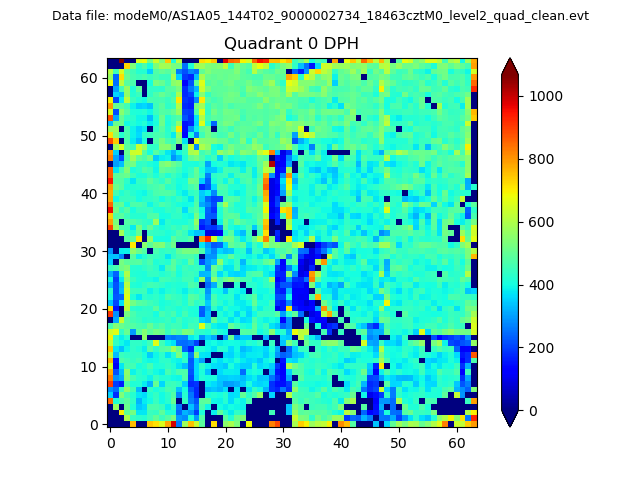 |
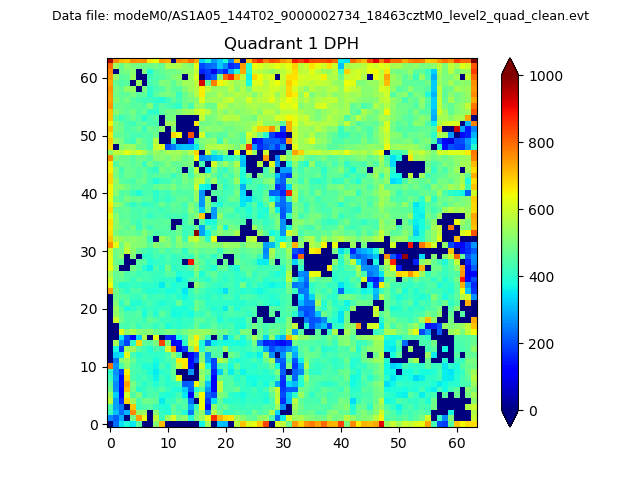 |
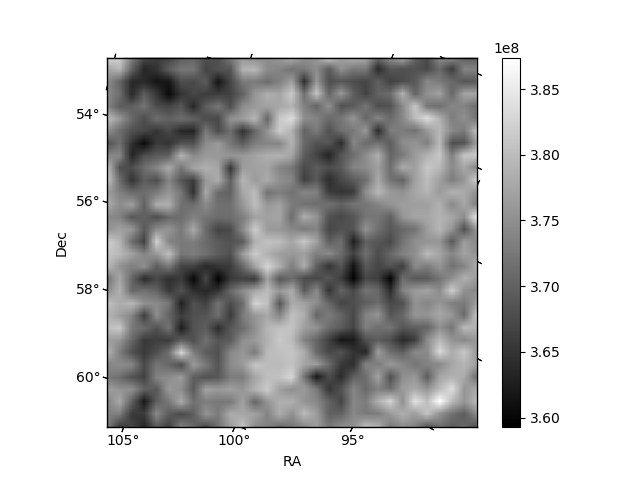
Quadrant B |
|---|---|---|---|
| Quadrant D | 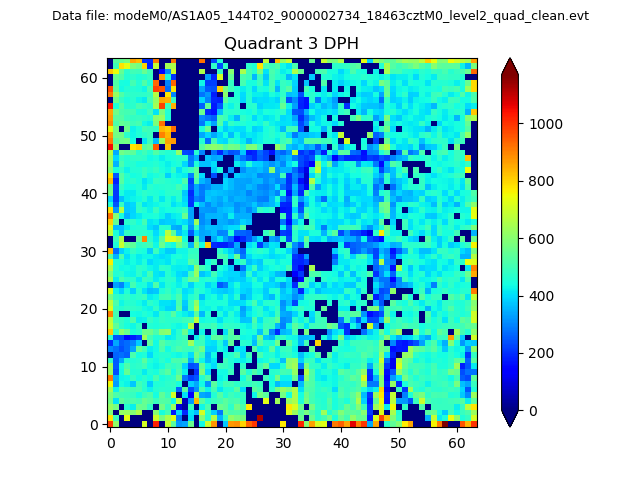 |
 |
Quadrant C |
| Plot type | Count rate plots | Images |
|---|---|---|
| Comparison with Poisson distribution Blue bars denote a histogram of data divided into 1 sec bins. Red curve is a Poisson curve with rate = median count rate of data. |
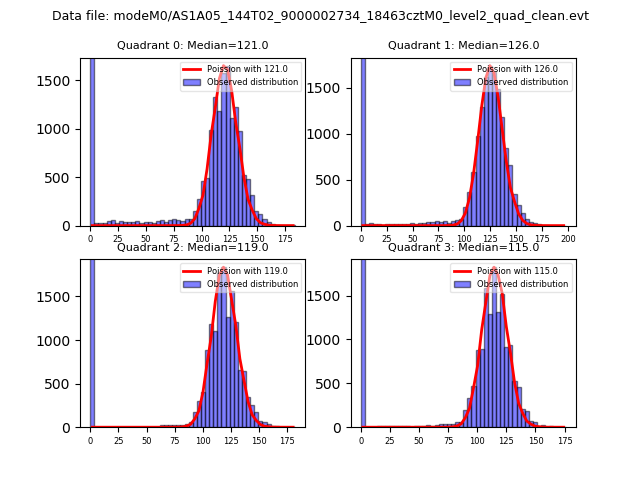 |
 |
| Quadrant-wise count rates Data is divided into 100 sec bins |
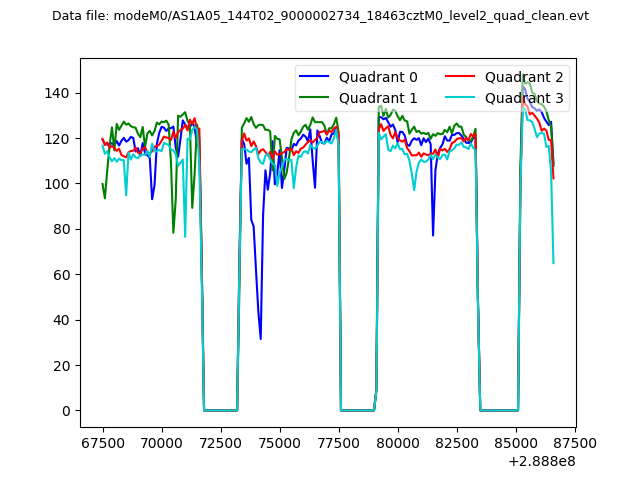 |
|
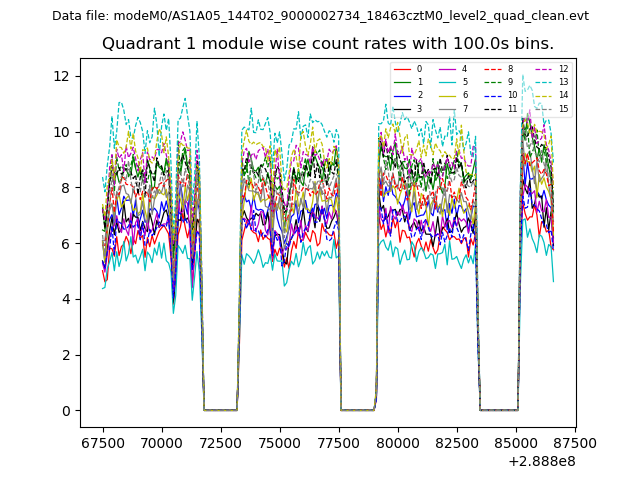
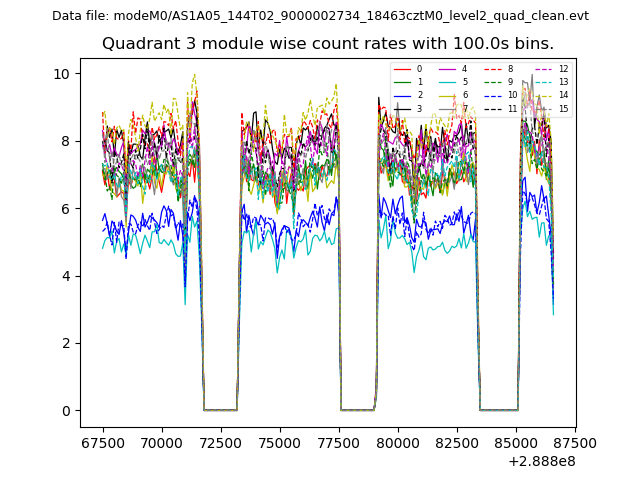
| Module-wise count rates for Quadrant A Data is divided into 100 sec bins |
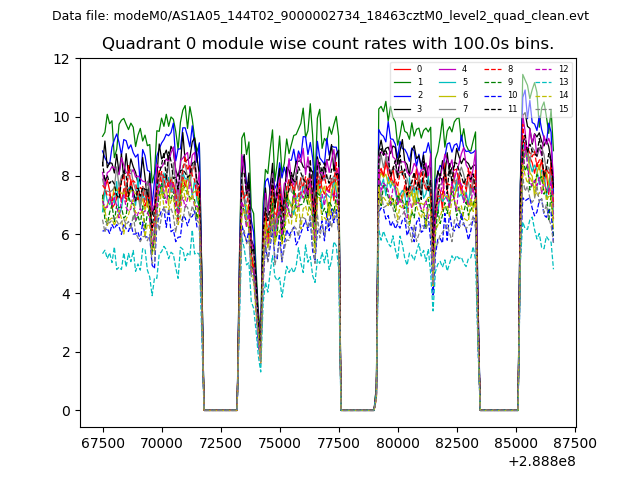 |
 |
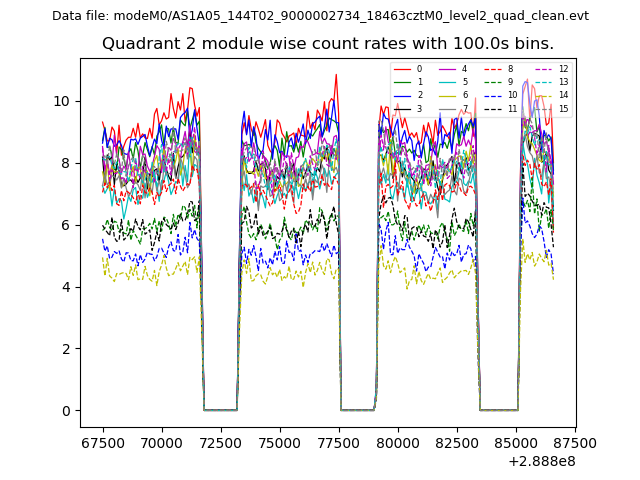
| Module-wise count rates for Quadrant B Data is divided into 100 sec bins |
 |
 |
| Module-wise count rates for Quadrant C Data is divided into 100 sec bins |
 |
 |
| Module-wise count rates for Quadrant D Data is divided into 100 sec bins |
 |
 |
| Parameter | Plot |
|---|---|
| CZT HV Monitor | 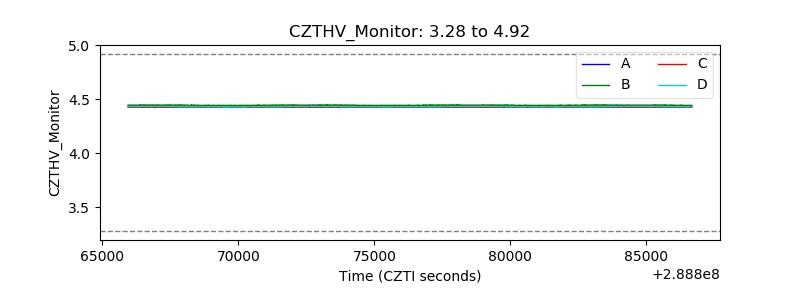 |
| D_VDD | 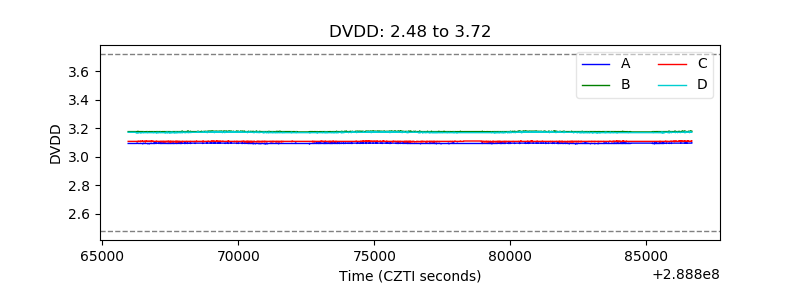 |
| Temperature 1 | 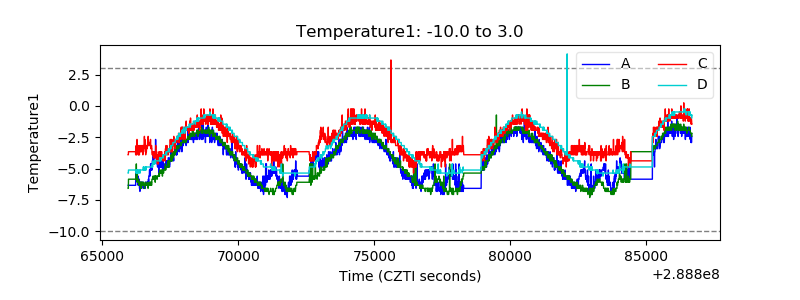 |
| Veto HV Monitor | 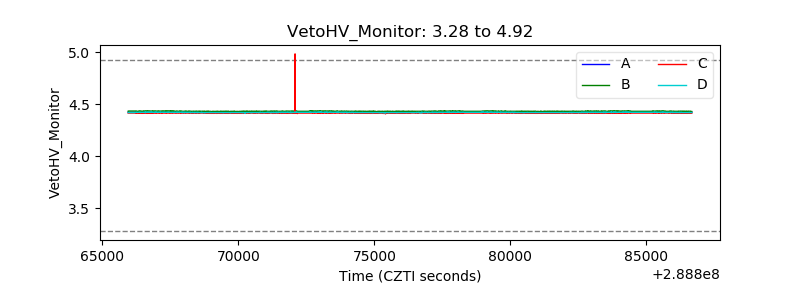 |
| Veto LLD | 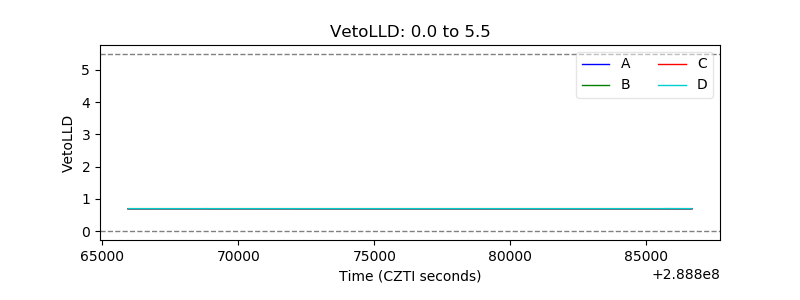 |
| Alpha Counter | 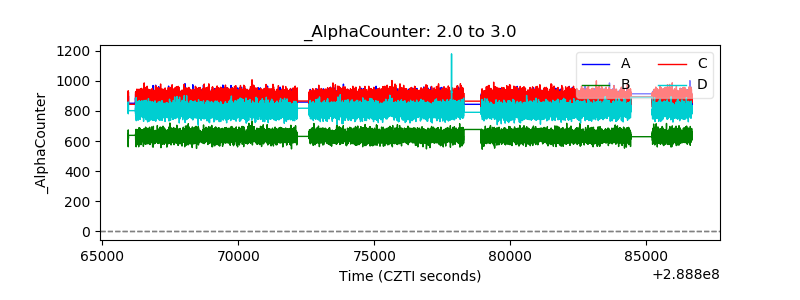 |
| _CPM_Rate | 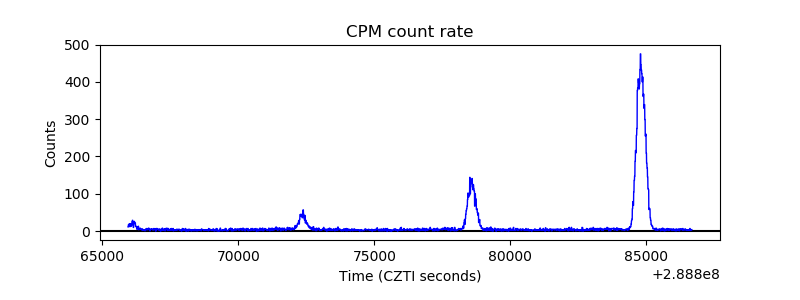 |
| CZT Counter | 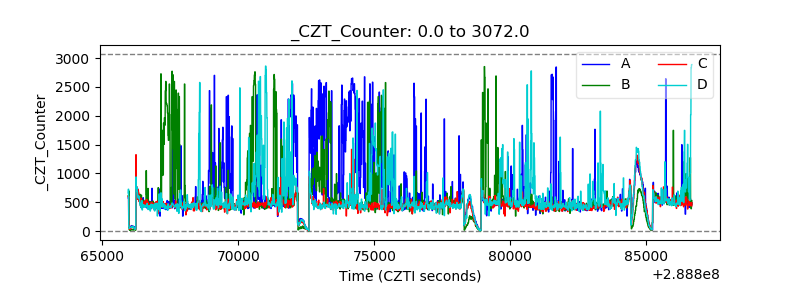 |
| +2.5 Volts monitor |  |
| +5 Volts monitor |  |
| _ROLL_ROT | 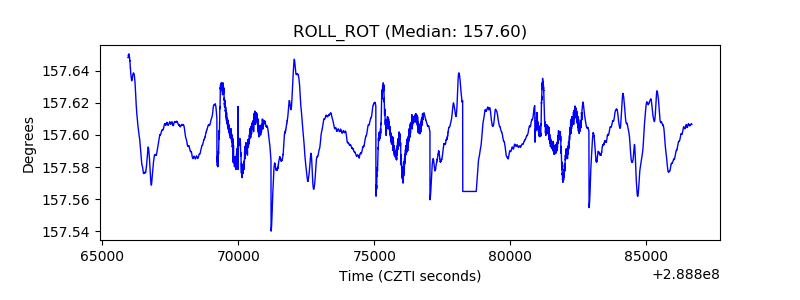 |
| _Roll_DEC | 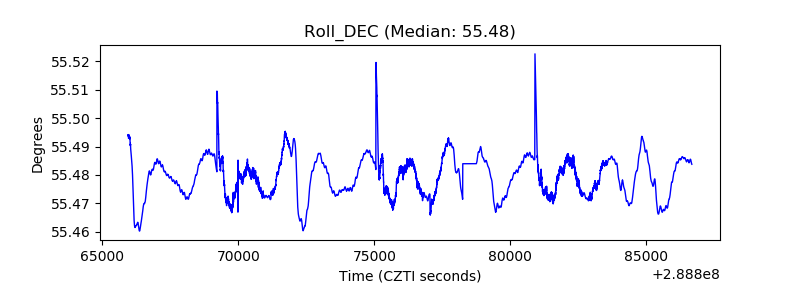 |
| _Roll_RA | 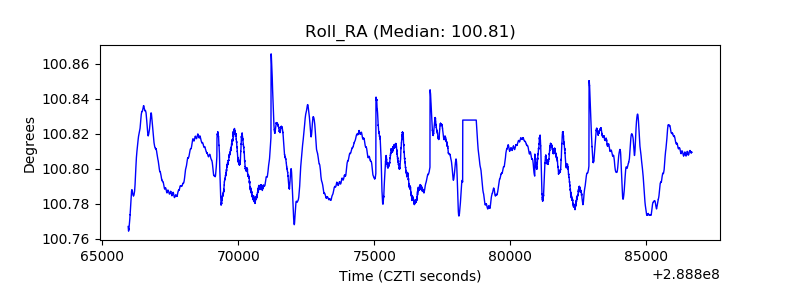 |
| Veto Counter | 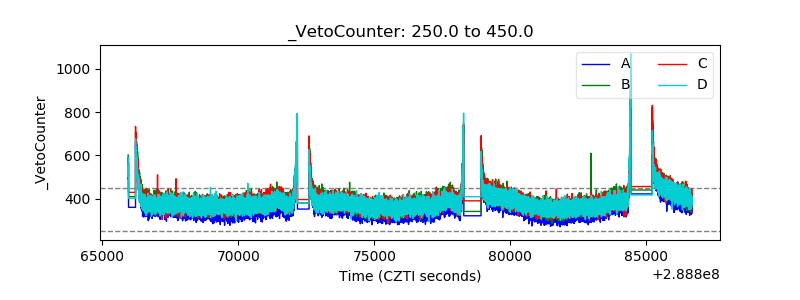 |