| Param | Original file | Final file |
|---|---|---|
| Filename | modeM0/AS1A05_144T02_9000002734_18464cztM0_level2.evt | modeM0/AS1A05_144T02_9000002734_18464cztM0_level2_quad_clean.evt |
| Size (bytes) | 141,880,320 | 30,775,680 |
| Size | 135.3 MB | 29.3 MB |
| Events in quadrant A | 1,133,165 | 207,077 |
| Events in quadrant B | 894,669 | 215,317 |
| Events in quadrant C | 844,247 | 198,703 |
| Events in quadrant D | 1,307,456 | 186,364 |
| Mode M0 | |||
|---|---|---|---|
| Quadrant | BADHDUFLAG | Total packets | Discarded packets |
| A | 0 | 4452 | 0 |
| B | 0 | 3786 | 0 |
| C | 0 | 3592 | 0 |
| D | 0 | 4983 | 0 |
| Mode SS | |||
|---|---|---|---|
| Quadrant | BADHDUFLAG | Total packets | Discarded packets |
| A | 0 | 34 | 0 |
| B | 0 | 34 | 0 |
| C | 0 | 34 | 0 |
| D | 0 | 34 | 0 |
| Quadrant | Total seconds | Saturated seconds | Saturation percentage |
|---|---|---|---|
| A | 1688 | 100 | 5.924171% |
| B | 1689 | 23 | 1.361753% |
| C | 1689 | 28 | 1.657786% |
| D | 1689 | 139 | 8.229722% |
Noise dominated data is calculated using 1-second bins in cleaned event files. If a bin has >2000 counts, and if more than 50% of those come from <1% of pixels, then it is considered to be noise-dominated and hence unusable.
| Quadrant | # 1 sec bins | Bins with >0 counts | Bins with >2000 counts | High rate bins dominated by noise | Noise dominated (total time) | Noise dominated (detector-on time) | Marked lightcurve |
|---|---|---|---|---|---|---|---|
| A | 1688 | 1688 | 88 | 88 | 5.21% | 5.21% | 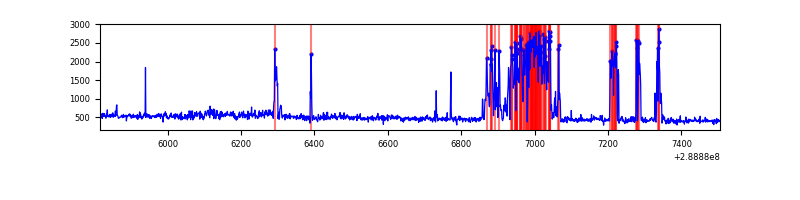 |
| B | 1689 | 1689 | 12 | 12 | 0.71% | 0.71% | 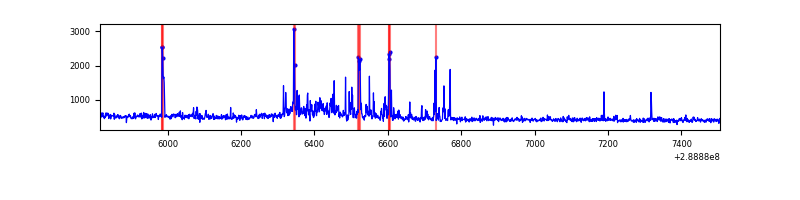 |
| C | 1689 | 1689 | 18 | 18 | 1.07% | 1.07% | 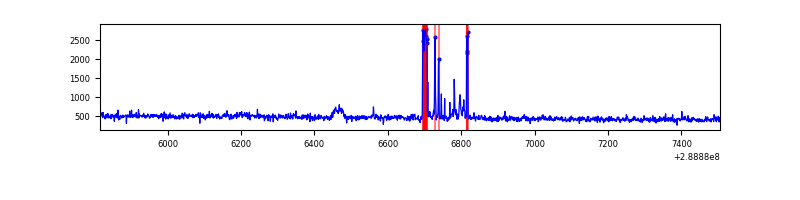 |
| D | 1689 | 1689 | 135 | 135 | 7.99% | 7.99% | 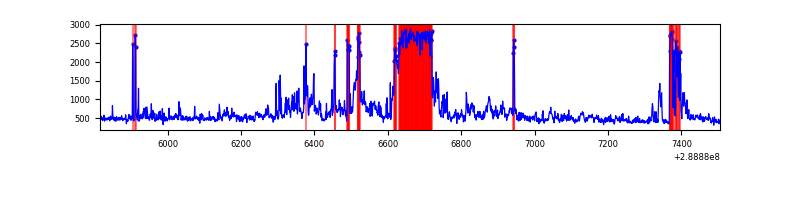 |
Top three noisy pixels from each quadrant. If the there are fewer than three noisy pixels in the level2.evt file, extra rows are filled as -1
| Pixel properties | Quadrant properties | ||||||
|---|---|---|---|---|---|---|---|
| Quadrant | DetID | PixID | Counts | Sigma | Mean | Median | Sigma |
| A | 0 | 13 | 310316 | 7519.47 | 195 | 191 | 41.2 |
| A | 4 | 2 | 50290 | 1214.73 | 195 | 191 | 41.2 |
| A | 15 | 174 | 20073 | 482.07 | 195 | 191 | 41.2 |
| B | 7 | 220 | 99505 | 2605.58 | 195 | 191 | 38.1 |
| B | 10 | 245 | 18134 | 470.75 | 195 | 191 | 38.1 |
| B | 6 | 36 | 13432 | 347.39 | 195 | 191 | 38.1 |
| C | 0 | 207 | 61517 | 1362.47 | 186 | 186 | 45.0 |
| C | 14 | 238 | 28996 | 640.02 | 186 | 186 | 45.0 |
| C | 3 | 233 | 25458 | 561.42 | 186 | 186 | 45.0 |
| D | 7 | 238 | 368936 | 7889.73 | 184 | 178 | 46.7 |
| D | 7 | 38 | 90545 | 1933.44 | 184 | 178 | 46.7 |
| D | 13 | 168 | 77947 | 1663.9 | 184 | 178 | 46.7 |
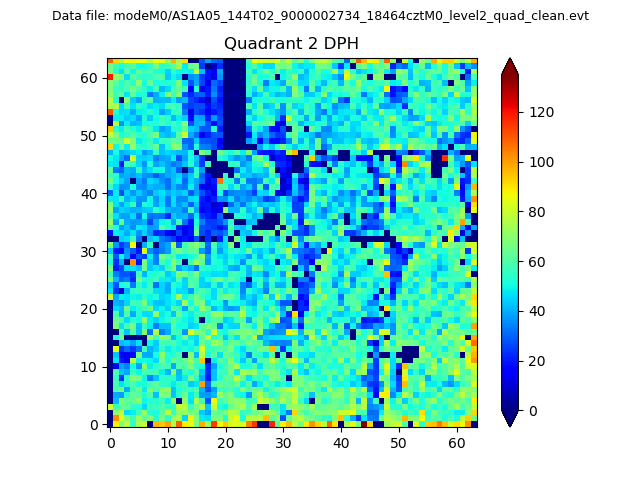
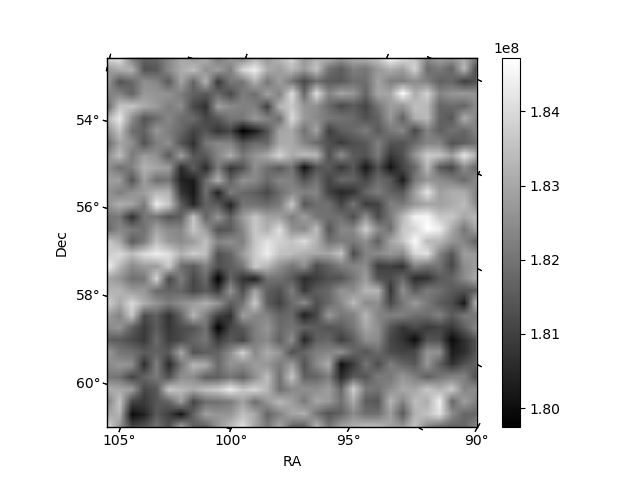
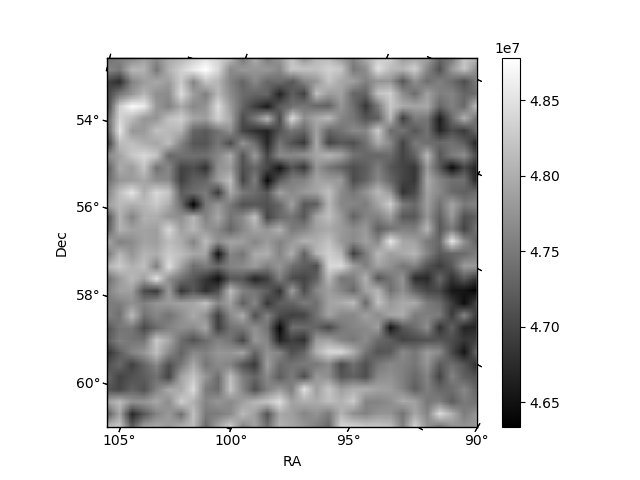
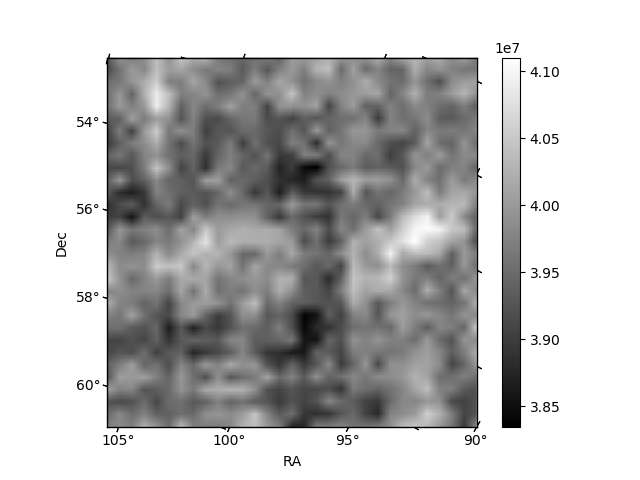
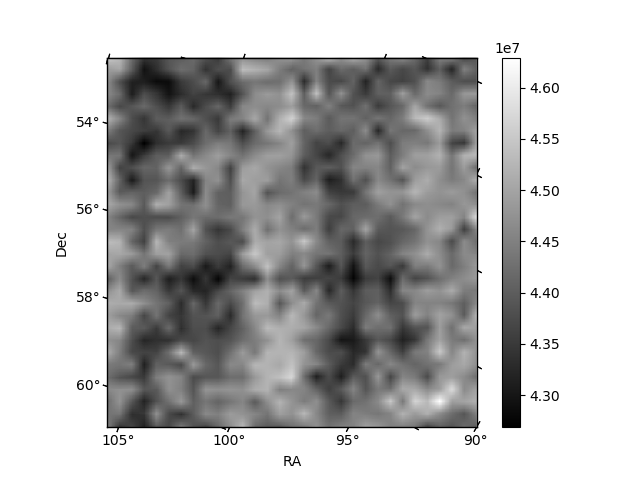
Histogram calculated using DETX and DETY for each event in the final _common_clean file
| Quadrant A | 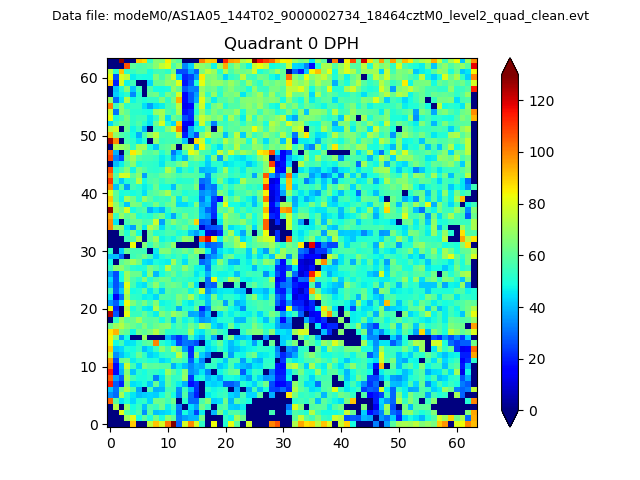 |
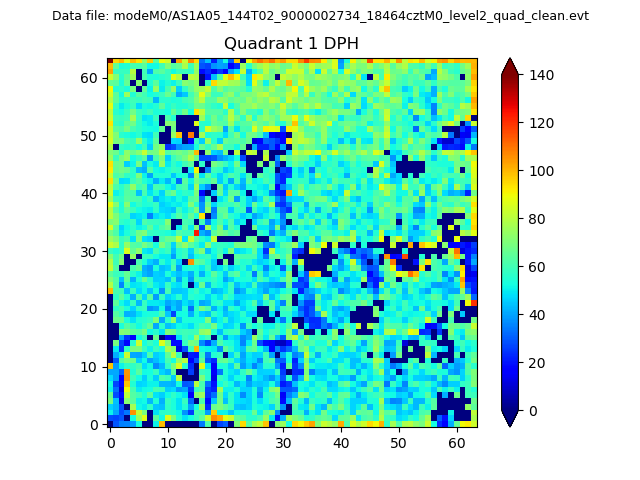 |
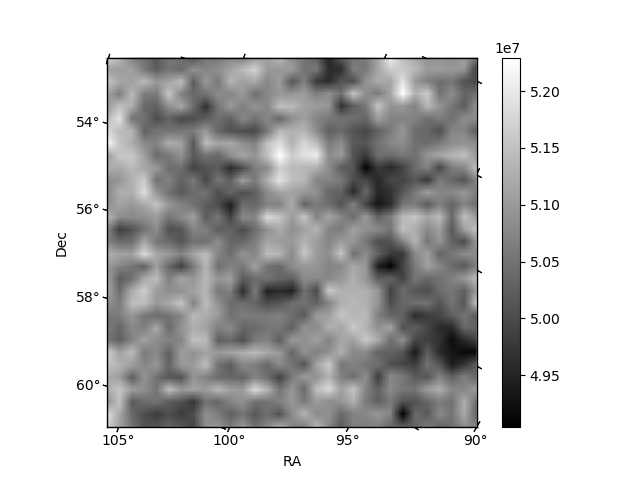
Quadrant B |
|---|---|---|---|
| Quadrant D | 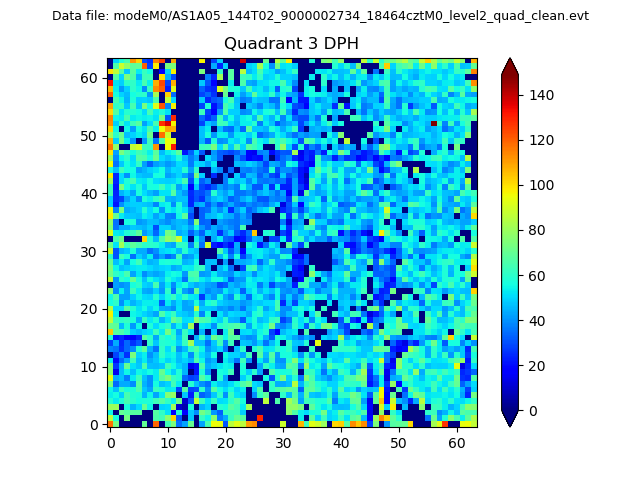 |
 |
Quadrant C |
| Plot type | Count rate plots | Images |
|---|---|---|
| Comparison with Poisson distribution Blue bars denote a histogram of data divided into 1 sec bins. Red curve is a Poisson curve with rate = median count rate of data. |
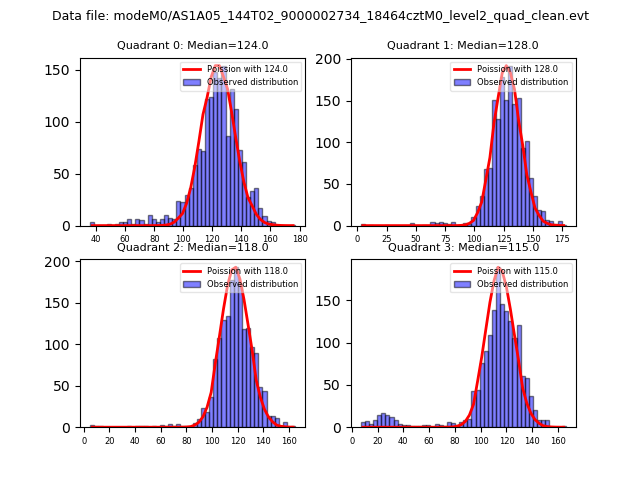 |
 |
| Quadrant-wise count rates Data is divided into 100 sec bins |
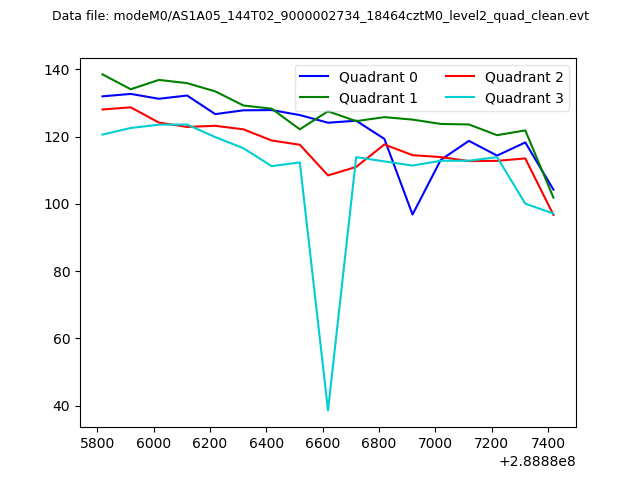 |
|
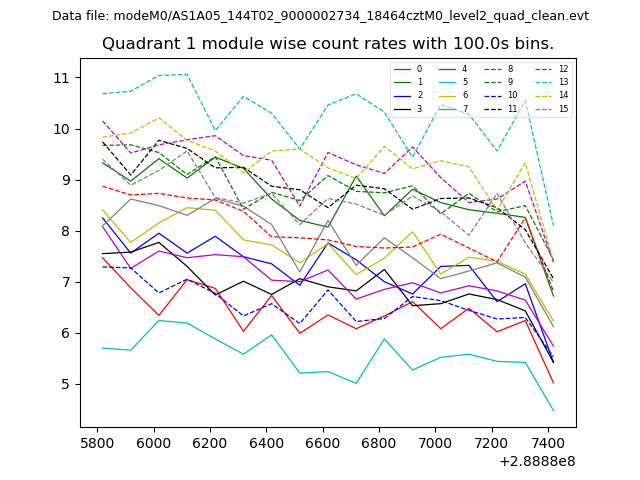
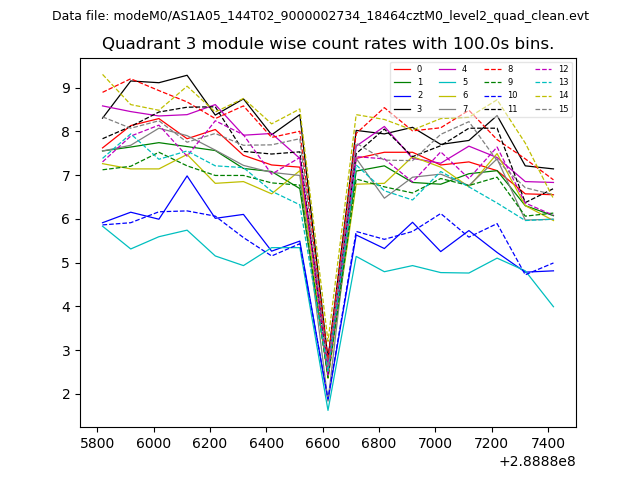
| Module-wise count rates for Quadrant A Data is divided into 100 sec bins |
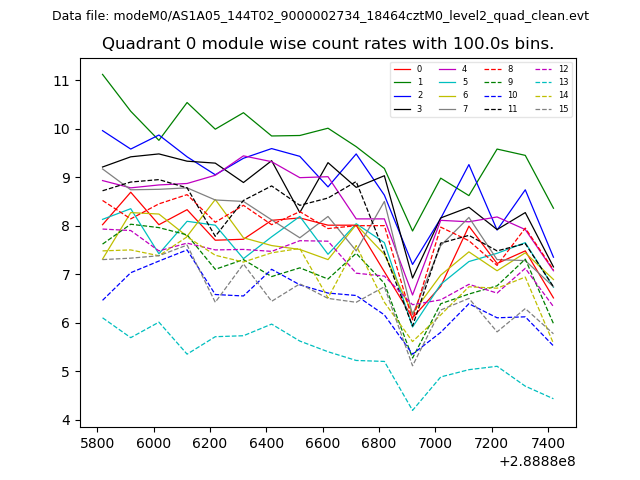 |
 |
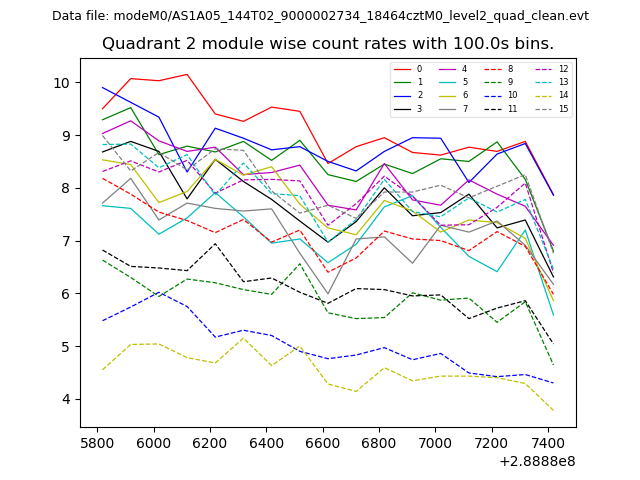
| Module-wise count rates for Quadrant B Data is divided into 100 sec bins |
 |
 |
| Module-wise count rates for Quadrant C Data is divided into 100 sec bins |
 |
 |
| Module-wise count rates for Quadrant D Data is divided into 100 sec bins |
 |
 |
| Parameter | Plot |
|---|---|
| CZT HV Monitor | 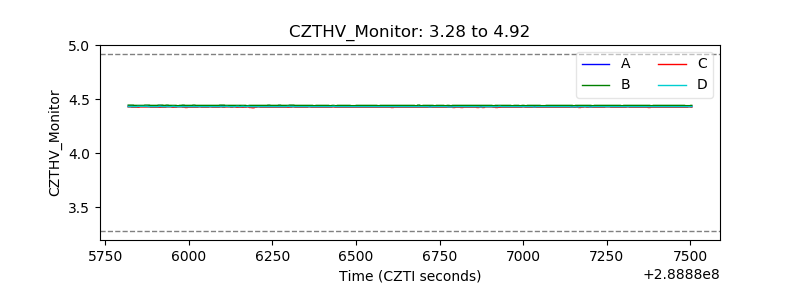 |
| D_VDD | 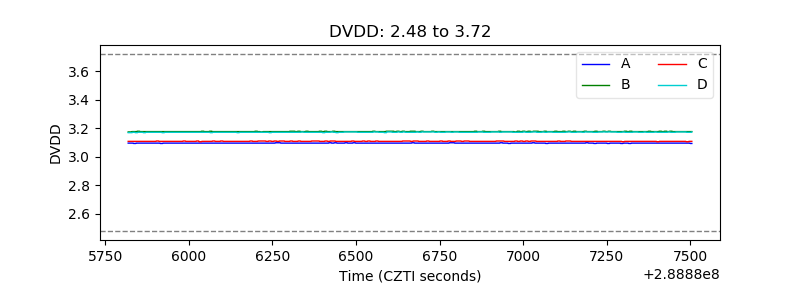 |
| Temperature 1 | 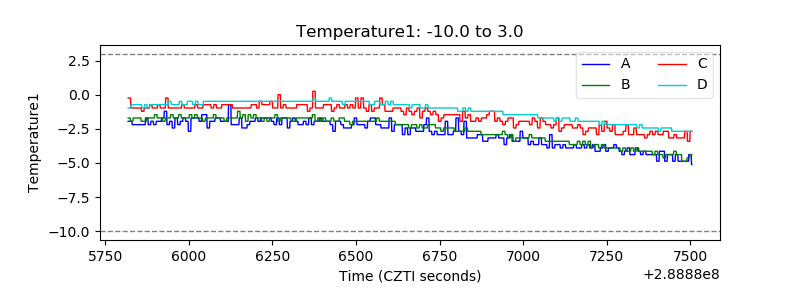 |
| Veto HV Monitor | 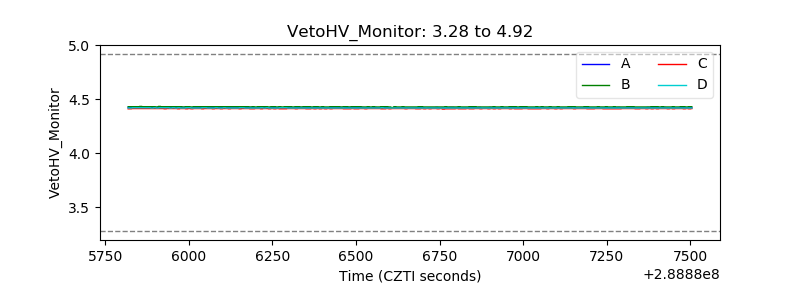 |
| Veto LLD | 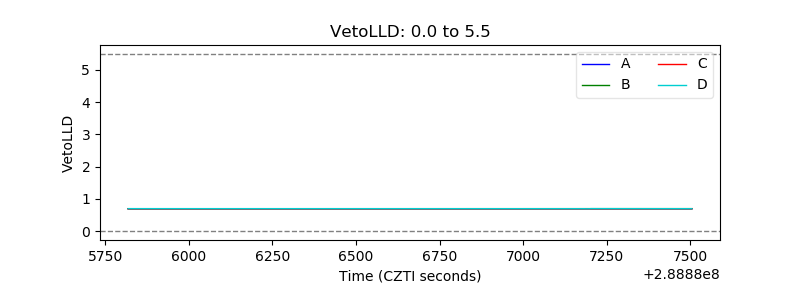 |
| Alpha Counter |  |
| _CPM_Rate | 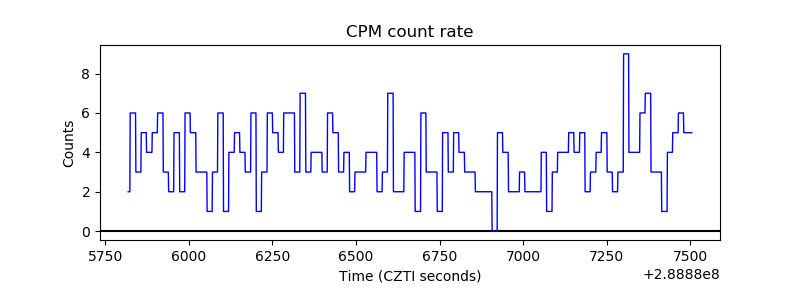 |
| CZT Counter | 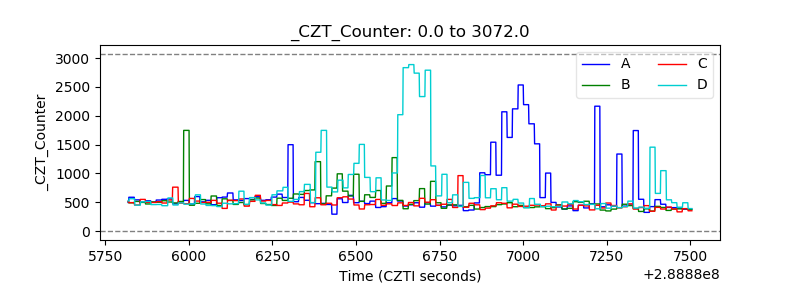 |
| +2.5 Volts monitor |  |
| +5 Volts monitor |  |
| _ROLL_ROT | 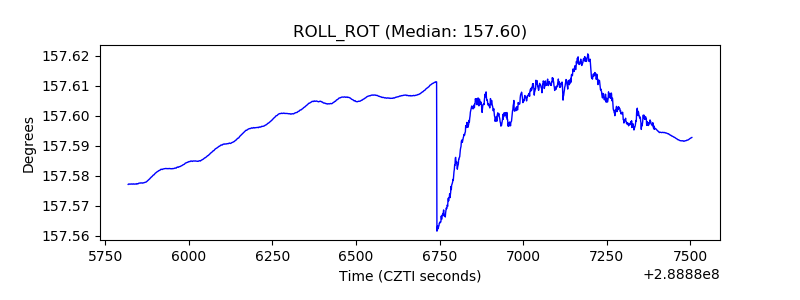 |
| _Roll_DEC | 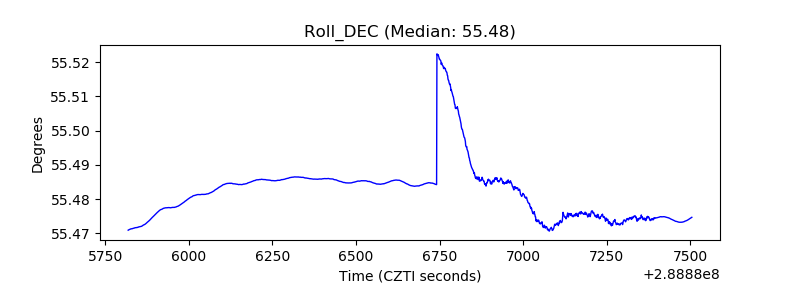 |
| _Roll_RA | 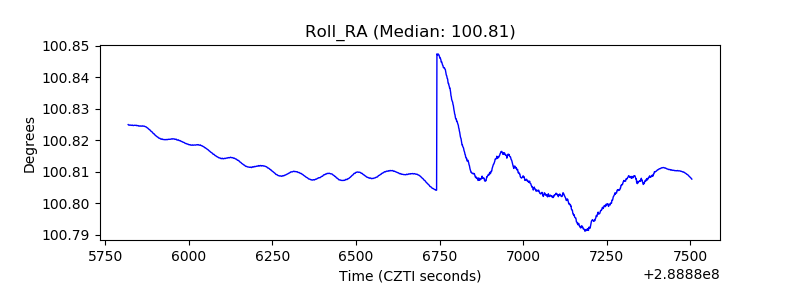 |
| Veto Counter | 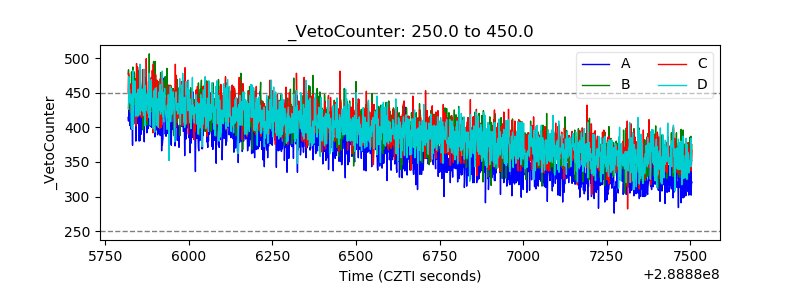 |