| Param | Original file | Final file |
|---|---|---|
| Filename | modeM0/AS1A05_075T09_9000002740_18481cztM0_level2.evt | modeM0/AS1A05_075T09_9000002740_18481cztM0_level2_quad_clean.evt |
| Size (bytes) | 288,812,160 | 57,098,880 |
| Size | 275.4 MB | 54.5 MB |
| Events in quadrant A | 1,990,174 | 364,795 |
| Events in quadrant B | 2,422,752 | 371,346 |
| Events in quadrant C | 2,036,686 | 362,687 |
| Events in quadrant D | 2,032,241 | 356,203 |
| Mode M9 | |||
|---|---|---|---|
| Quadrant | BADHDUFLAG | Total packets | Discarded packets |
| A | 0 | 12 | 0 |
| B | 0 | 12 | 0 |
| C | 0 | 12 | 0 |
| D | 0 | 12 | 0 |
| Mode SS | |||
|---|---|---|---|
| Quadrant | BADHDUFLAG | Total packets | Discarded packets |
| A | 0 | 80 | 0 |
| B | 0 | 80 | 0 |
| C | 0 | 80 | 0 |
| D | 0 | 80 | 0 |
| Mode M0 | |||
|---|---|---|---|
| Quadrant | BADHDUFLAG | Total packets | Discarded packets |
| A | 0 | 8535 | 1 |
| B | 0 | 9856 | 1 |
| C | 0 | 8611 | 1 |
| D | 0 | 8769 | 1 |
| Quadrant | Total seconds | Saturated seconds | Saturation percentage |
|---|---|---|---|
| A | 3875 | 55 | 1.419355% |
| B | 3875 | 138 | 3.561290% |
| C | 3875 | 76 | 1.961290% |
| D | 3875 | 48 | 1.238710% |
Noise dominated data is calculated using 1-second bins in cleaned event files. If a bin has >2000 counts, and if more than 50% of those come from <1% of pixels, then it is considered to be noise-dominated and hence unusable.
| Quadrant | # 1 sec bins | Bins with >0 counts | Bins with >2000 counts | High rate bins dominated by noise | Noise dominated (total time) | Noise dominated (detector-on time) | Marked lightcurve |
|---|---|---|---|---|---|---|---|
| A | 5060 | 3875 | 2 | 2 | 0.04% | 0.05% |  |
| B | 5060 | 3875 | 53 | 53 | 1.05% | 1.37% |  |
| C | 5060 | 3875 | 0 | 0 | 0.00% | 0.00% |  |
| D | 5060 | 3875 | 9 | 9 | 0.18% | 0.23% |  |
Top three noisy pixels from each quadrant. If the there are fewer than three noisy pixels in the level2.evt file, extra rows are filled as -1
| Pixel properties | Quadrant properties | ||||||
|---|---|---|---|---|---|---|---|
| Quadrant | DetID | PixID | Counts | Sigma | Mean | Median | Sigma |
| A | 4 | 2 | 41602 | 400.67 | 501 | 492 | 102.6 |
| A | 0 | 13 | 15499 | 146.26 | 501 | 492 | 102.6 |
| A | 0 | 226 | 4352 | 37.62 | 501 | 492 | 102.6 |
| B | 10 | 245 | 446745 | 4618.0 | 501 | 489 | 96.6 |
| B | 0 | 229 | 12238 | 121.58 | 501 | 489 | 96.6 |
| B | 12 | 111 | 10965 | 108.41 | 501 | 489 | 96.6 |
| C | 14 | 238 | 76398 | 668.66 | 488 | 493 | 113.5 |
| C | 3 | 233 | 31689 | 274.81 | 488 | 493 | 113.5 |
| C | 9 | 54 | 25688 | 221.95 | 488 | 493 | 113.5 |
| D | 1 | 52 | 84323 | 698.11 | 494 | 481 | 120.1 |
| D | 7 | 238 | 28812 | 235.9 | 494 | 481 | 120.1 |
| D | 2 | 234 | 19392 | 157.46 | 494 | 481 | 120.1 |
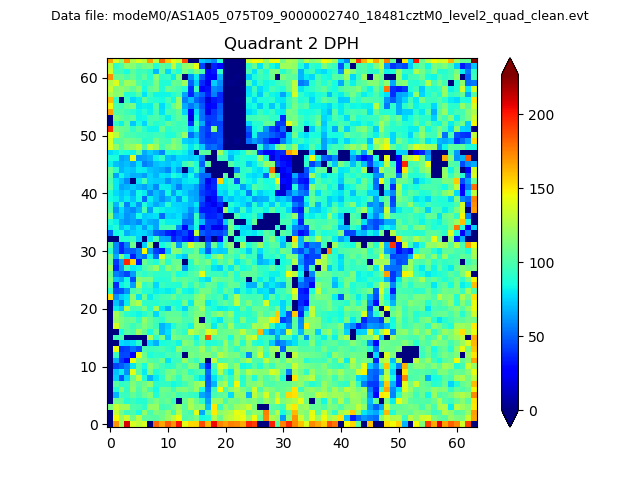
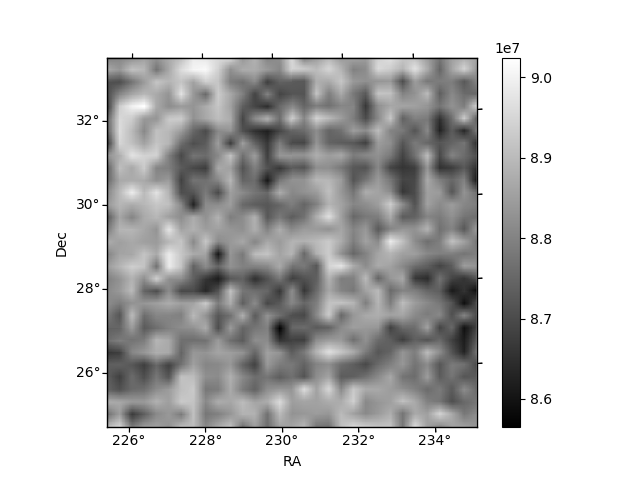
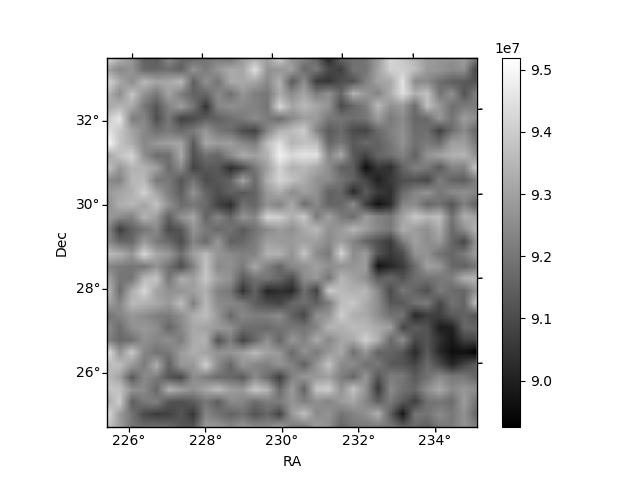
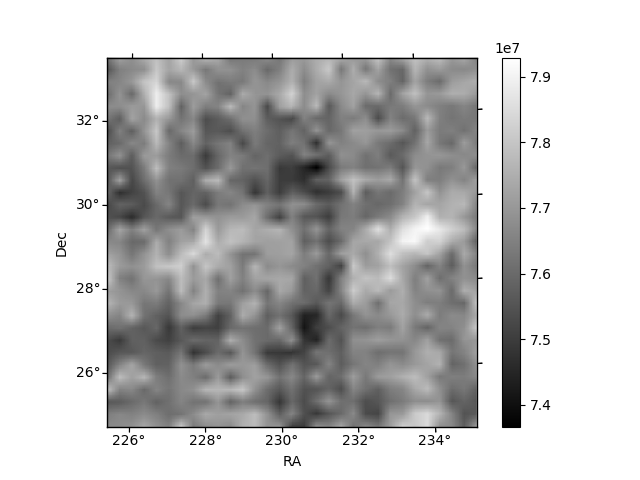
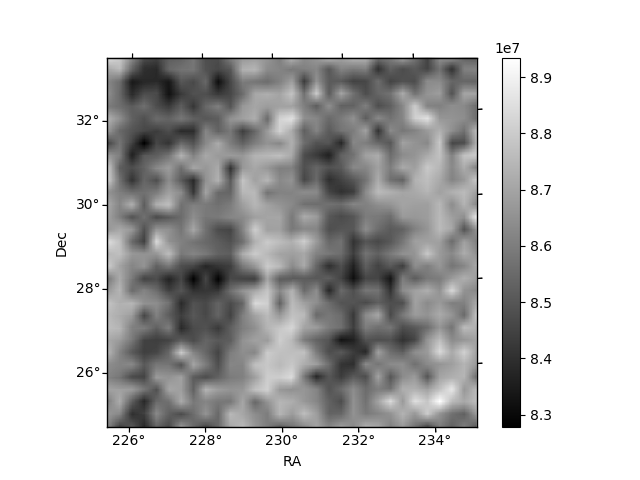
Histogram calculated using DETX and DETY for each event in the final _common_clean file
| Quadrant A | 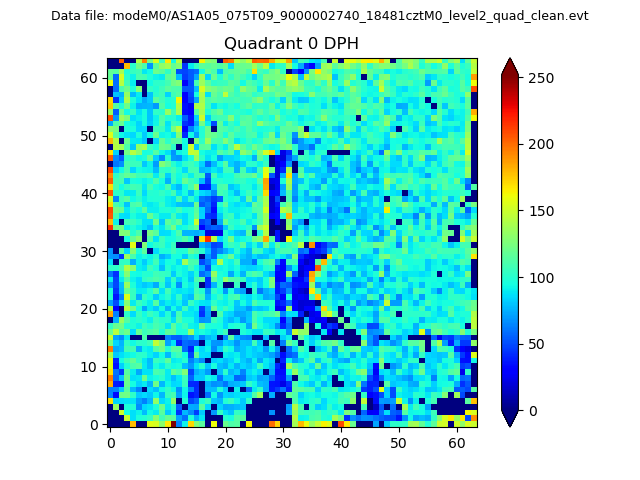 |
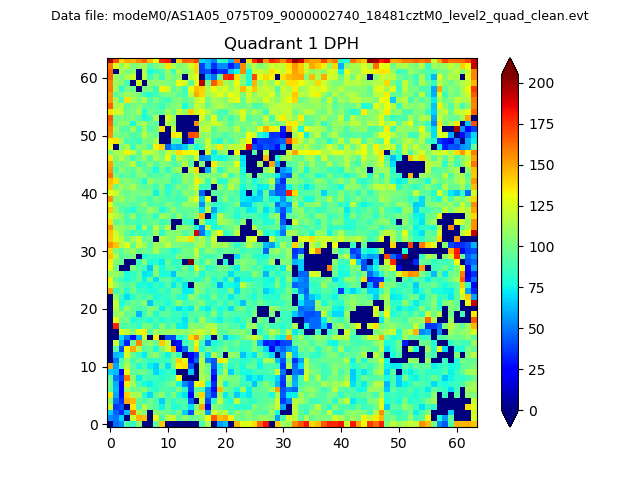 |
Quadrant B |
|---|---|---|---|
| Quadrant D | 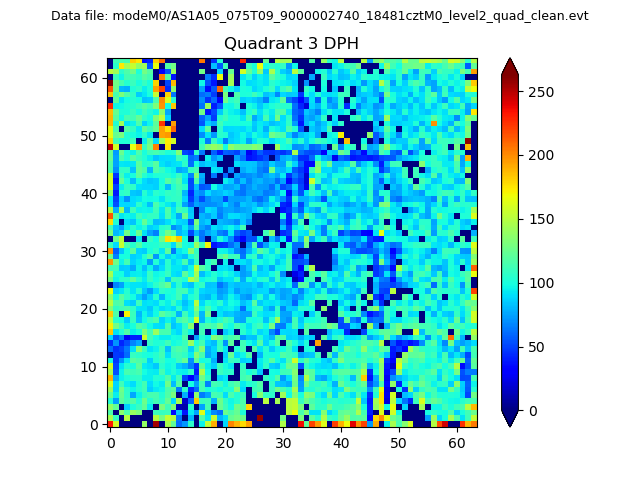 |
 |
Quadrant C |
| Plot type | Count rate plots | Images |
|---|---|---|
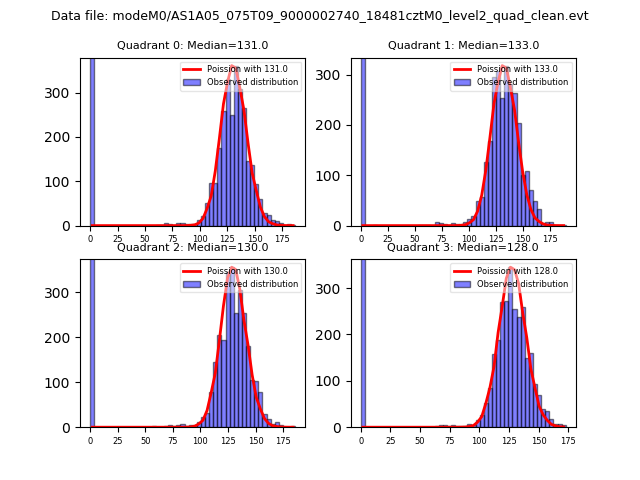
| Comparison with Poisson distribution Blue bars denote a histogram of data divided into 1 sec bins. Red curve is a Poisson curve with rate = median count rate of data. |
 |
 |
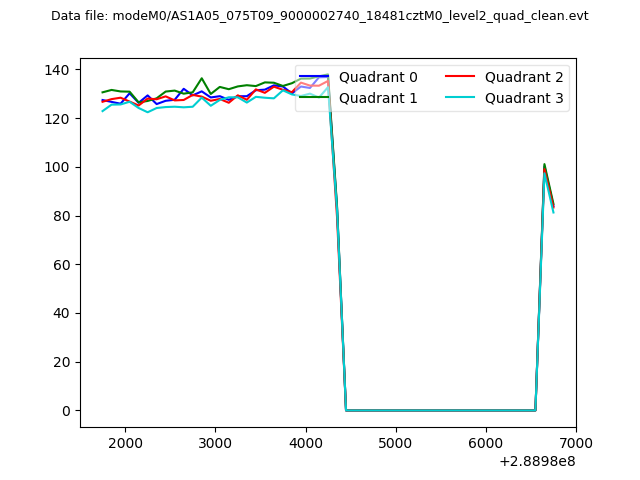
| Quadrant-wise count rates Data is divided into 100 sec bins |
 |
|
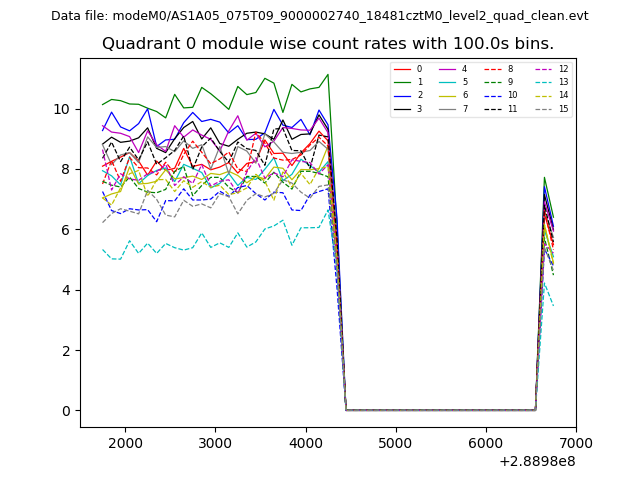
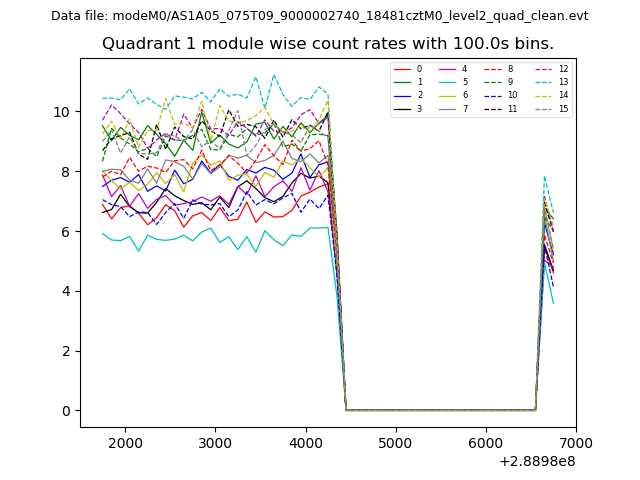
| Module-wise count rates for Quadrant A Data is divided into 100 sec bins |
 |
 |
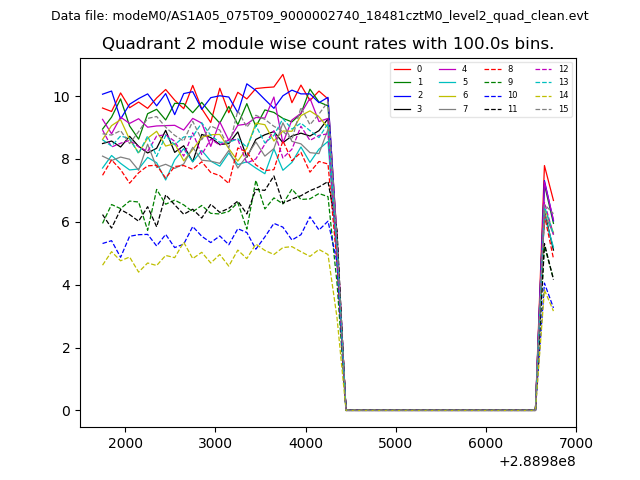
| Module-wise count rates for Quadrant B Data is divided into 100 sec bins |
 |
 |
| Module-wise count rates for Quadrant C Data is divided into 100 sec bins |
 |
 |
| Module-wise count rates for Quadrant D Data is divided into 100 sec bins |
 |
 |
| Parameter | Plot |
|---|---|
| CZT HV Monitor | 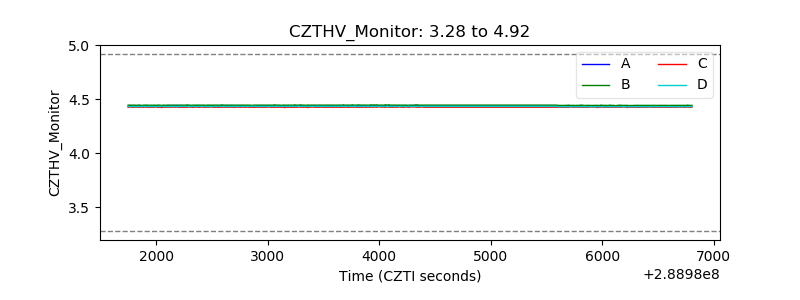 |
| D_VDD | 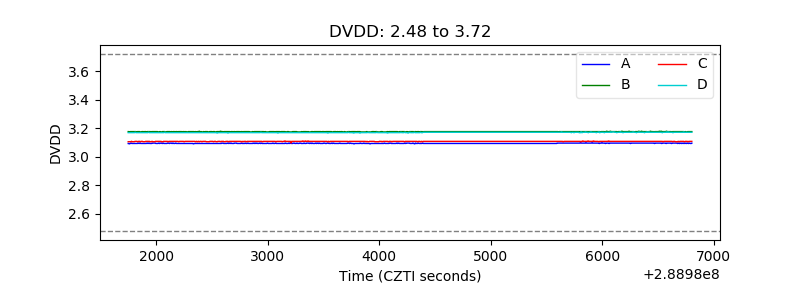 |
| Temperature 1 | 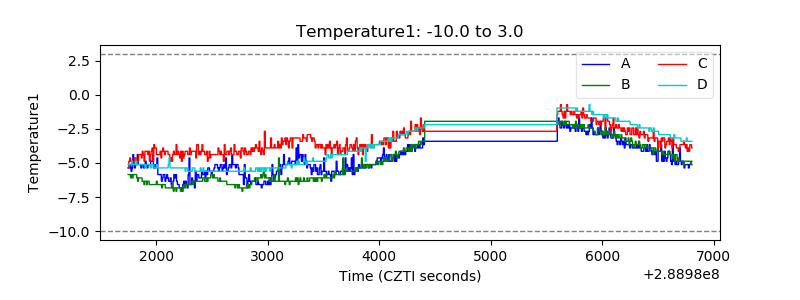 |
| Veto HV Monitor | 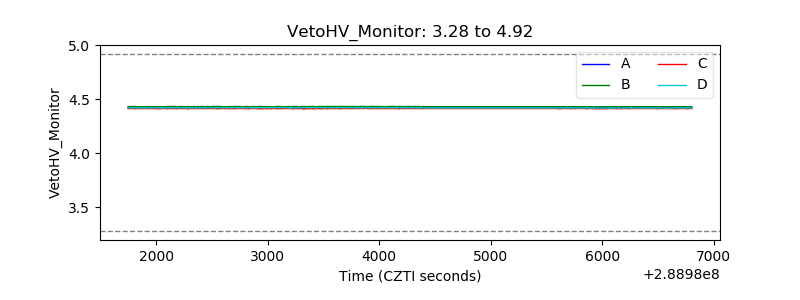 |
| Veto LLD | 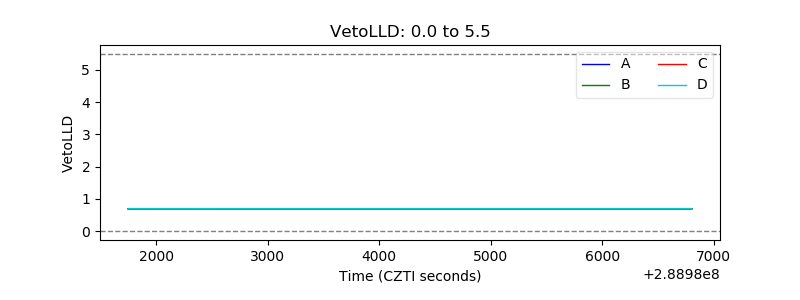 |
| Alpha Counter | 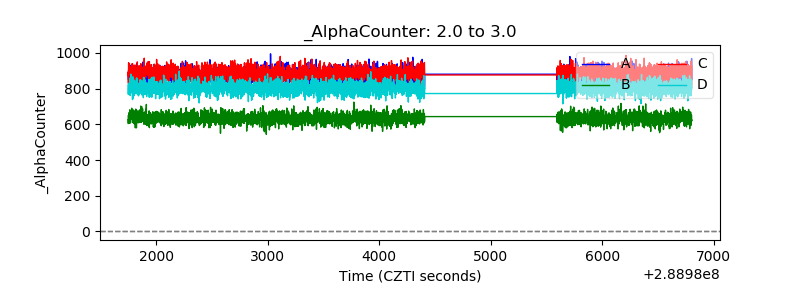 |
| _CPM_Rate | 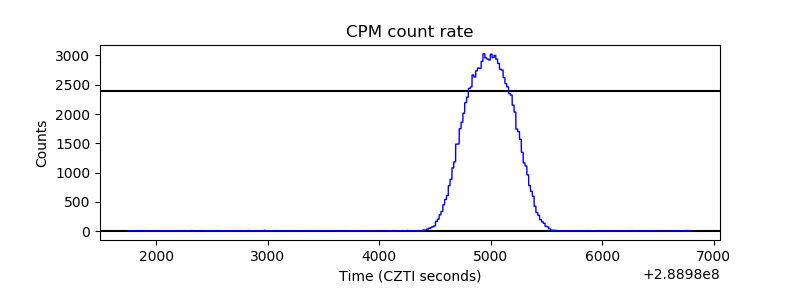 |
| CZT Counter | 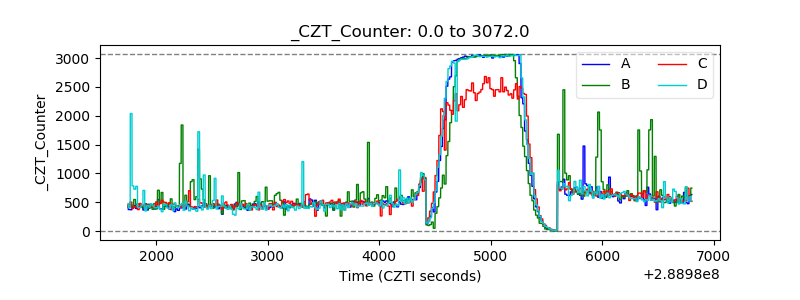 |
| +2.5 Volts monitor | 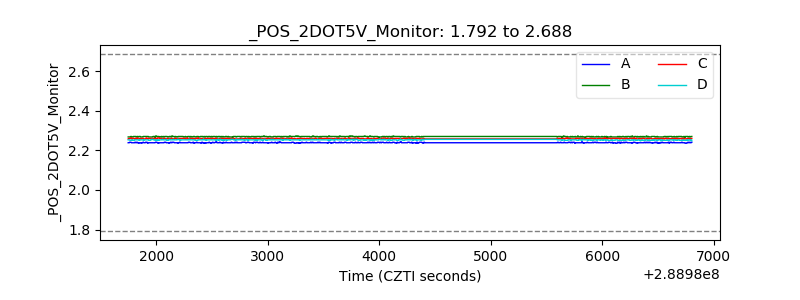 |
| +5 Volts monitor |  |
| _ROLL_ROT |  |
| _Roll_DEC | 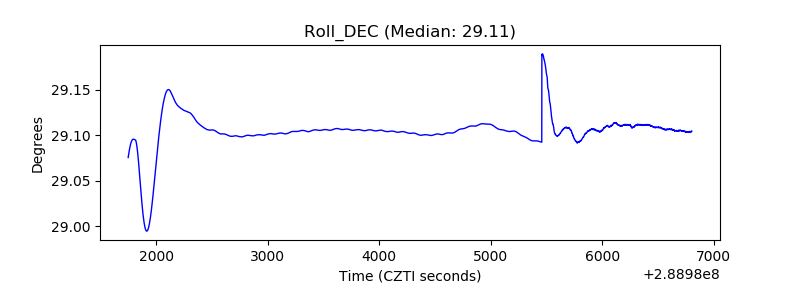 |
| _Roll_RA | 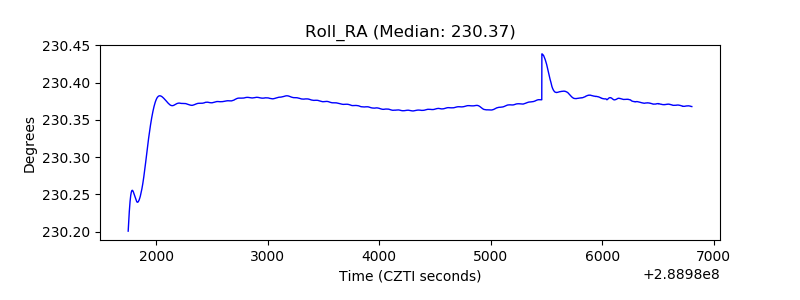 |
| Veto Counter | 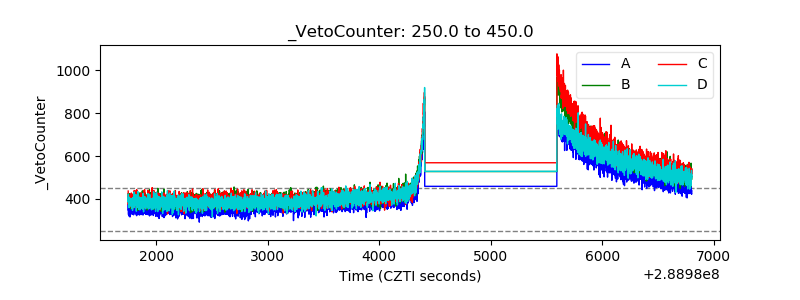 |