| Param | Original file | Final file |
|---|---|---|
| Filename | modeM0/AS1A05_075T09_9000002740_18482cztM0_level2.evt | modeM0/AS1A05_075T09_9000002740_18482cztM0_level2_quad_clean.evt |
| Size (bytes) | 456,105,600 | 90,691,200 |
| Size | 435.0 MB | 86.5 MB |
| Events in quadrant A | 3,273,192 | 578,850 |
| Events in quadrant B | 3,641,827 | 595,612 |
| Events in quadrant C | 3,274,612 | 581,930 |
| Events in quadrant D | 3,211,010 | 565,792 |
| Mode M9 | |||
|---|---|---|---|
| Quadrant | BADHDUFLAG | Total packets | Discarded packets |
| A | 0 | 13 | 0 |
| B | 0 | 13 | 0 |
| C | 0 | 13 | 0 |
| D | 0 | 13 | 0 |
| Mode SS | |||
|---|---|---|---|
| Quadrant | BADHDUFLAG | Total packets | Discarded packets |
| A | 0 | 122 | 0 |
| B | 0 | 122 | 0 |
| C | 0 | 122 | 0 |
| D | 0 | 122 | 0 |
| Mode M0 | |||
|---|---|---|---|
| Quadrant | BADHDUFLAG | Total packets | Discarded packets |
| A | 0 | 13666 | 1 |
| B | 0 | 14919 | 1 |
| C | 0 | 13692 | 1 |
| D | 0 | 13661 | 1 |
| Quadrant | Total seconds | Saturated seconds | Saturation percentage |
|---|---|---|---|
| A | 6082 | 47 | 0.772772% |
| B | 6082 | 112 | 1.841500% |
| C | 6082 | 85 | 1.397567% |
| D | 6083 | 51 | 0.838402% |
Noise dominated data is calculated using 1-second bins in cleaned event files. If a bin has >2000 counts, and if more than 50% of those come from <1% of pixels, then it is considered to be noise-dominated and hence unusable.
| Quadrant | # 1 sec bins | Bins with >0 counts | Bins with >2000 counts | High rate bins dominated by noise | Noise dominated (total time) | Noise dominated (detector-on time) | Marked lightcurve |
|---|---|---|---|---|---|---|---|
| A | 7367 | 6082 | 3 | 3 | 0.04% | 0.05% | 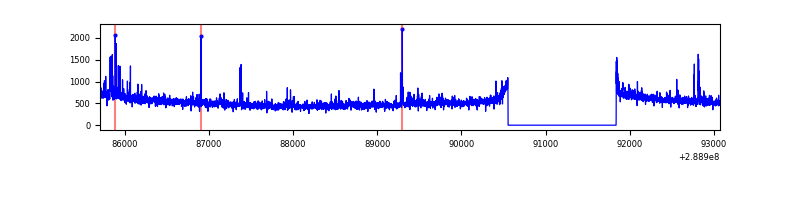 |
| B | 7367 | 6082 | 43 | 43 | 0.58% | 0.71% | 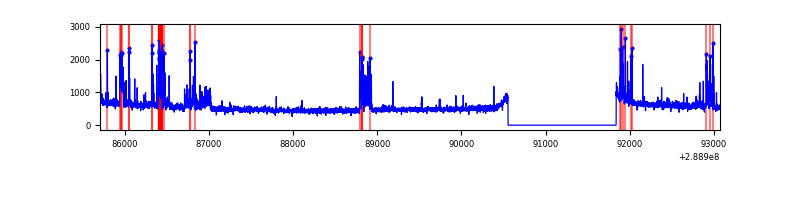 |
| C | 7367 | 6082 | 0 | 0 | 0.00% | 0.00% | 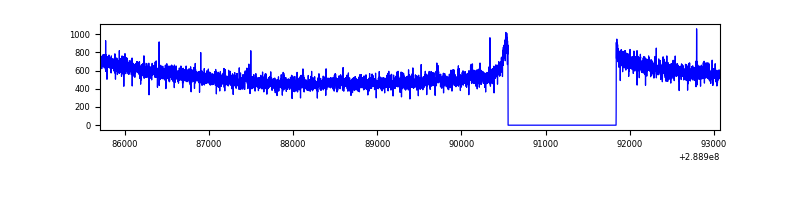 |
| D | 7368 | 6083 | 23 | 23 | 0.31% | 0.38% | 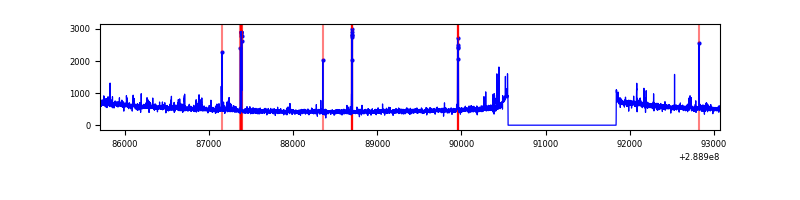 |
Top three noisy pixels from each quadrant. If the there are fewer than three noisy pixels in the level2.evt file, extra rows are filled as -1
| Pixel properties | Quadrant properties | ||||||
|---|---|---|---|---|---|---|---|
| Quadrant | DetID | PixID | Counts | Sigma | Mean | Median | Sigma |
| A | 0 | 13 | 86598 | 529.79 | 807 | 792 | 162.0 |
| A | 4 | 2 | 53713 | 326.75 | 807 | 792 | 162.0 |
| A | 15 | 174 | 19118 | 113.15 | 807 | 792 | 162.0 |
| B | 10 | 245 | 417577 | 2722.54 | 813 | 796 | 153.1 |
| B | 0 | 229 | 22495 | 141.74 | 813 | 796 | 153.1 |
| B | 12 | 111 | 17627 | 109.95 | 813 | 796 | 153.1 |
| C | 14 | 238 | 125845 | 680.74 | 795 | 802 | 183.7 |
| C | 3 | 233 | 49310 | 264.08 | 795 | 802 | 183.7 |
| C | 13 | 61 | 5598 | 26.11 | 795 | 802 | 183.7 |
| D | 10 | 70 | 39530 | 199.38 | 800 | 780 | 194.4 |
| D | 7 | 223 | 32667 | 164.07 | 800 | 780 | 194.4 |
| D | 2 | 234 | 29473 | 147.63 | 800 | 780 | 194.4 |
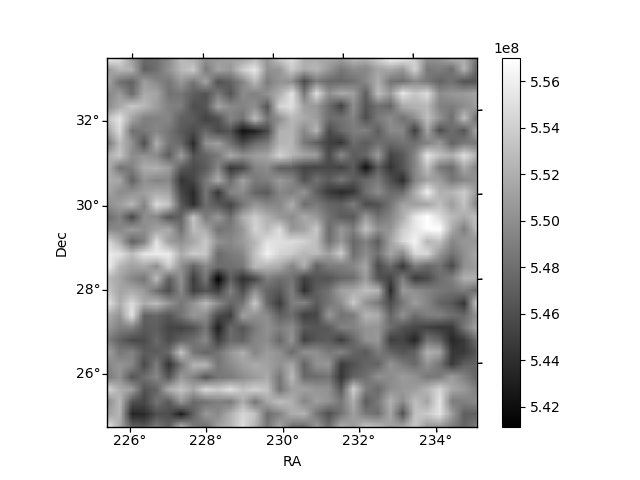
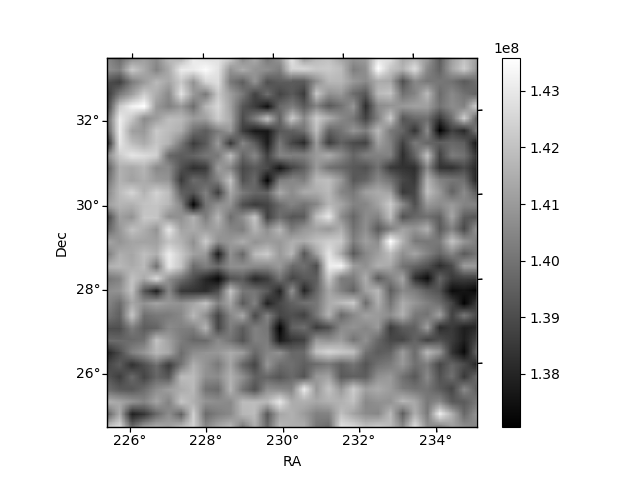
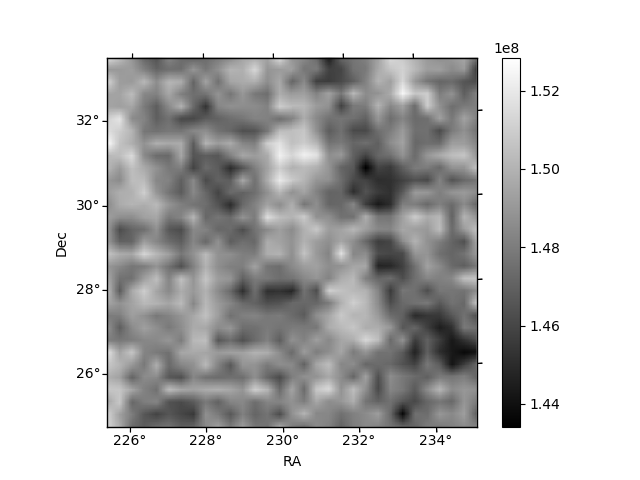
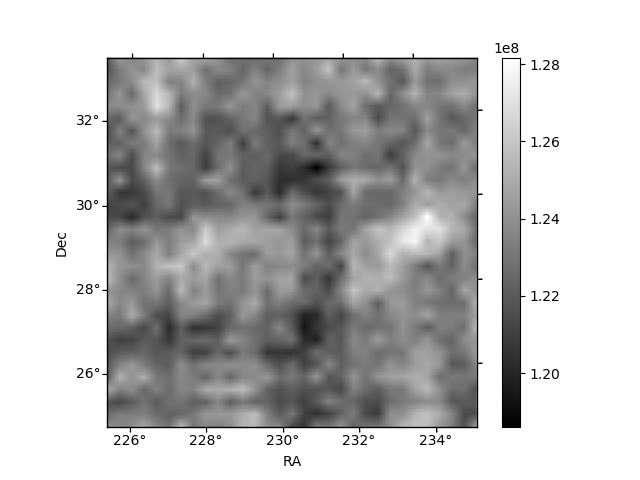
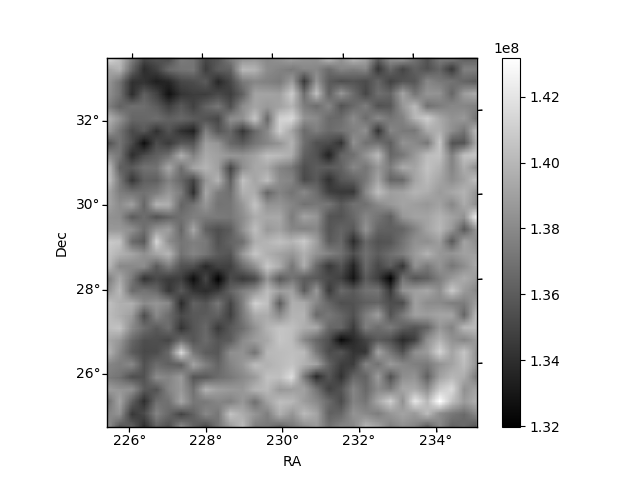
Histogram calculated using DETX and DETY for each event in the final _common_clean file
| Quadrant A | 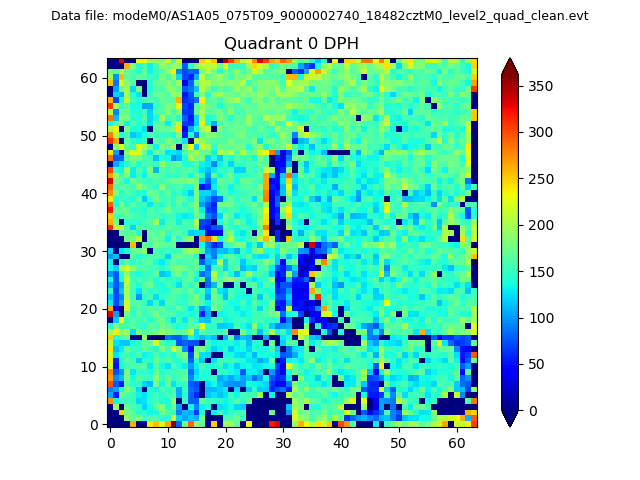 |
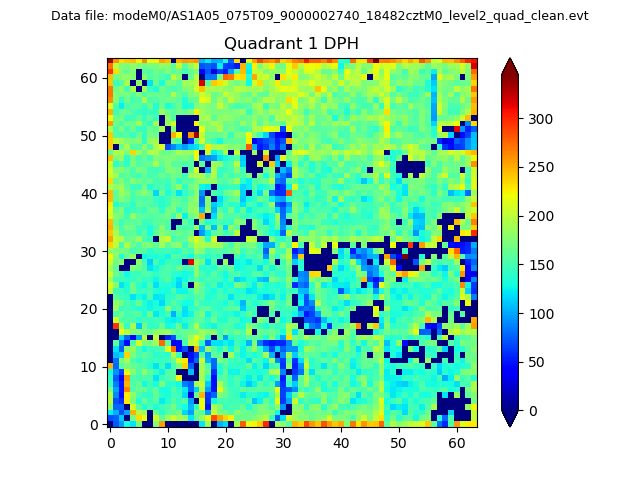 |
Quadrant B |
|---|---|---|---|
| Quadrant D | 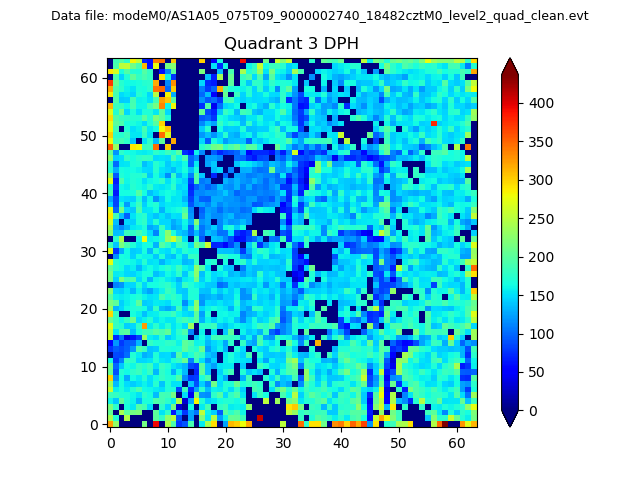 |
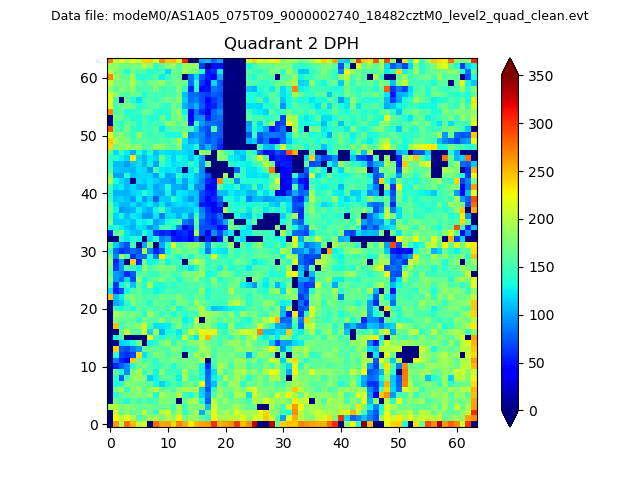 |
Quadrant C |
| Plot type | Count rate plots | Images |
|---|---|---|
| Comparison with Poisson distribution Blue bars denote a histogram of data divided into 1 sec bins. Red curve is a Poisson curve with rate = median count rate of data. |
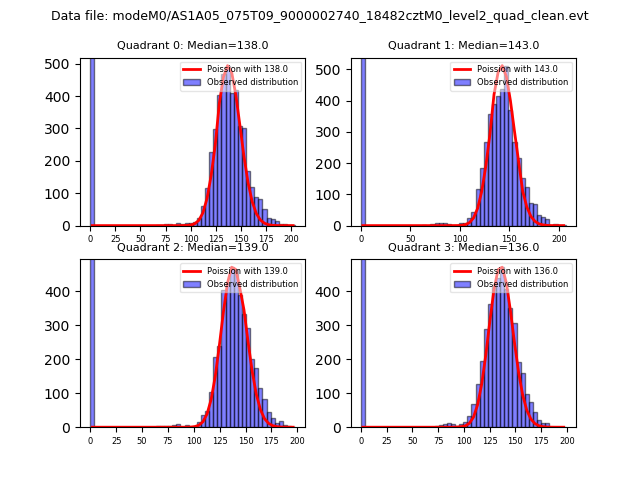 |
 |
| Quadrant-wise count rates Data is divided into 100 sec bins |
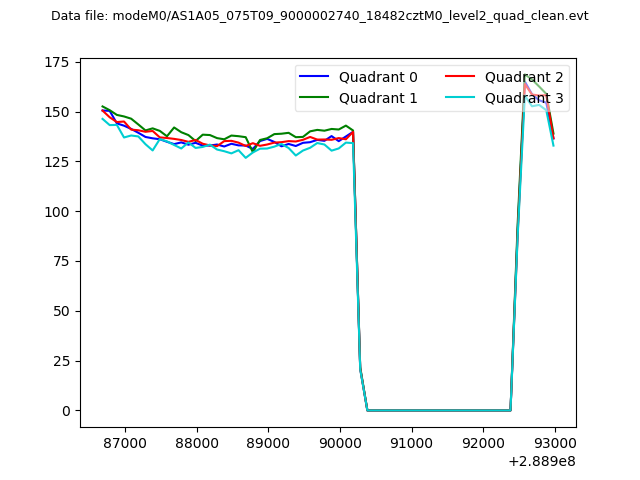 |
|
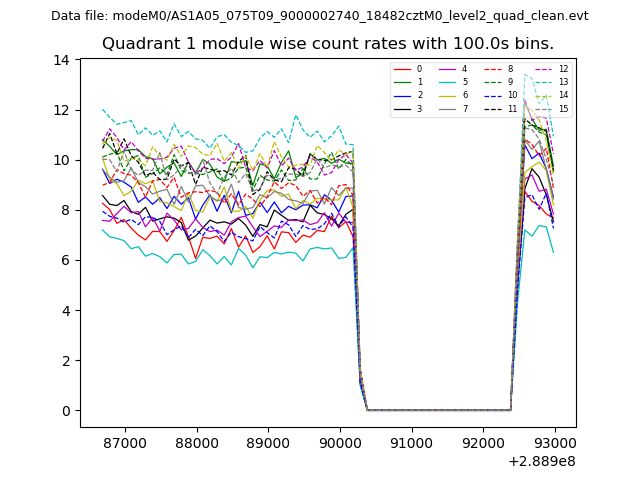
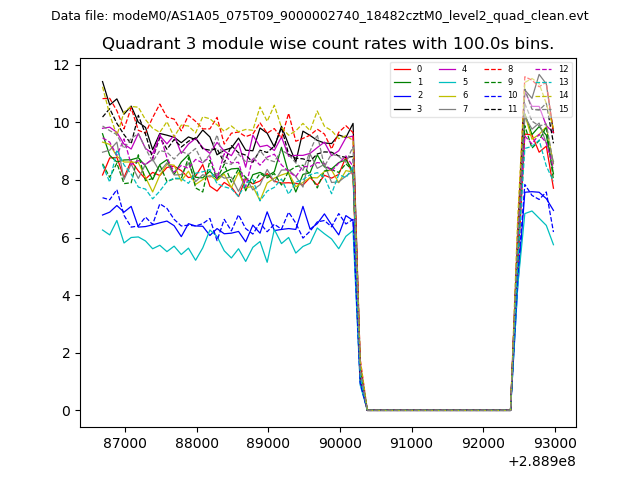
| Module-wise count rates for Quadrant A Data is divided into 100 sec bins |
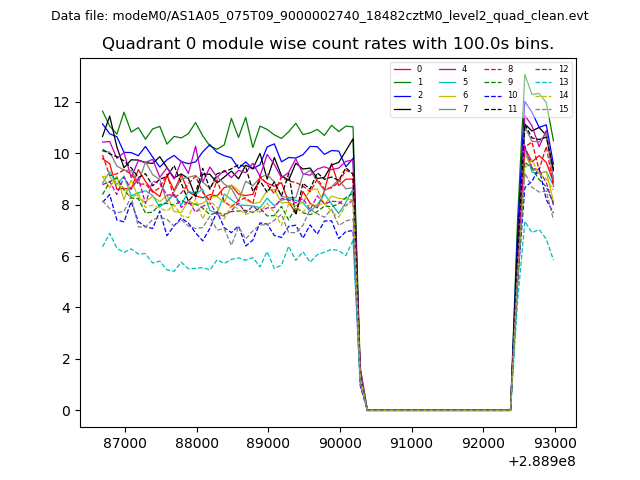 |
 |
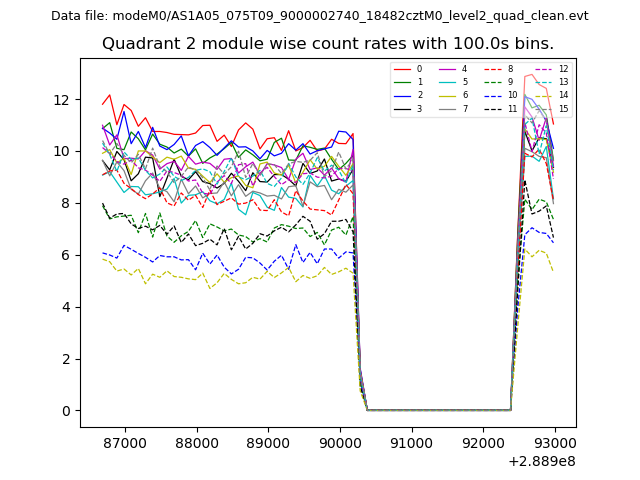
| Module-wise count rates for Quadrant B Data is divided into 100 sec bins |
 |
 |
| Module-wise count rates for Quadrant C Data is divided into 100 sec bins |
 |
 |
| Module-wise count rates for Quadrant D Data is divided into 100 sec bins |
 |
 |
| Parameter | Plot |
|---|---|
| CZT HV Monitor | 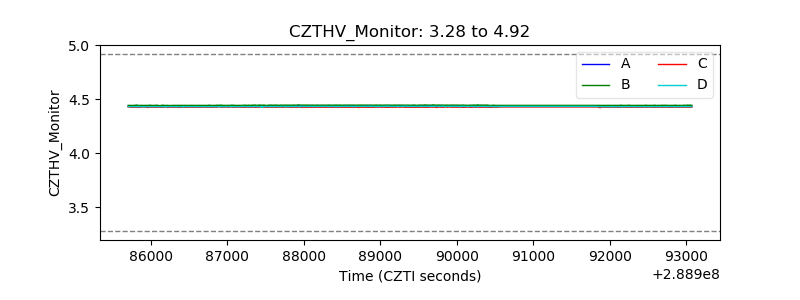 |
| D_VDD | 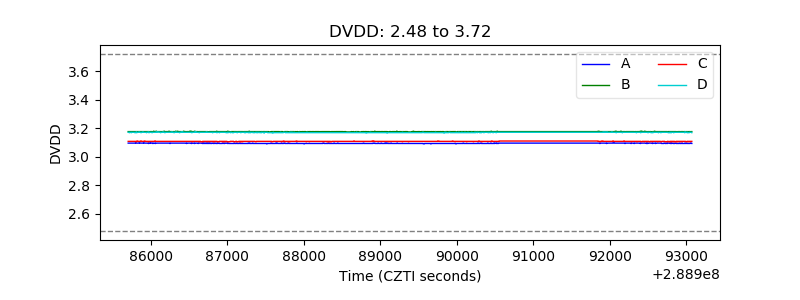 |
| Temperature 1 | 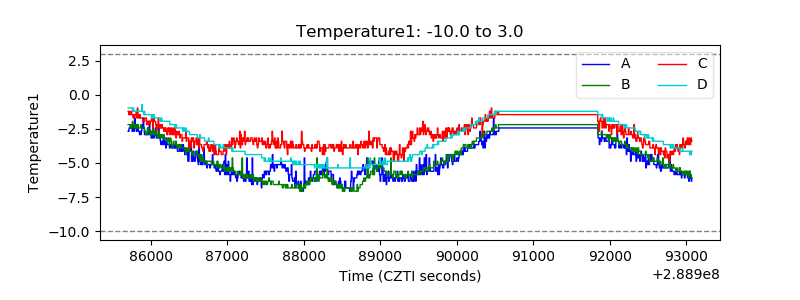 |
| Veto HV Monitor |  |
| Veto LLD | 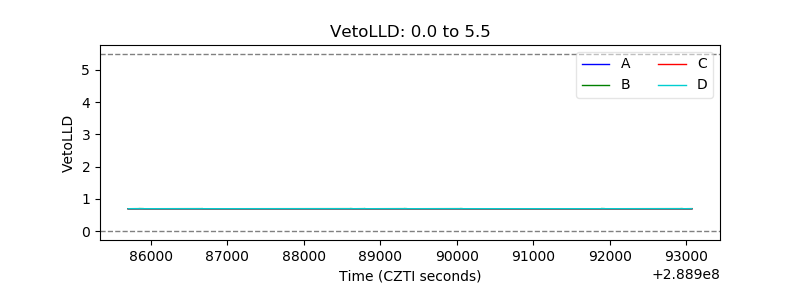 |
| Alpha Counter | 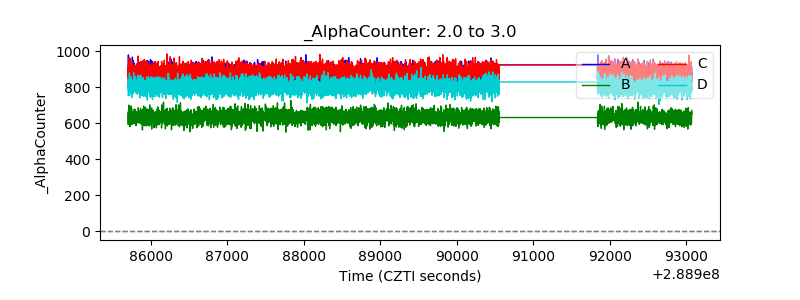 |
| _CPM_Rate |  |
| CZT Counter | 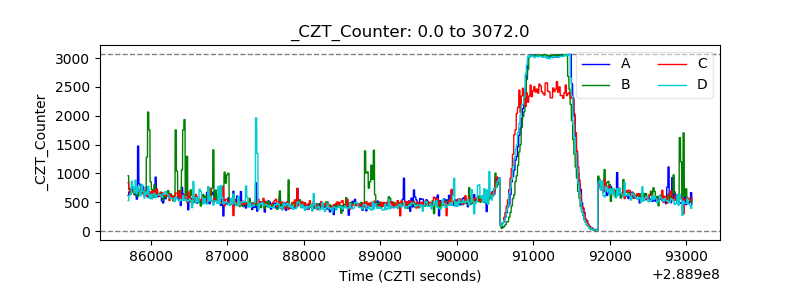 |
| +2.5 Volts monitor | 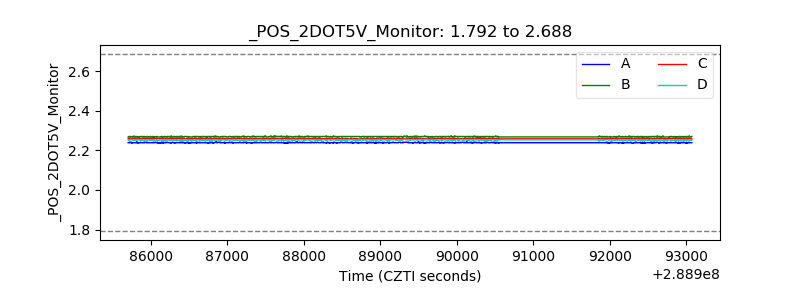 |
| +5 Volts monitor |  |
| _ROLL_ROT | 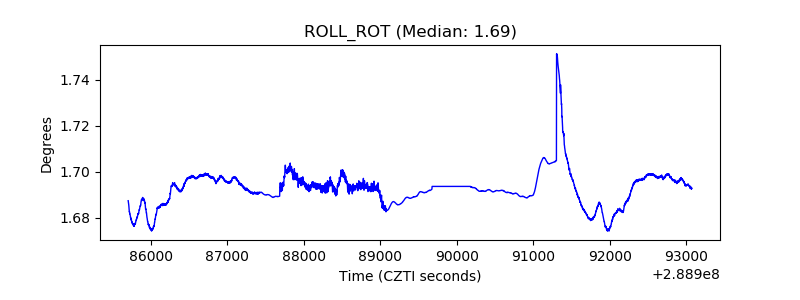 |
| _Roll_DEC | 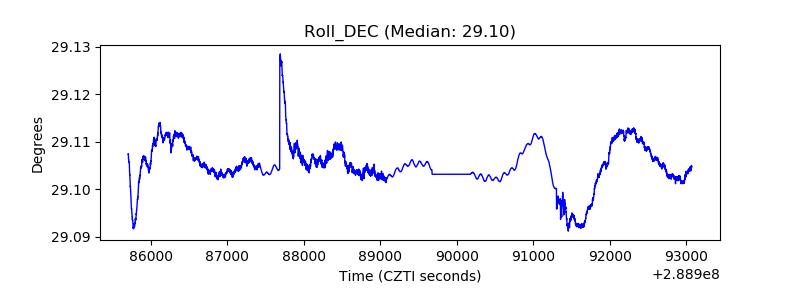 |
| _Roll_RA | 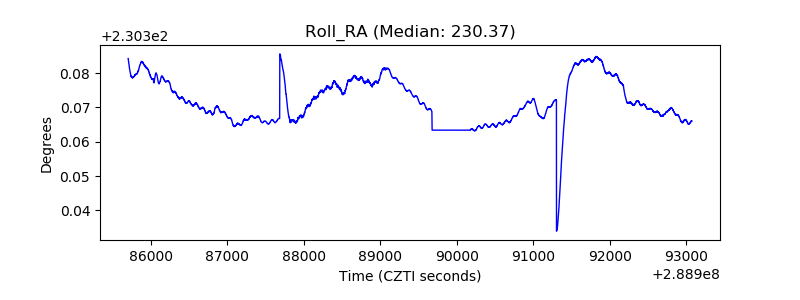 |
| Veto Counter | 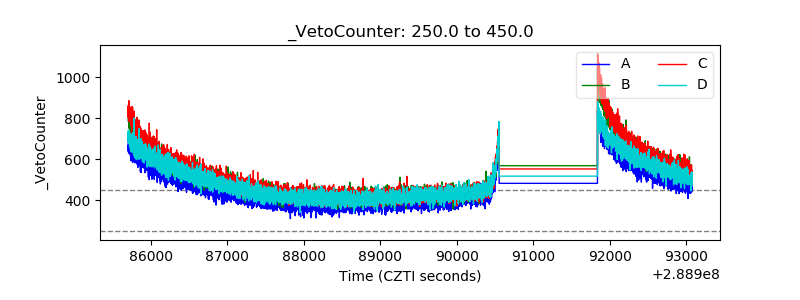 |