| Param | Original file | Final file |
|---|---|---|
| Filename | modeM0/AS1A05_075T09_9000002740_18484cztM0_level2.evt | modeM0/AS1A05_075T09_9000002740_18484cztM0_level2_quad_clean.evt |
| Size (bytes) | 466,102,080 | 109,679,040 |
| Size | 444.5 MB | 104.6 MB |
| Events in quadrant A | 3,227,023 | 718,656 |
| Events in quadrant B | 3,588,670 | 750,509 |
| Events in quadrant C | 3,748,283 | 722,606 |
| Events in quadrant D | 3,131,865 | 698,312 |
| Mode M9 | |||
|---|---|---|---|
| Quadrant | BADHDUFLAG | Total packets | Discarded packets |
| A | 0 | 27 | 0 |
| B | 0 | 27 | 0 |
| C | 0 | 27 | 0 |
| D | 0 | 27 | 0 |
| Mode SS | |||
|---|---|---|---|
| Quadrant | BADHDUFLAG | Total packets | Discarded packets |
| A | 0 | 128 | 0 |
| B | 0 | 128 | 0 |
| C | 0 | 128 | 0 |
| D | 0 | 128 | 0 |
| Mode M0 | |||
|---|---|---|---|
| Quadrant | BADHDUFLAG | Total packets | Discarded packets |
| A | 0 | 13519 | 2 |
| B | 0 | 14699 | 2 |
| C | 0 | 15123 | 2 |
| D | 0 | 13302 | 2 |
| Quadrant | Total seconds | Saturated seconds | Saturation percentage |
|---|---|---|---|
| A | 6186 | 38 | 0.614290% |
| B | 6186 | 125 | 2.020692% |
| C | 6186 | 126 | 2.036857% |
| D | 6186 | 41 | 0.662787% |
Noise dominated data is calculated using 1-second bins in cleaned event files. If a bin has >2000 counts, and if more than 50% of those come from <1% of pixels, then it is considered to be noise-dominated and hence unusable.
| Quadrant | # 1 sec bins | Bins with >0 counts | Bins with >2000 counts | High rate bins dominated by noise | Noise dominated (total time) | Noise dominated (detector-on time) | Marked lightcurve |
|---|---|---|---|---|---|---|---|
| A | 8921 | 6188 | 0 | 0 | 0.00% | 0.00% | 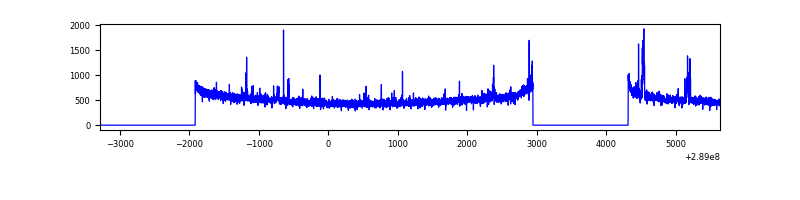 |
| B | 8921 | 6187 | 36 | 36 | 0.40% | 0.58% | 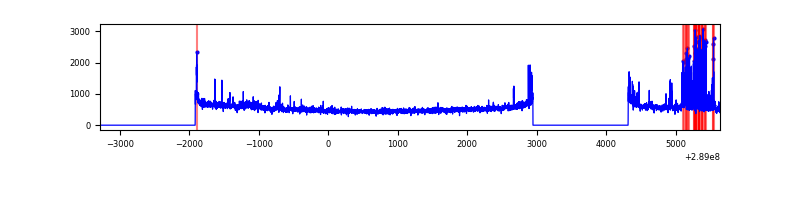 |
| C | 8921 | 6186 | 0 | 0 | 0.00% | 0.00% | 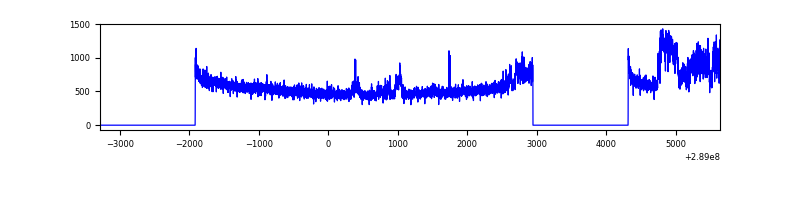 |
| D | 8921 | 6188 | 5 | 5 | 0.06% | 0.08% | 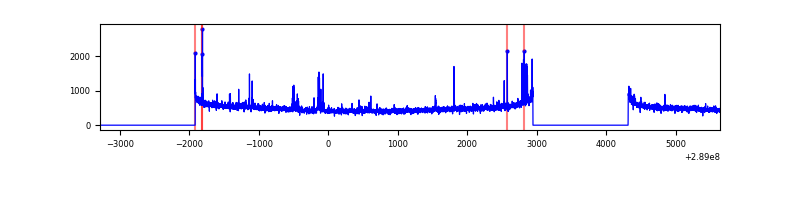 |
Top three noisy pixels from each quadrant. If the there are fewer than three noisy pixels in the level2.evt file, extra rows are filled as -1
| Pixel properties | Quadrant properties | ||||||
|---|---|---|---|---|---|---|---|
| Quadrant | DetID | PixID | Counts | Sigma | Mean | Median | Sigma |
| A | 15 | 174 | 77051 | 470.58 | 810 | 795 | 162.0 |
| A | 4 | 2 | 20125 | 119.29 | 810 | 795 | 162.0 |
| A | 0 | 13 | 6979 | 38.16 | 810 | 795 | 162.0 |
| B | 10 | 245 | 338391 | 2201.74 | 821 | 803 | 153.3 |
| B | 12 | 111 | 17564 | 109.31 | 821 | 803 | 153.3 |
| B | 0 | 244 | 16712 | 103.76 | 821 | 803 | 153.3 |
| C | 3 | 233 | 533401 | 2926.14 | 792 | 799 | 182.0 |
| C | 14 | 238 | 124216 | 678.06 | 792 | 799 | 182.0 |
| C | 13 | 61 | 5469 | 25.66 | 792 | 799 | 182.0 |
| D | 7 | 238 | 39582 | 201.88 | 794 | 774 | 192.2 |
| D | 7 | 96 | 32037 | 162.63 | 794 | 774 | 192.2 |
| D | 2 | 234 | 28011 | 141.69 | 794 | 774 | 192.2 |
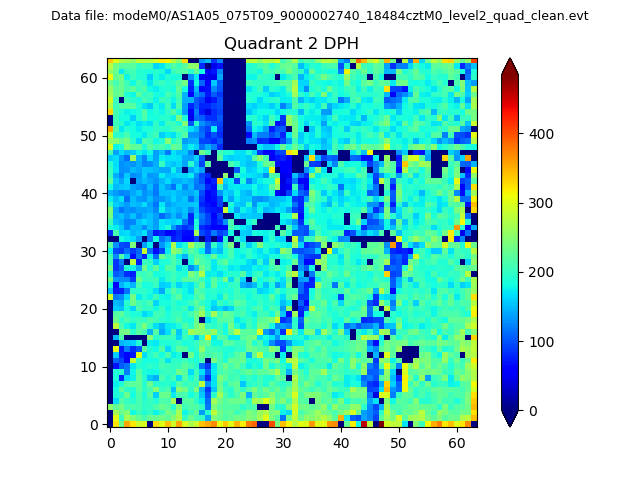
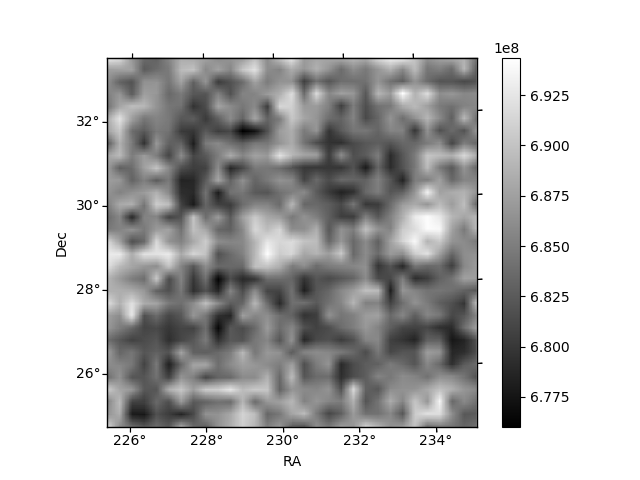
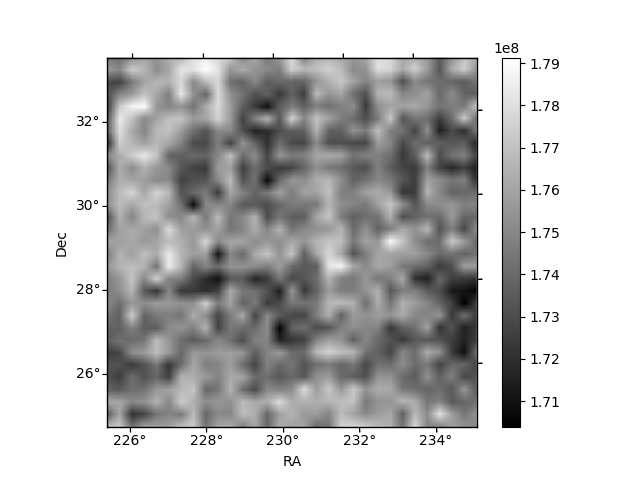
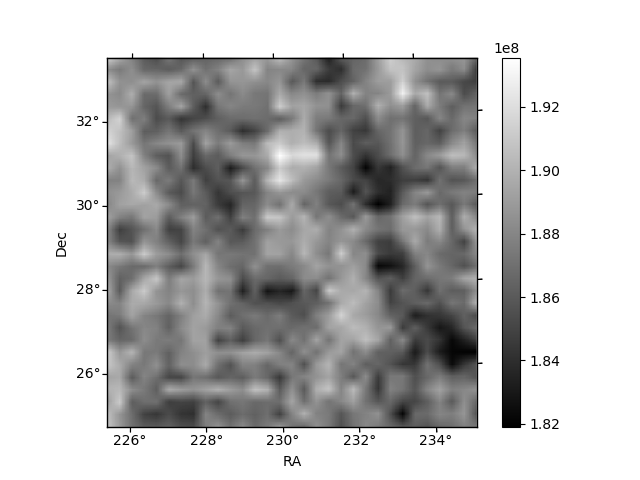
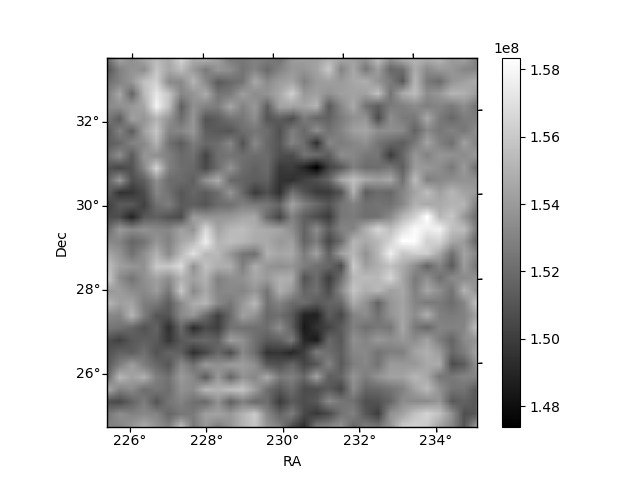
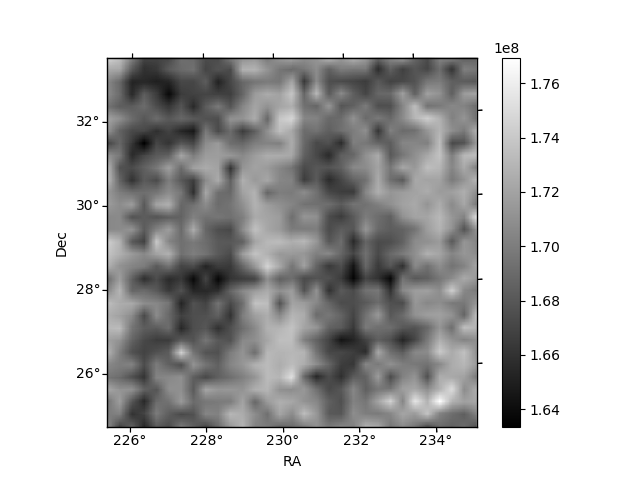
Histogram calculated using DETX and DETY for each event in the final _common_clean file
| Quadrant A | 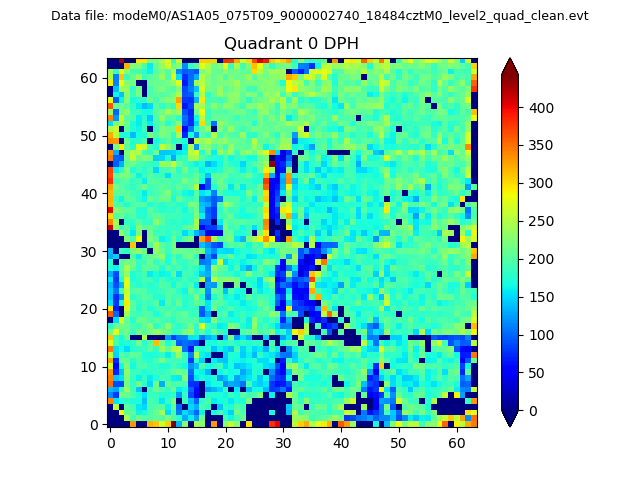 |
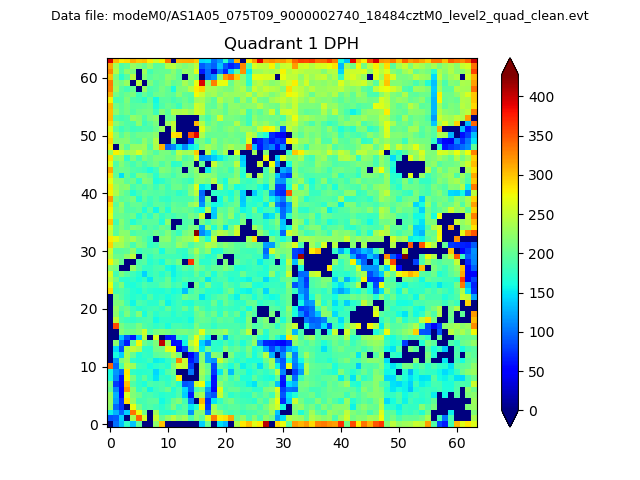 |
Quadrant B |
|---|---|---|---|
| Quadrant D | 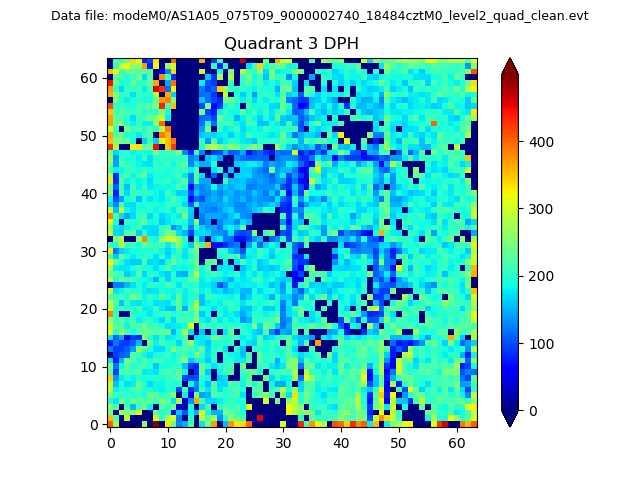 |
 |
Quadrant C |
| Plot type | Count rate plots | Images |
|---|---|---|
| Comparison with Poisson distribution Blue bars denote a histogram of data divided into 1 sec bins. Red curve is a Poisson curve with rate = median count rate of data. |
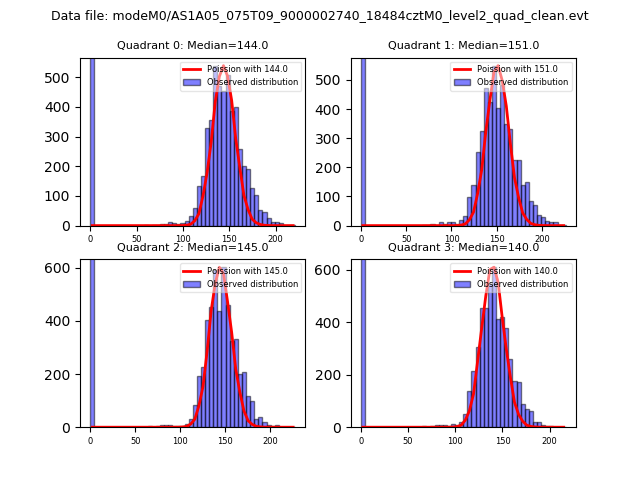 |
 |
| Quadrant-wise count rates Data is divided into 100 sec bins |
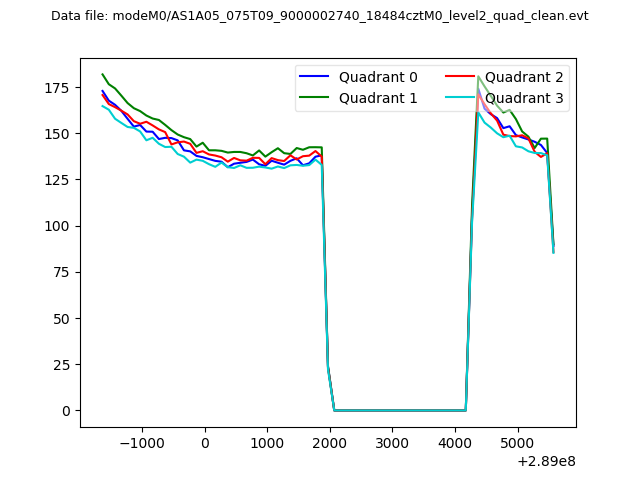 |
|
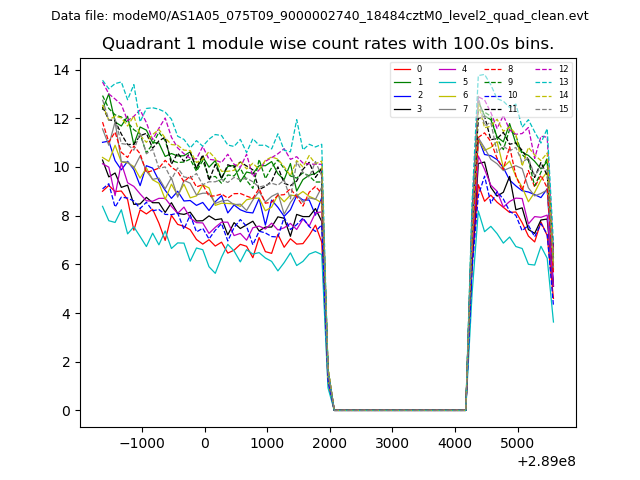
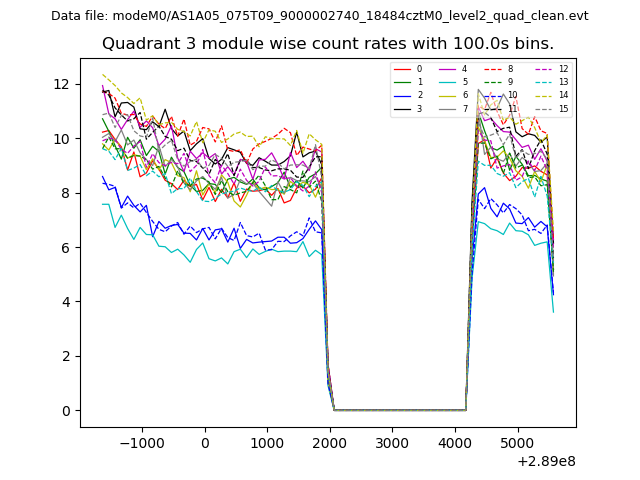
| Module-wise count rates for Quadrant A Data is divided into 100 sec bins |
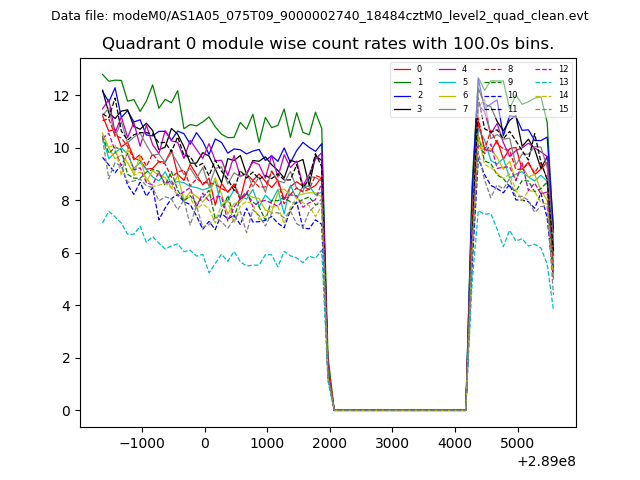 |
 |
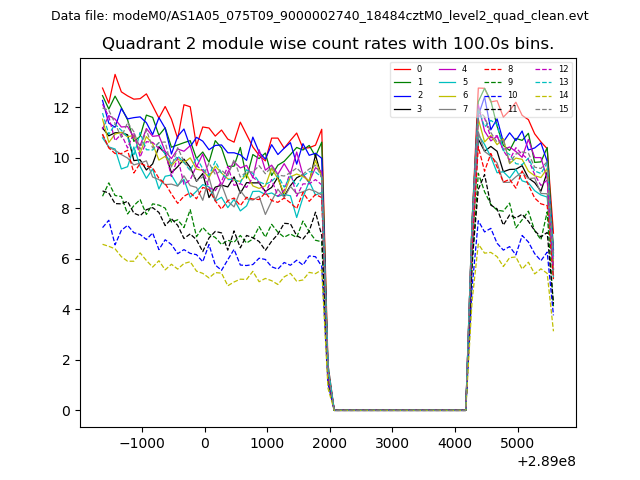
| Module-wise count rates for Quadrant B Data is divided into 100 sec bins |
 |
 |
| Module-wise count rates for Quadrant C Data is divided into 100 sec bins |
 |
 |
| Module-wise count rates for Quadrant D Data is divided into 100 sec bins |
 |
 |
| Parameter | Plot |
|---|---|
| CZT HV Monitor | 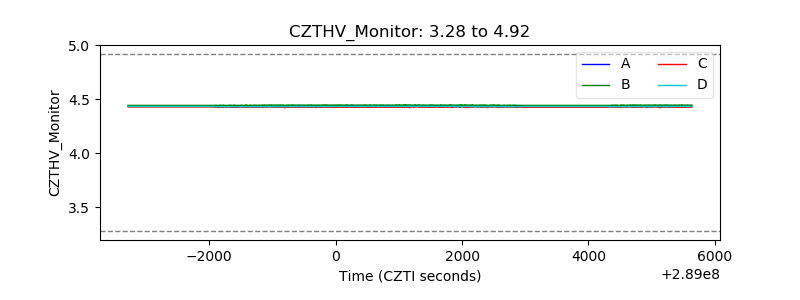 |
| D_VDD | 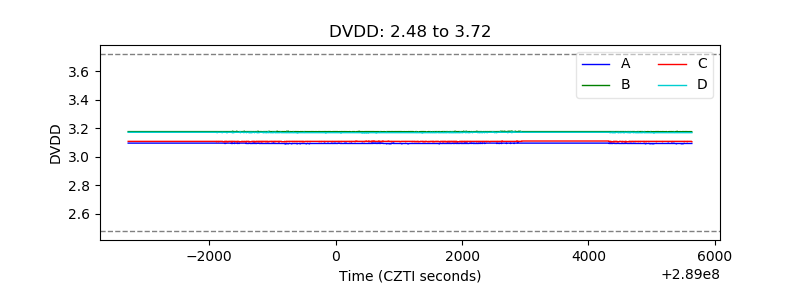 |
| Temperature 1 |  |
| Veto HV Monitor | 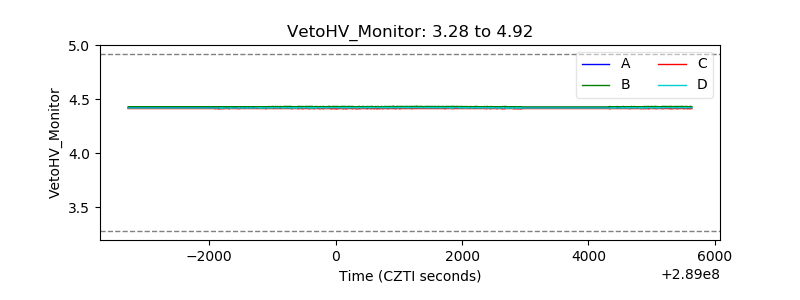 |
| Veto LLD | 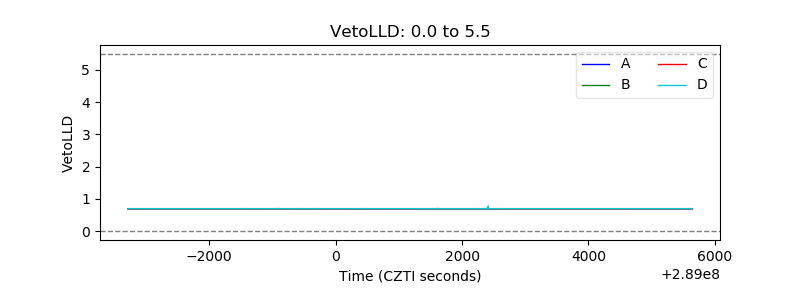 |
| Alpha Counter |  |
| _CPM_Rate | 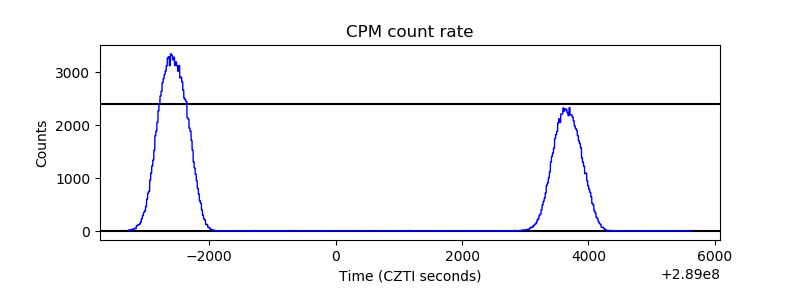 |
| CZT Counter | 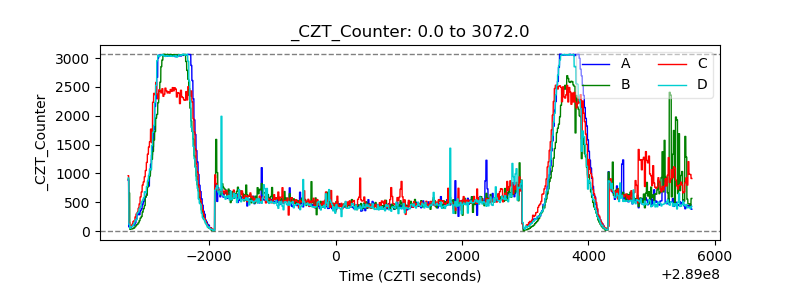 |
| +2.5 Volts monitor |  |
| +5 Volts monitor |  |
| _ROLL_ROT | 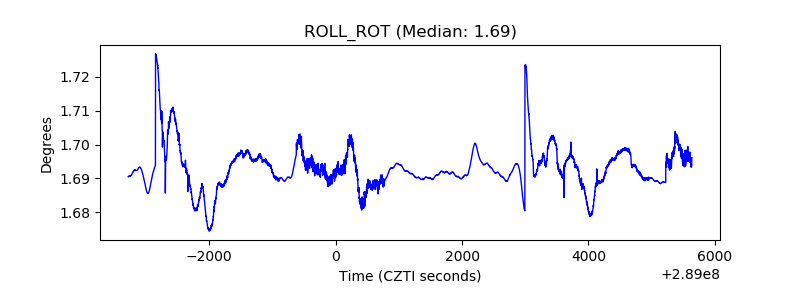 |
| _Roll_DEC | 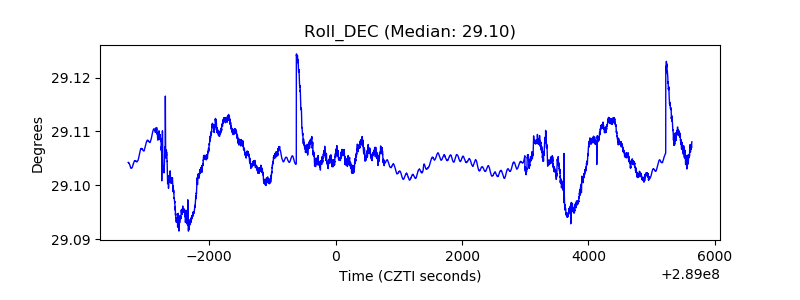 |
| _Roll_RA | 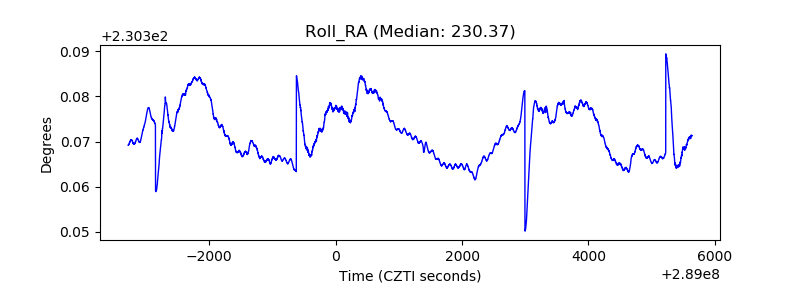 |
| Veto Counter | 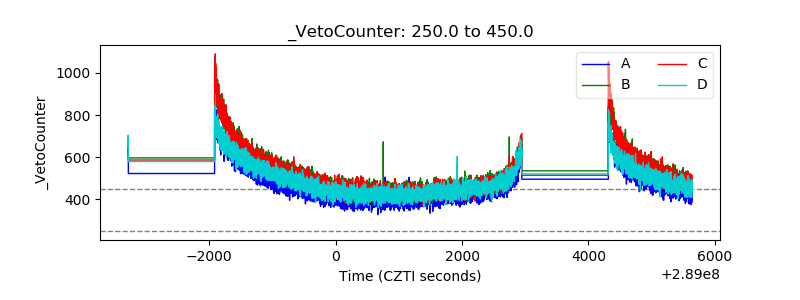 |