| Param | Original file | Final file |
|---|---|---|
| Filename | modeM0/AS1A05_075T09_9000002740_18485cztM0_level2.evt | modeM0/AS1A05_075T09_9000002740_18485cztM0_level2_quad_clean.evt |
| Size (bytes) | 496,016,640 | 103,976,640 |
| Size | 473.0 MB | 99.2 MB |
| Events in quadrant A | 3,433,088 | 677,254 |
| Events in quadrant B | 3,970,015 | 703,115 |
| Events in quadrant C | 4,085,290 | 673,471 |
| Events in quadrant D | 3,106,179 | 655,646 |
| Mode M9 | |||
|---|---|---|---|
| Quadrant | BADHDUFLAG | Total packets | Discarded packets |
| A | 0 | 18 | 0 |
| B | 0 | 19 | 0 |
| C | 0 | 19 | 0 |
| D | 0 | 19 | 0 |
| Mode SS | |||
|---|---|---|---|
| Quadrant | BADHDUFLAG | Total packets | Discarded packets |
| A | 0 | 128 | 0 |
| B | 0 | 128 | 0 |
| C | 0 | 128 | 0 |
| D | 0 | 128 | 0 |
| Mode M0 | |||
|---|---|---|---|
| Quadrant | BADHDUFLAG | Total packets | Discarded packets |
| A | 0 | 14270 | 2 |
| B | 0 | 15776 | 2 |
| C | 0 | 16340 | 2 |
| D | 0 | 13457 | 2 |
| Quadrant | Total seconds | Saturated seconds | Saturation percentage |
|---|---|---|---|
| A | 6298 | 136 | 2.159416% |
| B | 6298 | 187 | 2.969197% |
| C | 6298 | 118 | 1.873611% |
| D | 6298 | 19 | 0.301683% |
Noise dominated data is calculated using 1-second bins in cleaned event files. If a bin has >2000 counts, and if more than 50% of those come from <1% of pixels, then it is considered to be noise-dominated and hence unusable.
| Quadrant | # 1 sec bins | Bins with >0 counts | Bins with >2000 counts | High rate bins dominated by noise | Noise dominated (total time) | Noise dominated (detector-on time) | Marked lightcurve |
|---|---|---|---|---|---|---|---|
| A | 7538 | 6299 | 30 | 30 | 0.40% | 0.48% | 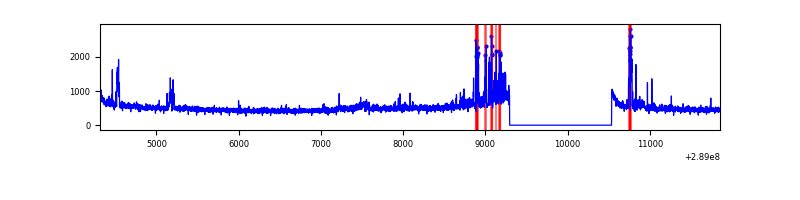 |
| B | 7538 | 6298 | 85 | 85 | 1.13% | 1.35% | 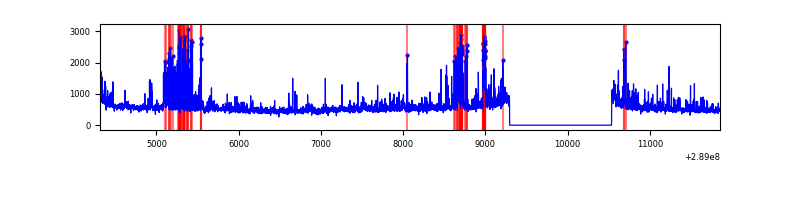 |
| C | 7538 | 6299 | 0 | 0 | 0.00% | 0.00% | 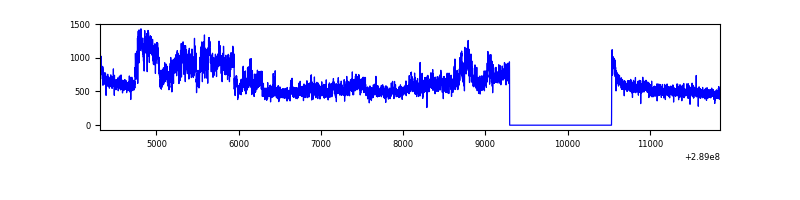 |
| D | 7538 | 6299 | 6 | 6 | 0.08% | 0.10% | 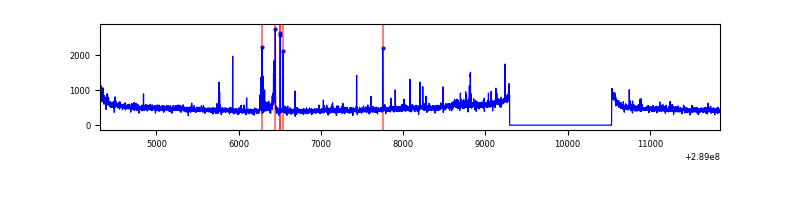 |
Top three noisy pixels from each quadrant. If the there are fewer than three noisy pixels in the level2.evt file, extra rows are filled as -1
| Pixel properties | Quadrant properties | ||||||
|---|---|---|---|---|---|---|---|
| Quadrant | DetID | PixID | Counts | Sigma | Mean | Median | Sigma |
| A | 15 | 174 | 324120 | 2033.98 | 795 | 782 | 159.0 |
| A | 0 | 13 | 35813 | 220.36 | 795 | 782 | 159.0 |
| A | 4 | 2 | 15931 | 95.3 | 795 | 782 | 159.0 |
| B | 10 | 245 | 703823 | 4632.43 | 802 | 781 | 151.8 |
| B | 4 | 216 | 70511 | 459.46 | 802 | 781 | 151.8 |
| B | 0 | 244 | 38871 | 250.98 | 802 | 781 | 151.8 |
| C | 3 | 233 | 937452 | 5220.78 | 777 | 782 | 179.4 |
| C | 14 | 238 | 120148 | 665.32 | 777 | 782 | 179.4 |
| C | 13 | 61 | 5400 | 25.74 | 777 | 782 | 179.4 |
| D | 7 | 238 | 111448 | 578.57 | 781 | 759 | 191.3 |
| D | 2 | 234 | 27106 | 137.72 | 781 | 759 | 191.3 |
| D | 13 | 232 | 11290 | 55.05 | 781 | 759 | 191.3 |
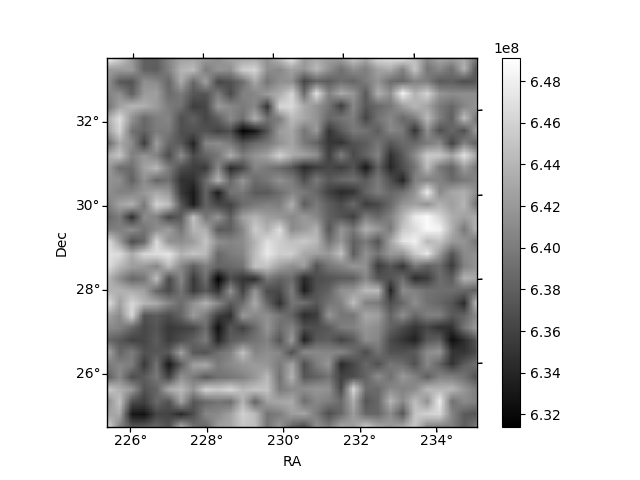
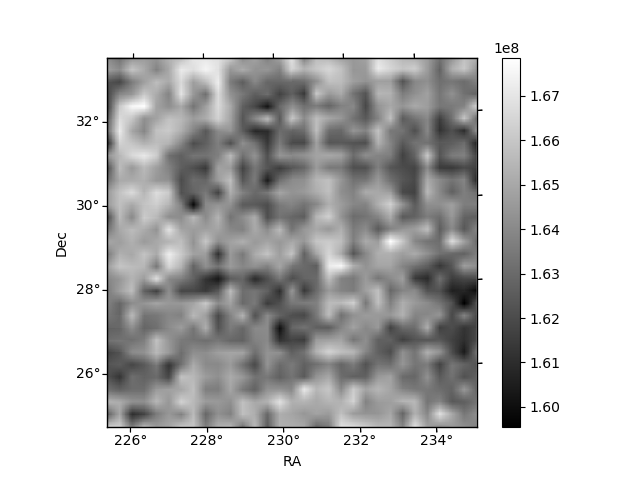
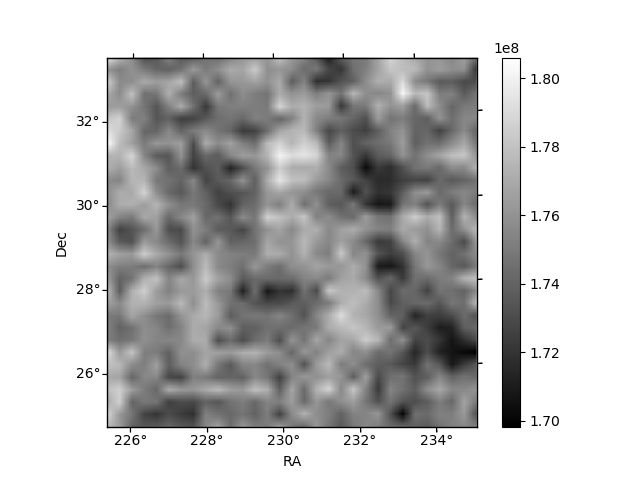
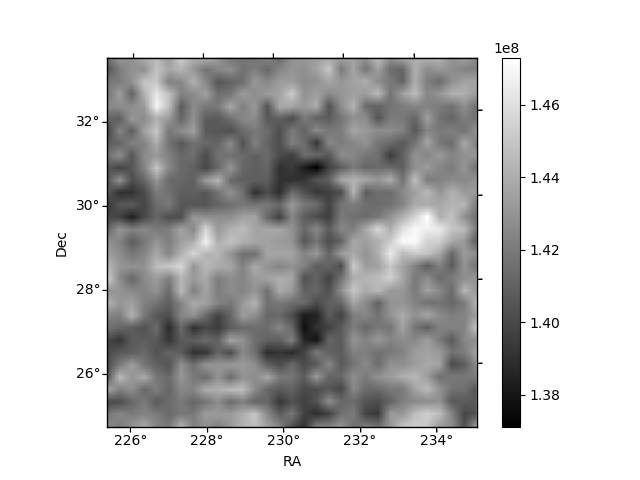
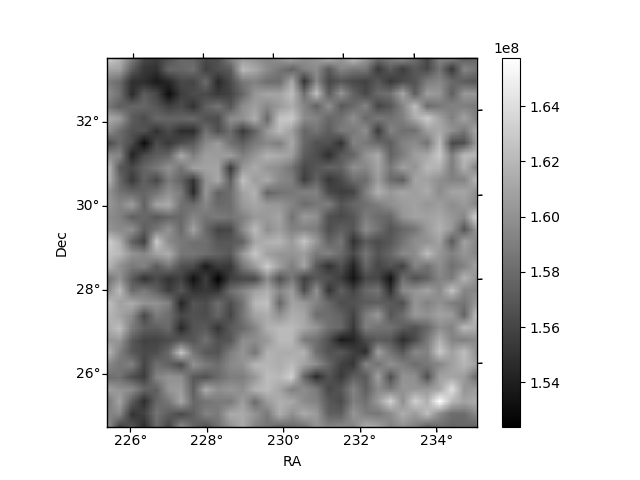
Histogram calculated using DETX and DETY for each event in the final _common_clean file
| Quadrant A | 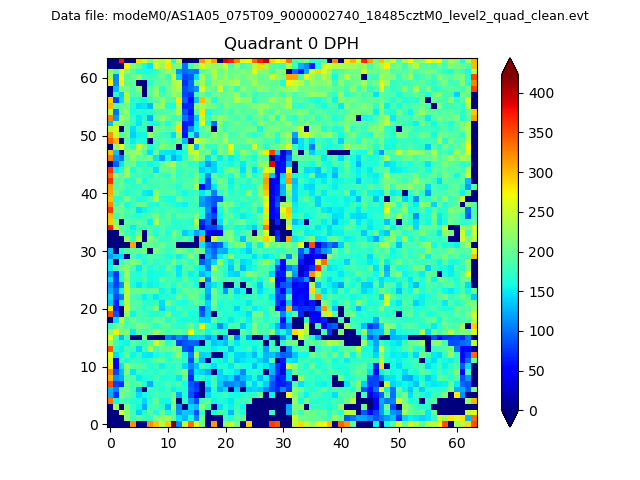 |
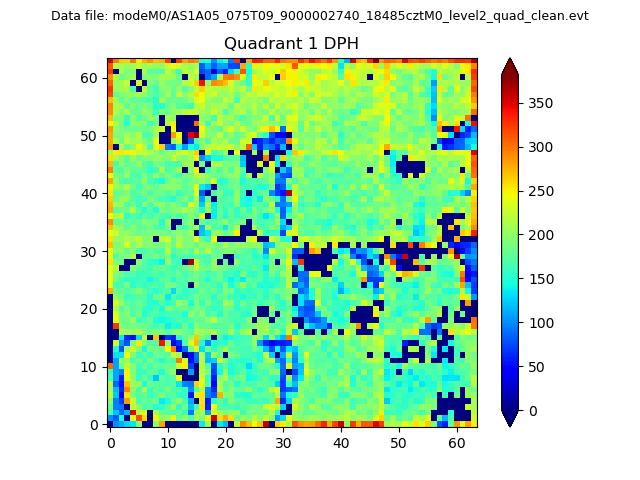 |
Quadrant B |
|---|---|---|---|
| Quadrant D | 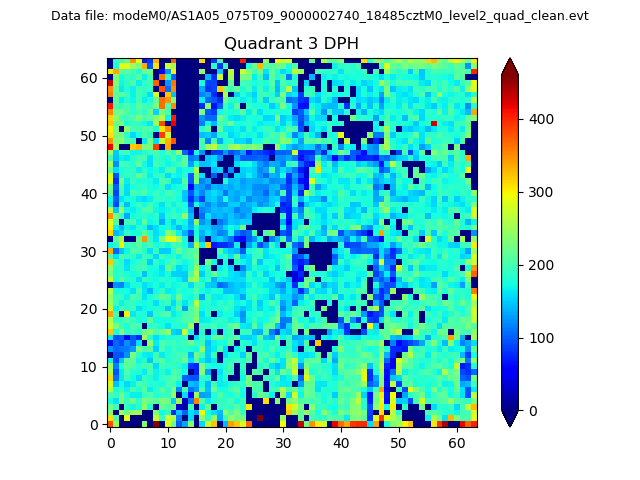 |
 |
Quadrant C |
| Plot type | Count rate plots | Images |
|---|---|---|
| Comparison with Poisson distribution Blue bars denote a histogram of data divided into 1 sec bins. Red curve is a Poisson curve with rate = median count rate of data. |
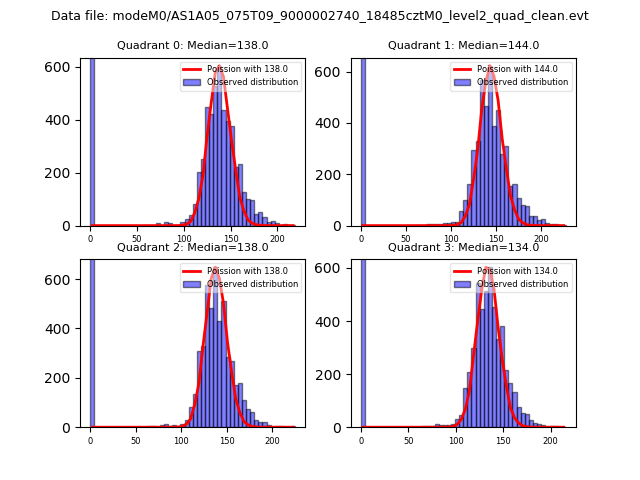 |
 |
| Quadrant-wise count rates Data is divided into 100 sec bins |
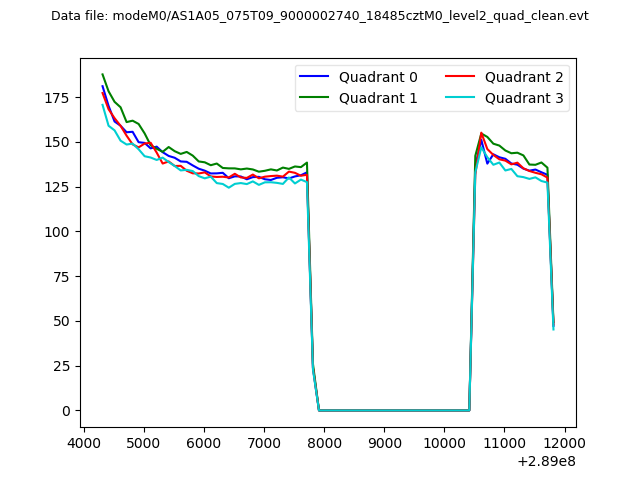 |
|
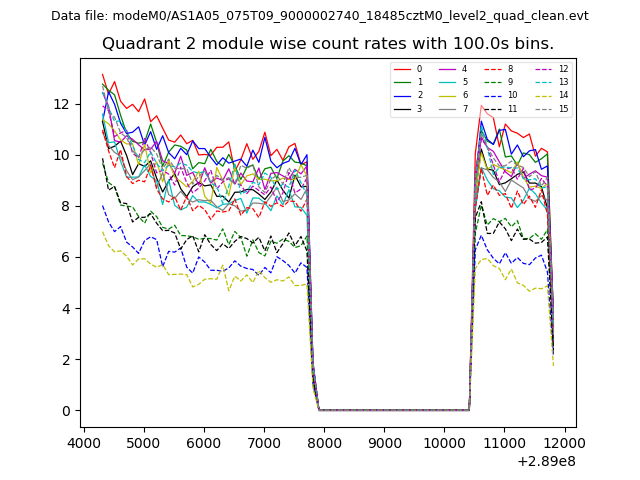
| Module-wise count rates for Quadrant A Data is divided into 100 sec bins |
 |
 |
| Module-wise count rates for Quadrant B Data is divided into 100 sec bins |
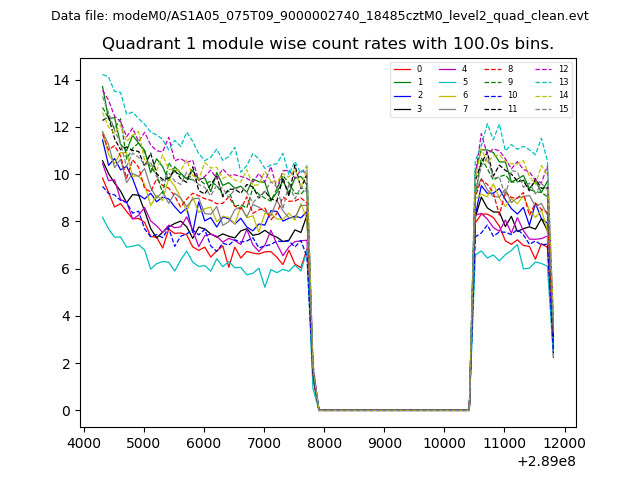 |
 |
| Module-wise count rates for Quadrant C Data is divided into 100 sec bins |
 |
 |
| Module-wise count rates for Quadrant D Data is divided into 100 sec bins |
 |
 |
| Parameter | Plot |
|---|---|
| CZT HV Monitor | 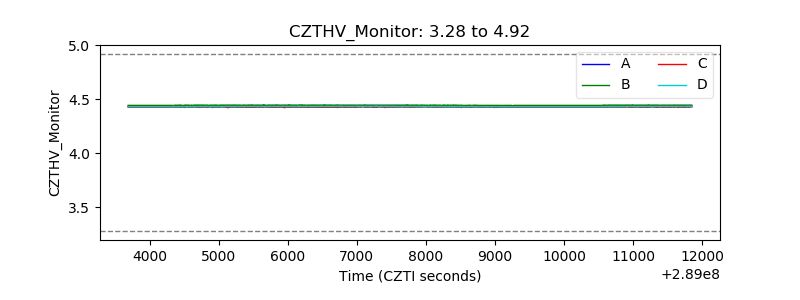 |
| D_VDD | 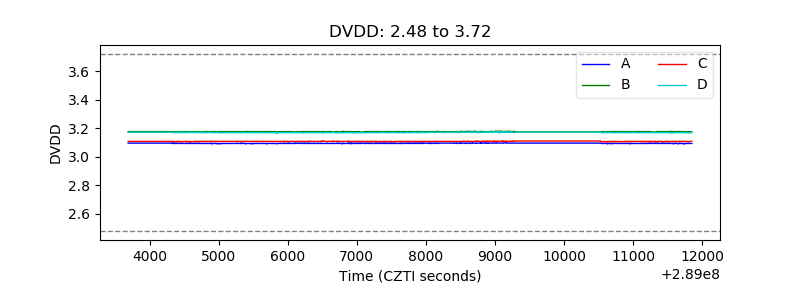 |
| Temperature 1 | 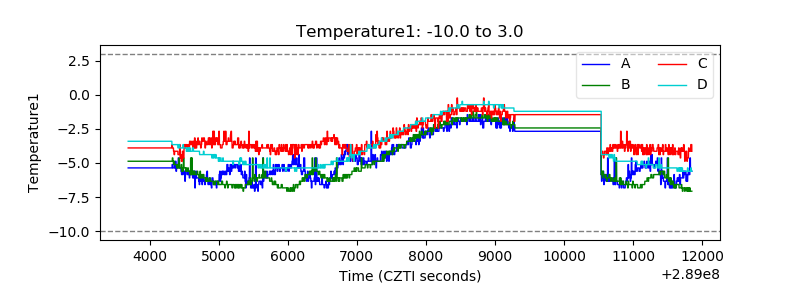 |
| Veto HV Monitor | 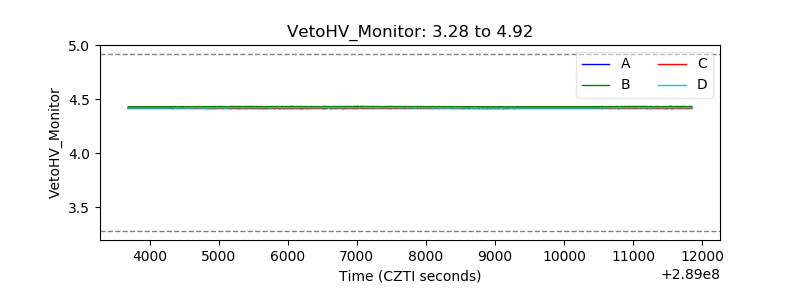 |
| Veto LLD | 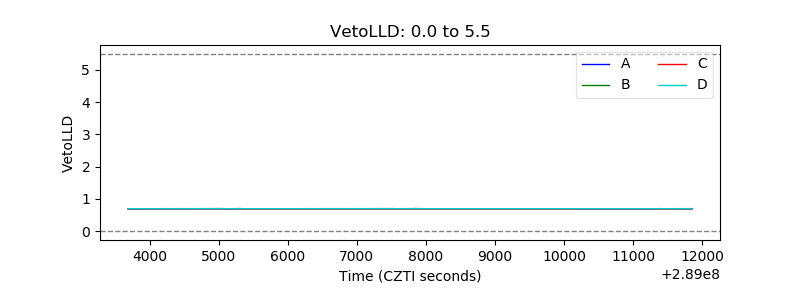 |
| Alpha Counter | 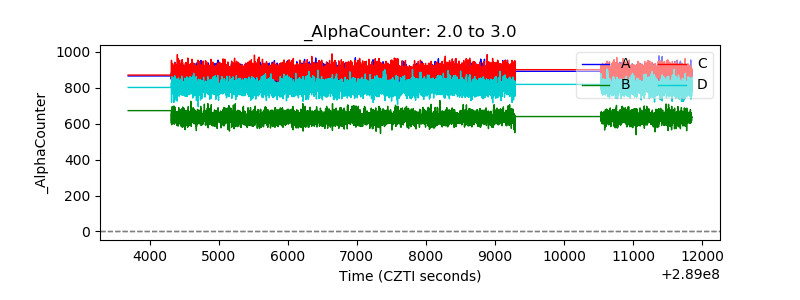 |
| _CPM_Rate | 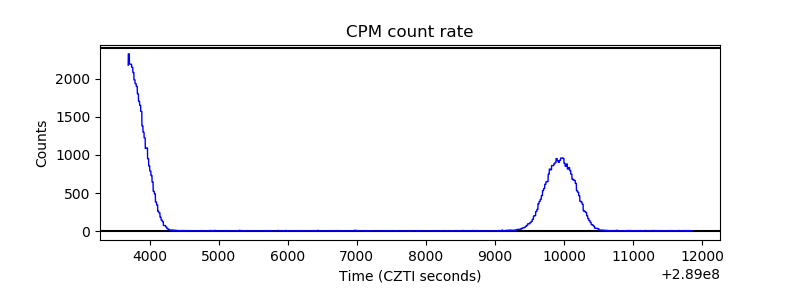 |
| CZT Counter | 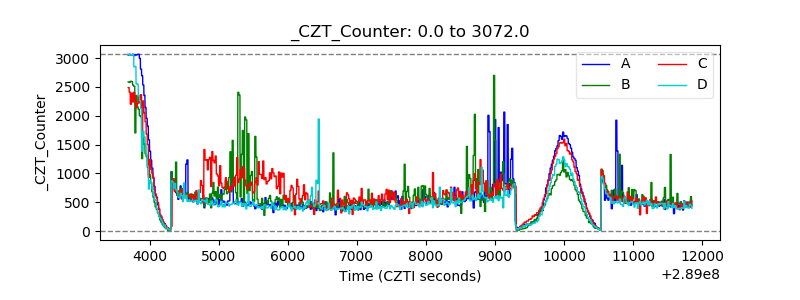 |
| +2.5 Volts monitor |  |
| +5 Volts monitor |  |
| _ROLL_ROT |  |
| _Roll_DEC | 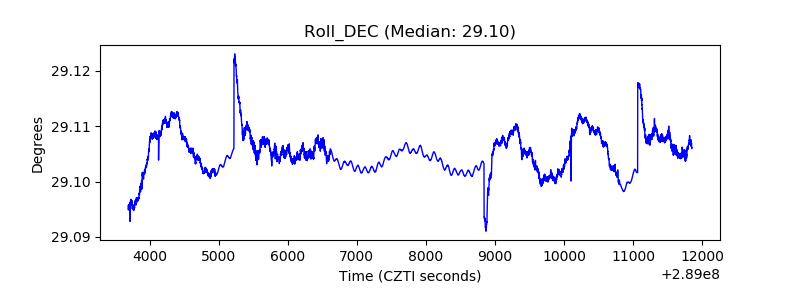 |
| _Roll_RA | 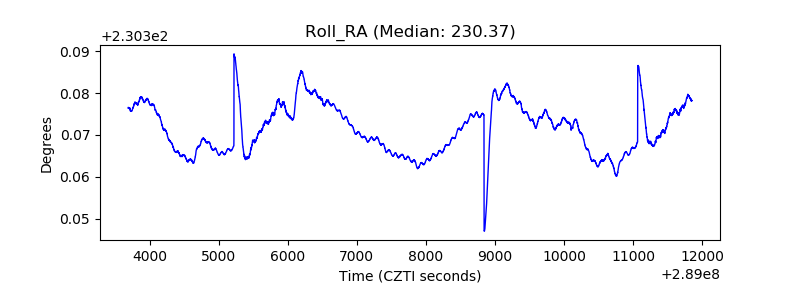 |
| Veto Counter |  |