| Param | Original file | Final file |
|---|---|---|
| Filename | modeM0/AS1A05_075T09_9000002740_18489cztM0_level2.evt | modeM0/AS1A05_075T09_9000002740_18489cztM0_level2_quad_clean.evt |
| Size (bytes) | 587,226,240 | 98,231,040 |
| Size | 560.0 MB | 93.7 MB |
| Events in quadrant A | 5,875,532 | 598,927 |
| Events in quadrant B | 3,754,995 | 638,721 |
| Events in quadrant C | 3,569,851 | 622,602 |
| Events in quadrant D | 4,087,277 | 604,693 |
| Mode M9 | |||
|---|---|---|---|
| Quadrant | BADHDUFLAG | Total packets | Discarded packets |
| A | 0 | 1 | 0 |
| B | 0 | 1 | 0 |
| C | 0 | 1 | 0 |
| D | 0 | 1 | 0 |
| Mode SS | |||
|---|---|---|---|
| Quadrant | BADHDUFLAG | Total packets | Discarded packets |
| A | 0 | 146 | 0 |
| B | 0 | 146 | 0 |
| C | 0 | 146 | 0 |
| D | 0 | 146 | 0 |
| Mode M0 | |||
|---|---|---|---|
| Quadrant | BADHDUFLAG | Total packets | Discarded packets |
| A | 0 | 22356 | 0 |
| B | 0 | 15862 | 0 |
| C | 0 | 15195 | 0 |
| D | 0 | 17207 | 0 |
| Quadrant | Total seconds | Saturated seconds | Saturation percentage |
|---|---|---|---|
| A | 7321 | 779 | 10.640623% |
| B | 7321 | 232 | 3.168966% |
| C | 7322 | 224 | 3.059273% |
| D | 7322 | 299 | 4.083584% |
Noise dominated data is calculated using 1-second bins in cleaned event files. If a bin has >2000 counts, and if more than 50% of those come from <1% of pixels, then it is considered to be noise-dominated and hence unusable.
| Quadrant | # 1 sec bins | Bins with >0 counts | Bins with >2000 counts | High rate bins dominated by noise | Noise dominated (total time) | Noise dominated (detector-on time) | Marked lightcurve |
|---|---|---|---|---|---|---|---|
| A | 7421 | 7321 | 453 | 453 | 6.10% | 6.19% | 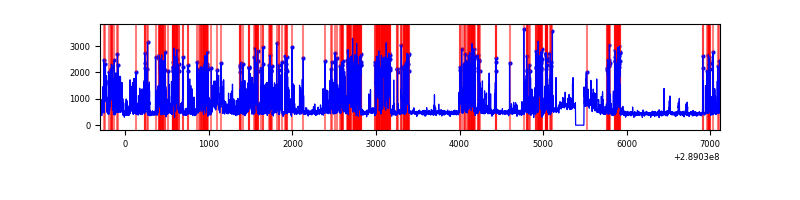 |
| B | 7421 | 7321 | 3 | 3 | 0.04% | 0.04% | 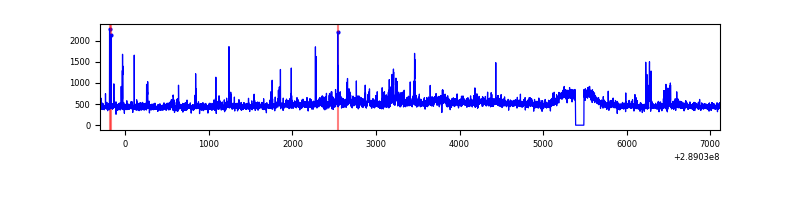 |
| C | 7422 | 7322 | 0 | 0 | 0.00% | 0.00% | 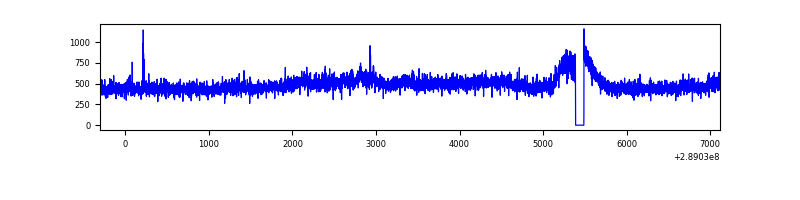 |
| D | 7422 | 7322 | 65 | 65 | 0.88% | 0.89% | 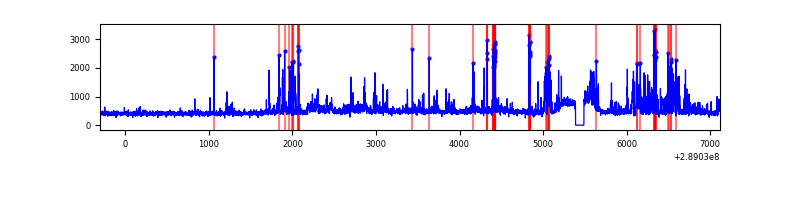 |
Top three noisy pixels from each quadrant. If the there are fewer than three noisy pixels in the level2.evt file, extra rows are filled as -1
| Pixel properties | Quadrant properties | ||||||
|---|---|---|---|---|---|---|---|
| Quadrant | DetID | PixID | Counts | Sigma | Mean | Median | Sigma |
| A | 0 | 13 | 2504138 | 14278.72 | 853 | 833 | 175.3 |
| A | 4 | 2 | 56075 | 315.1 | 853 | 833 | 175.3 |
| A | 15 | 174 | 24930 | 137.45 | 853 | 833 | 175.3 |
| B | 10 | 245 | 275224 | 1598.7 | 878 | 851 | 171.6 |
| B | 12 | 111 | 20797 | 116.22 | 878 | 851 | 171.6 |
| B | 7 | 220 | 20445 | 114.17 | 878 | 851 | 171.6 |
| C | 14 | 238 | 130580 | 651.18 | 844 | 847 | 199.2 |
| C | 3 | 233 | 122440 | 610.32 | 844 | 847 | 199.2 |
| C | 8 | 128 | 10689 | 49.4 | 844 | 847 | 199.2 |
| D | 1 | 52 | 633889 | 3025.71 | 854 | 826 | 209.2 |
| D | 7 | 238 | 174673 | 830.9 | 854 | 826 | 209.2 |
| D | 2 | 234 | 33653 | 156.9 | 854 | 826 | 209.2 |
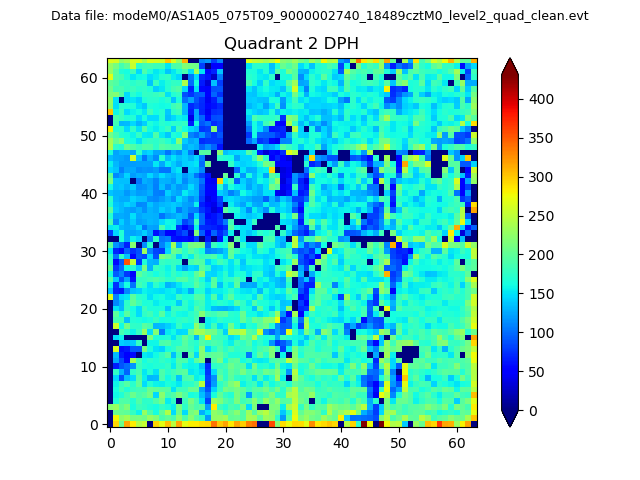
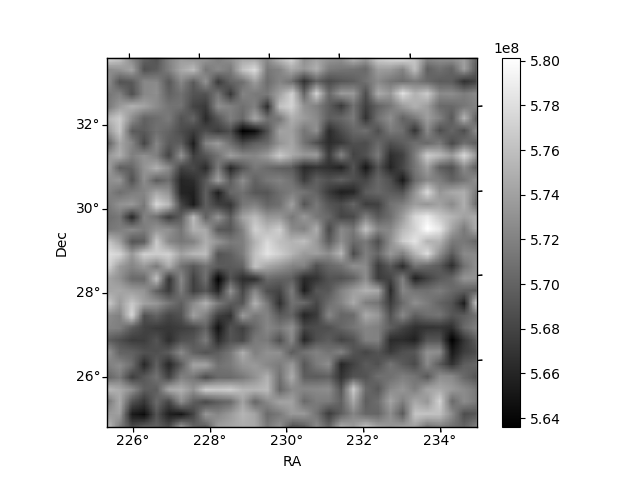
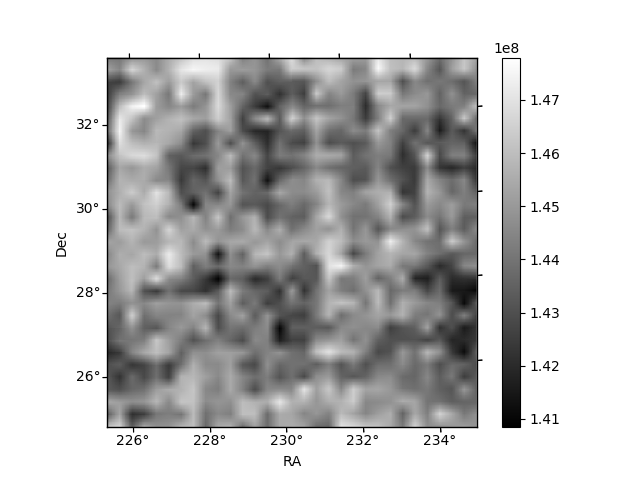
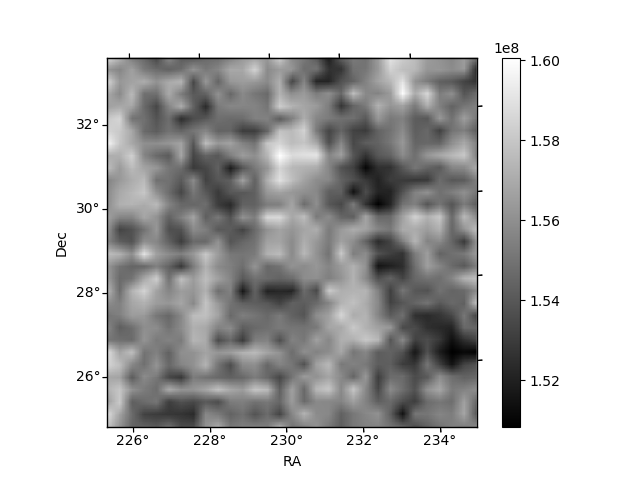
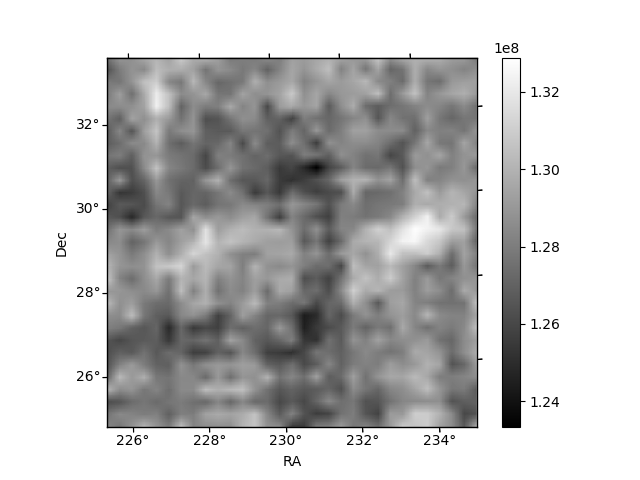
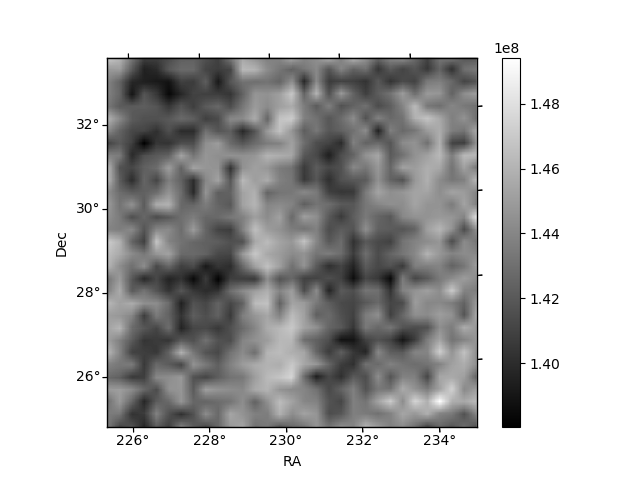
Histogram calculated using DETX and DETY for each event in the final _common_clean file
| Quadrant A | 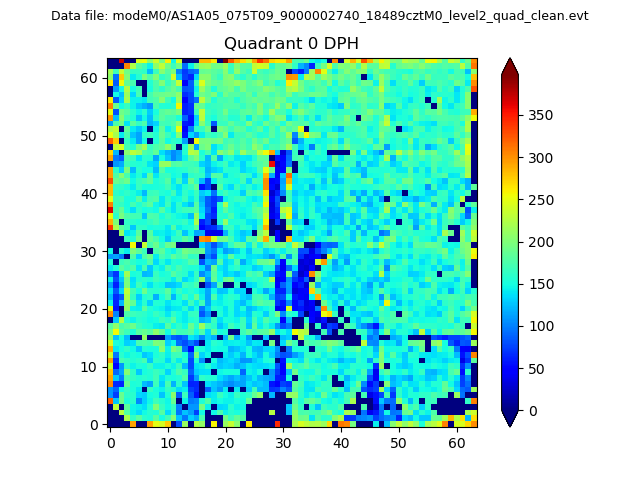 |
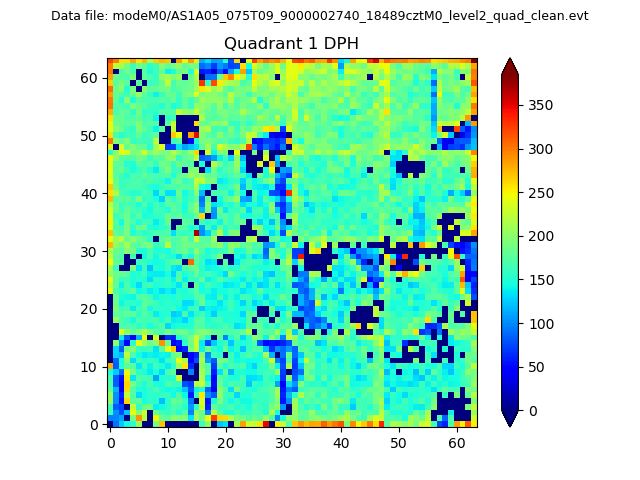 |
Quadrant B |
|---|---|---|---|
| Quadrant D | 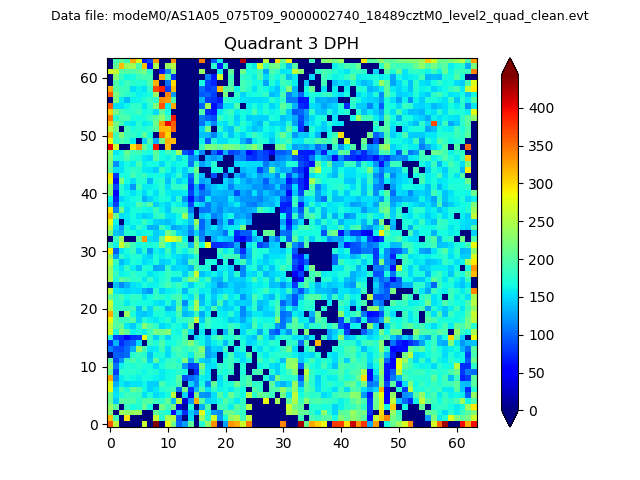 |
 |
Quadrant C |
| Plot type | Count rate plots | Images |
|---|---|---|
| Comparison with Poisson distribution Blue bars denote a histogram of data divided into 1 sec bins. Red curve is a Poisson curve with rate = median count rate of data. |
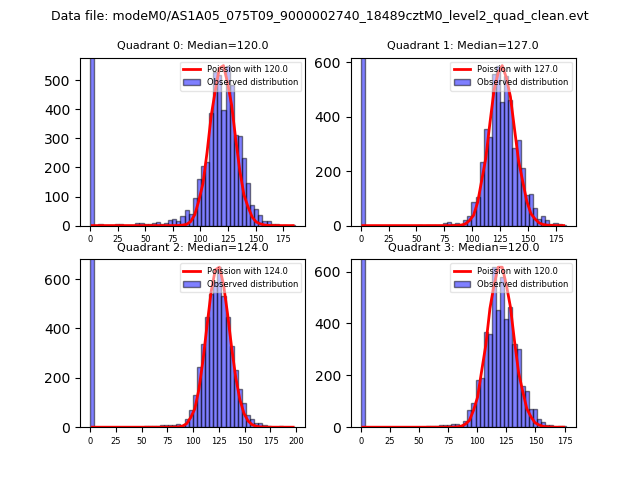 |
 |
| Quadrant-wise count rates Data is divided into 100 sec bins |
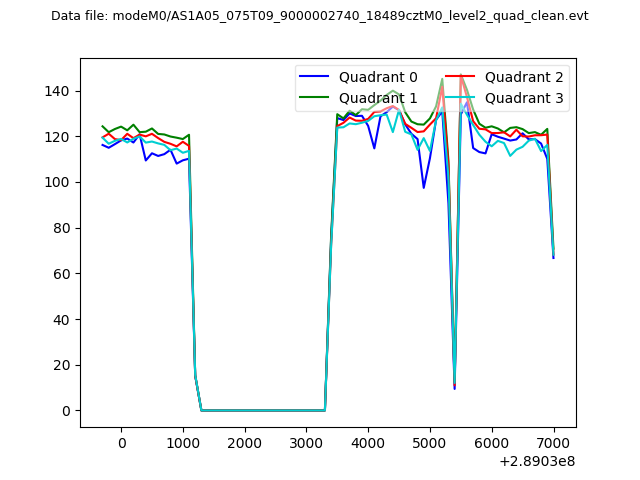 |
|
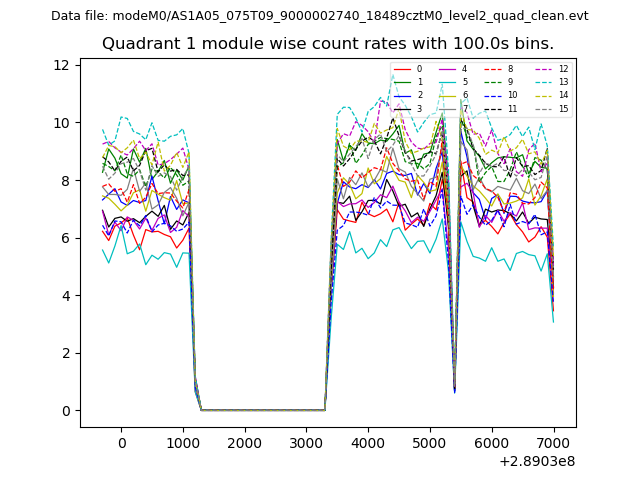
| Module-wise count rates for Quadrant A Data is divided into 100 sec bins |
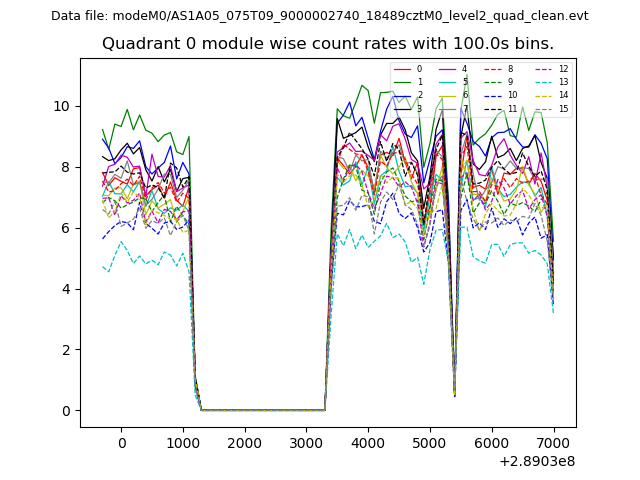 |
 |
| Module-wise count rates for Quadrant B Data is divided into 100 sec bins |
 |
 |
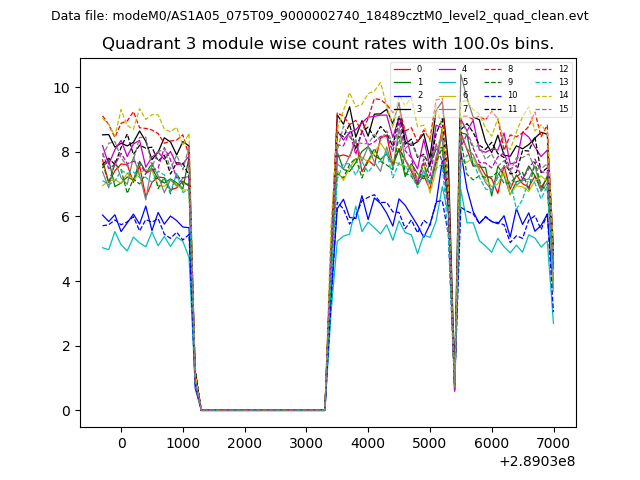
| Module-wise count rates for Quadrant C Data is divided into 100 sec bins |
 |
 |
| Module-wise count rates for Quadrant D Data is divided into 100 sec bins |
 |
 |
| Parameter | Plot |
|---|---|
| CZT HV Monitor | 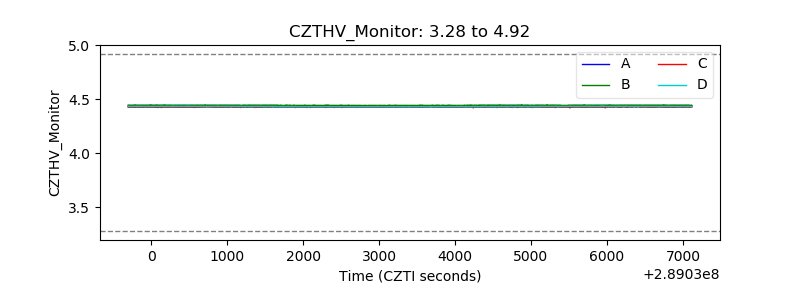 |
| D_VDD | 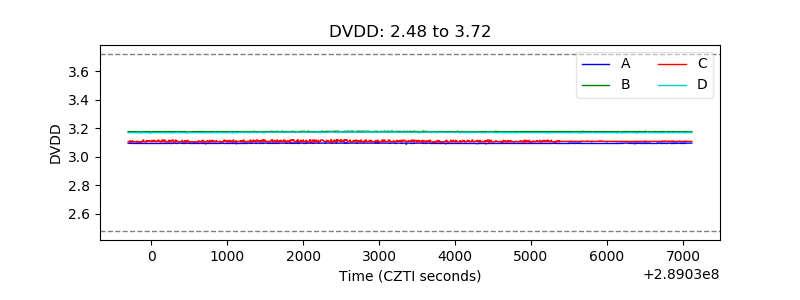 |
| Temperature 1 | 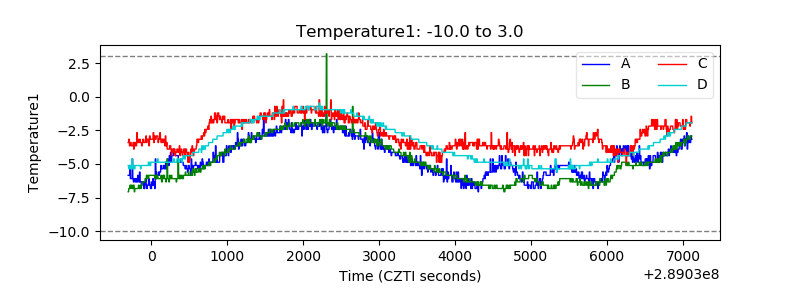 |
| Veto HV Monitor | 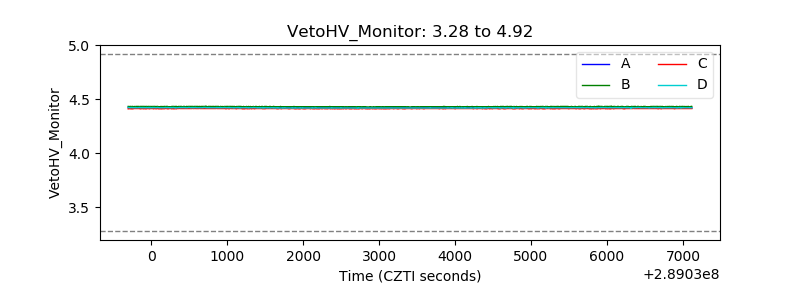 |
| Veto LLD | 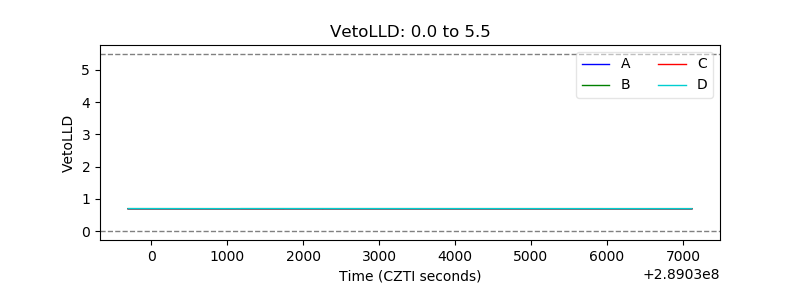 |
| Alpha Counter | 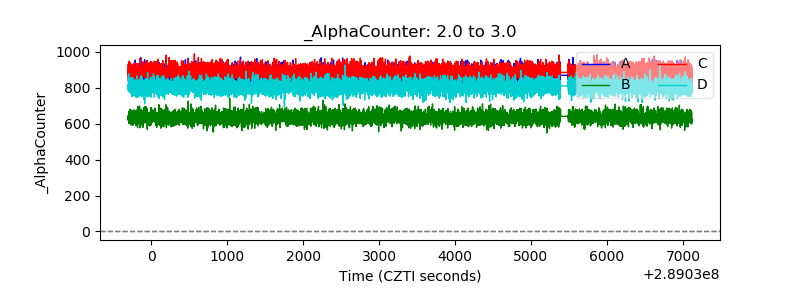 |
| _CPM_Rate | 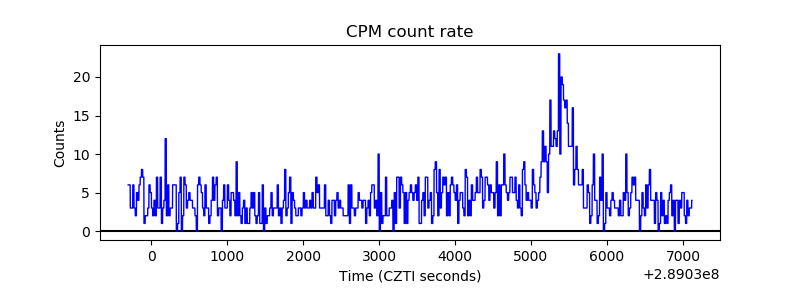 |
| CZT Counter | 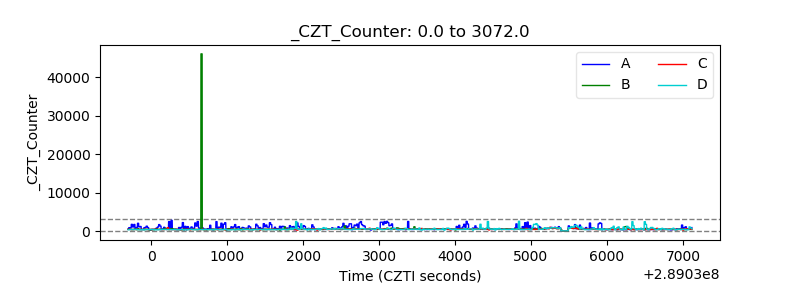 |
| +2.5 Volts monitor |  |
| +5 Volts monitor |  |
| _ROLL_ROT | 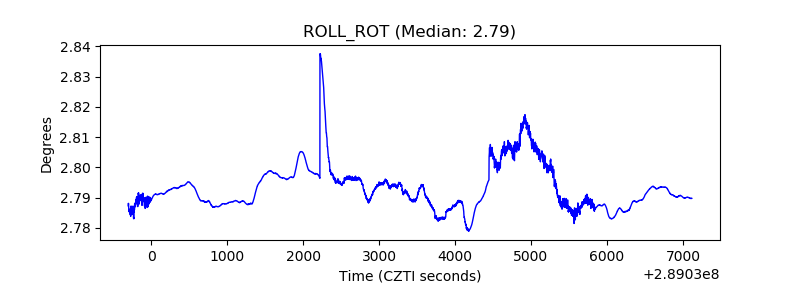 |
| _Roll_DEC | 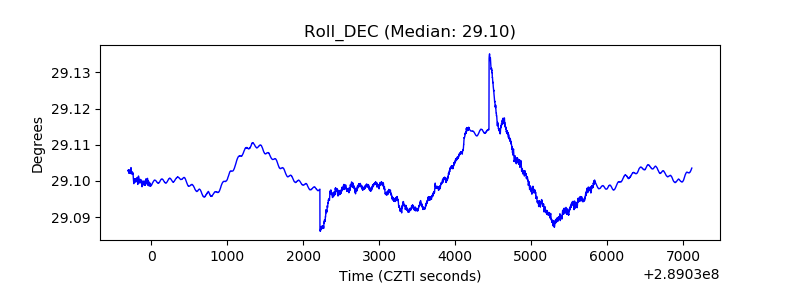 |
| _Roll_RA | 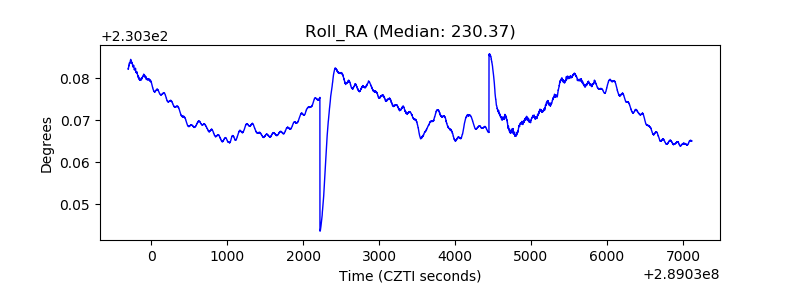 |
| Veto Counter | 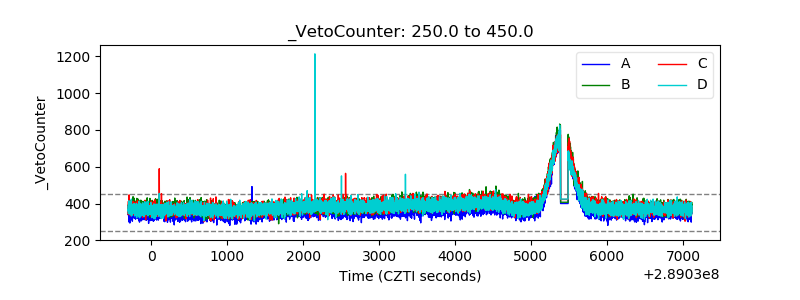 |