| Param | Original file | Final file |
|---|---|---|
| Filename | modeM0/AS1A05_075T09_9000002740_18492cztM0_level2.evt | modeM0/AS1A05_075T09_9000002740_18492cztM0_level2_quad_clean.evt |
| Size (bytes) | 439,358,400 | 61,634,880 |
| Size | 419.0 MB | 58.8 MB |
| Events in quadrant A | 3,493,982 | 370,254 |
| Events in quadrant B | 3,158,626 | 385,657 |
| Events in quadrant C | 2,954,721 | 376,032 |
| Events in quadrant D | 3,341,441 | 365,853 |
| Mode SS | |||
|---|---|---|---|
| Quadrant | BADHDUFLAG | Total packets | Discarded packets |
| A | 0 | 106 | 0 |
| B | 0 | 106 | 0 |
| C | 0 | 106 | 0 |
| D | 0 | 106 | 0 |
| Mode M0 | |||
|---|---|---|---|
| Quadrant | BADHDUFLAG | Total packets | Discarded packets |
| A | 0 | 13852 | 0 |
| B | 0 | 12708 | 0 |
| C | 0 | 12152 | 0 |
| D | 0 | 13481 | 0 |
| Quadrant | Total seconds | Saturated seconds | Saturation percentage |
|---|---|---|---|
| A | 5255 | 268 | 5.099905% |
| B | 5255 | 278 | 5.290200% |
| C | 5256 | 35 | 0.665906% |
| D | 5256 | 121 | 2.302131% |
Noise dominated data is calculated using 1-second bins in cleaned event files. If a bin has >2000 counts, and if more than 50% of those come from <1% of pixels, then it is considered to be noise-dominated and hence unusable.
| Quadrant | # 1 sec bins | Bins with >0 counts | Bins with >2000 counts | High rate bins dominated by noise | Noise dominated (total time) | Noise dominated (detector-on time) | Marked lightcurve |
|---|---|---|---|---|---|---|---|
| A | 5255 | 5255 | 234 | 234 | 4.45% | 4.45% | 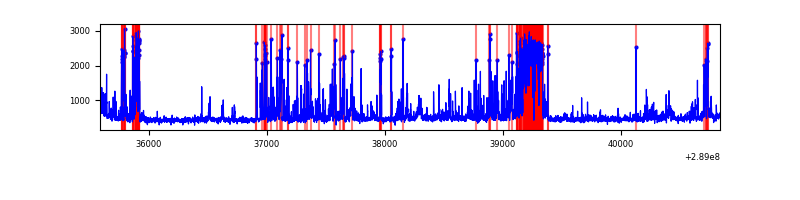 |
| B | 5255 | 5255 | 253 | 253 | 4.81% | 4.81% | 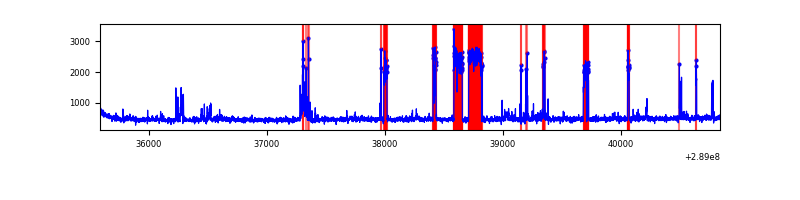 |
| C | 5256 | 5256 | 0 | 0 | 0.00% | 0.00% | 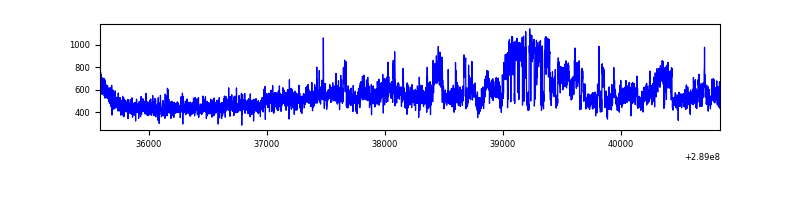 |
| D | 5256 | 5256 | 111 | 111 | 2.11% | 2.11% | 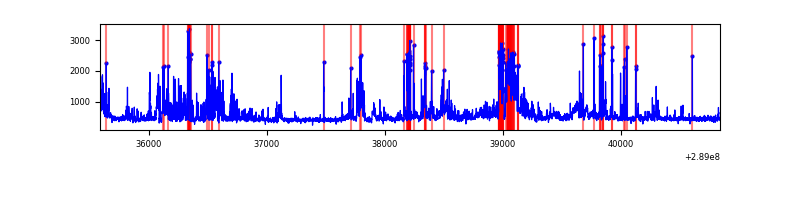 |
Top three noisy pixels from each quadrant. If the there are fewer than three noisy pixels in the level2.evt file, extra rows are filled as -1
| Pixel properties | Quadrant properties | ||||||
|---|---|---|---|---|---|---|---|
| Quadrant | DetID | PixID | Counts | Sigma | Mean | Median | Sigma |
| A | 0 | 13 | 1043089 | 8362.89 | 605 | 590 | 124.7 |
| A | 4 | 2 | 93241 | 743.24 | 605 | 590 | 124.7 |
| A | 5 | 98 | 19811 | 154.19 | 605 | 590 | 124.7 |
| B | 10 | 245 | 731226 | 6200.63 | 604 | 589 | 117.8 |
| B | 7 | 220 | 28291 | 235.1 | 604 | 589 | 117.8 |
| B | 0 | 197 | 18647 | 153.25 | 604 | 589 | 117.8 |
| C | 3 | 233 | 542969 | 3897.13 | 593 | 596 | 139.2 |
| C | 14 | 238 | 92899 | 663.23 | 593 | 596 | 139.2 |
| C | 0 | 207 | 5236 | 33.34 | 593 | 596 | 139.2 |
| D | 1 | 52 | 581705 | 3958.55 | 597 | 580 | 146.8 |
| D | 7 | 238 | 455326 | 3097.67 | 597 | 580 | 146.8 |
| D | 7 | 38 | 25134 | 167.26 | 597 | 580 | 146.8 |
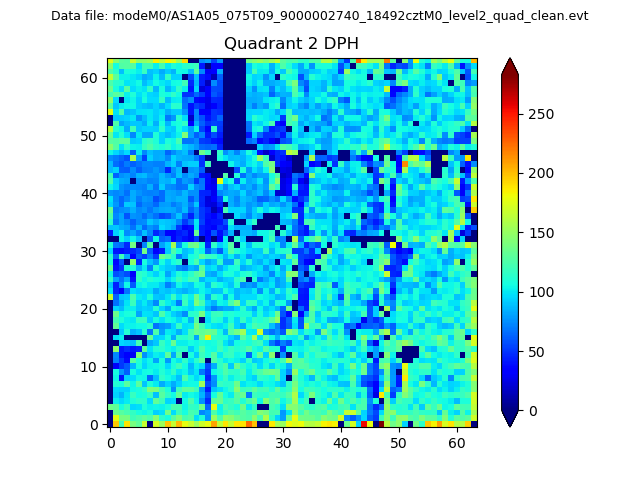
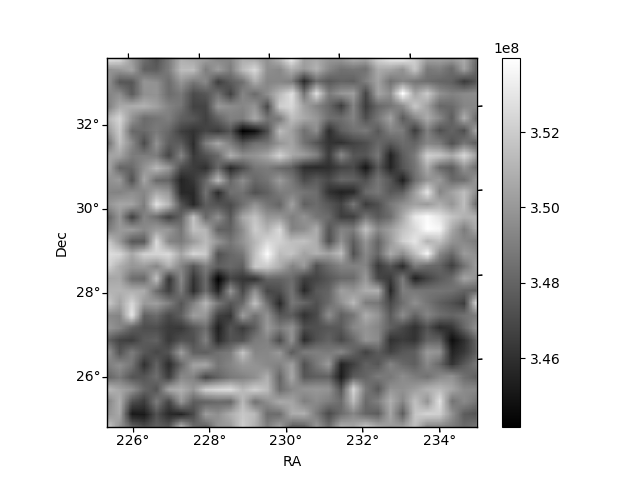
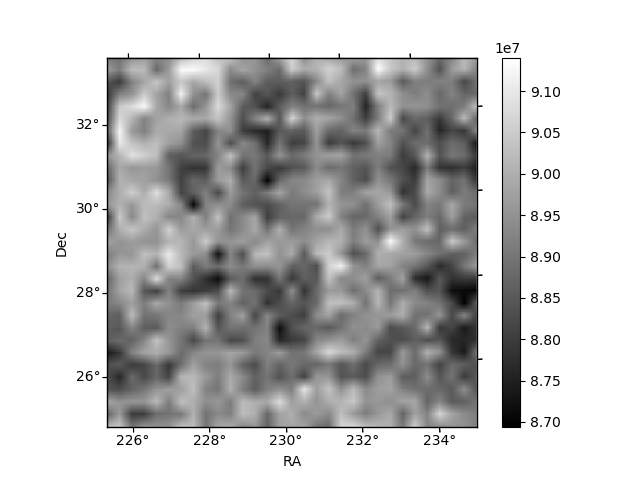
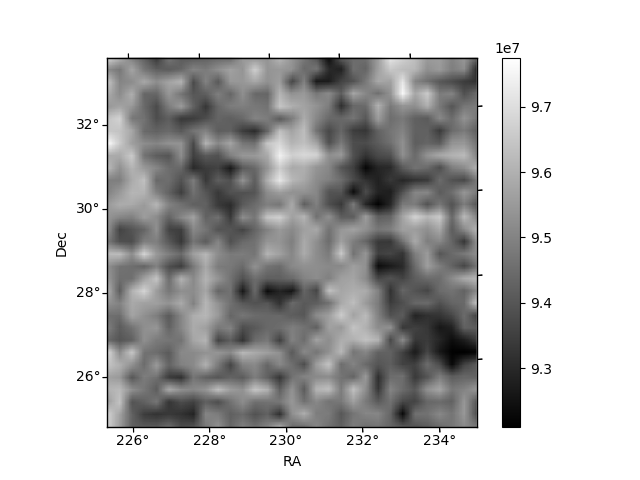
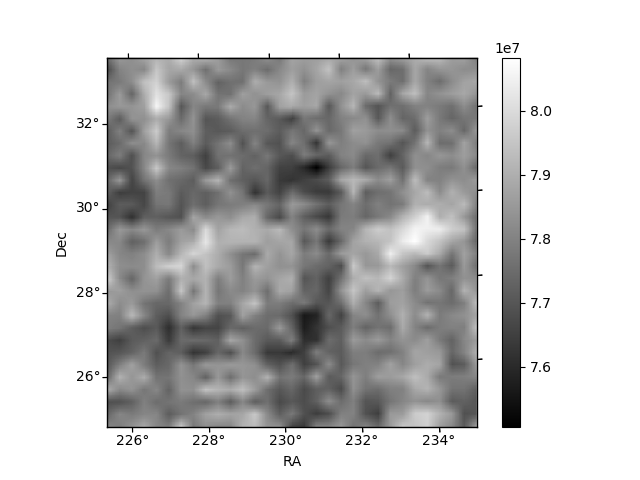
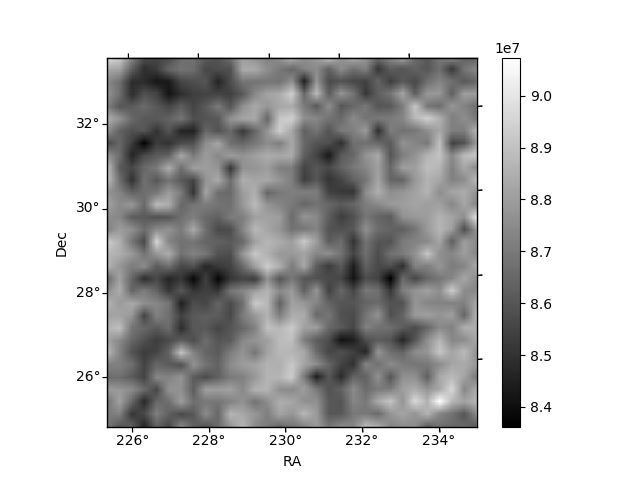
Histogram calculated using DETX and DETY for each event in the final _common_clean file
| Quadrant A | 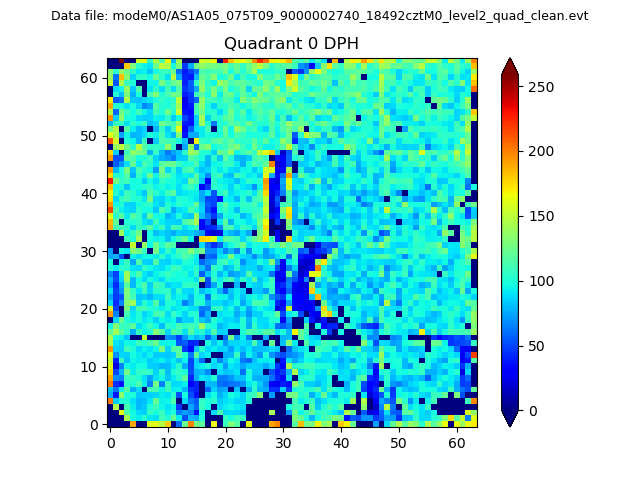 |
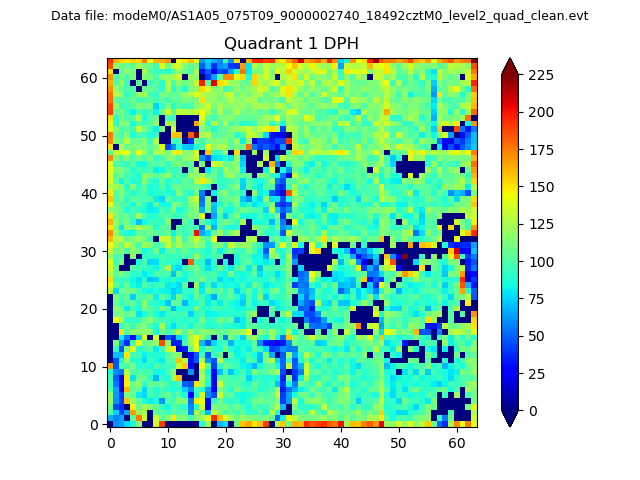 |
Quadrant B |
|---|---|---|---|
| Quadrant D | 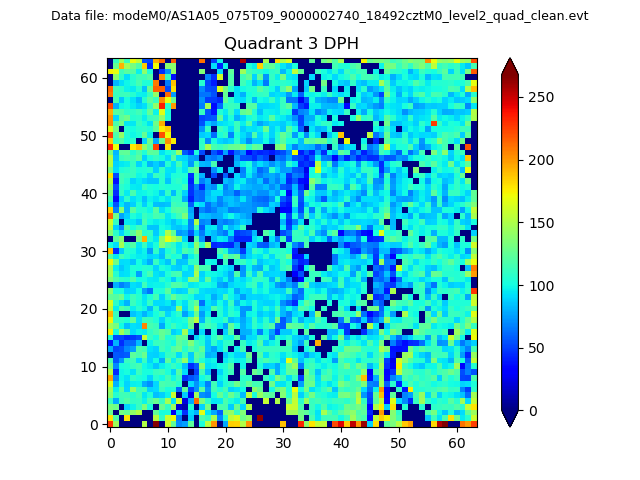 |
 |
Quadrant C |
| Plot type | Count rate plots | Images |
|---|---|---|
| Comparison with Poisson distribution Blue bars denote a histogram of data divided into 1 sec bins. Red curve is a Poisson curve with rate = median count rate of data. |
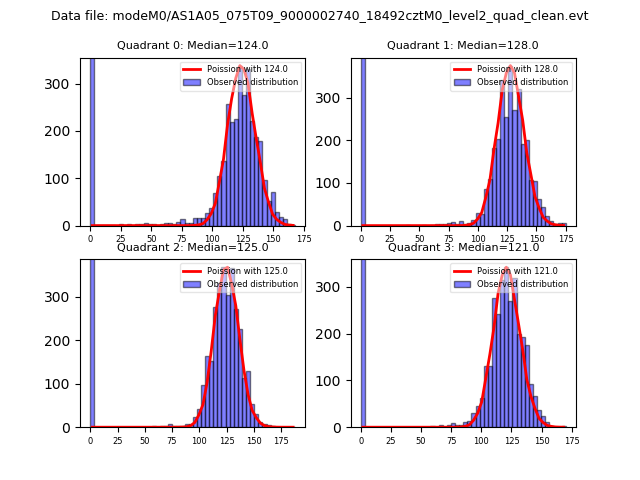 |
 |
| Quadrant-wise count rates Data is divided into 100 sec bins |
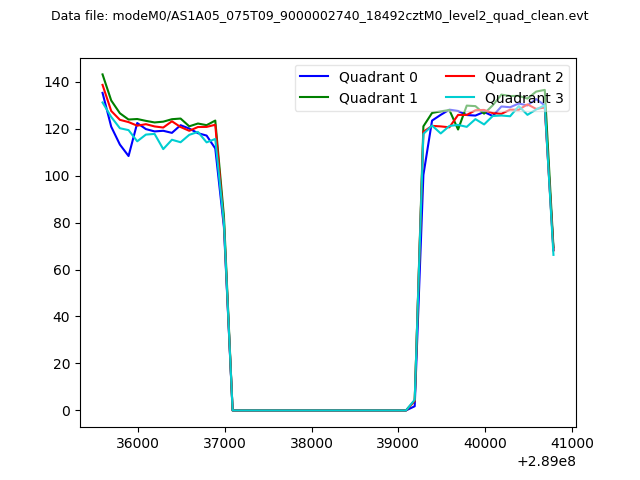 |
|
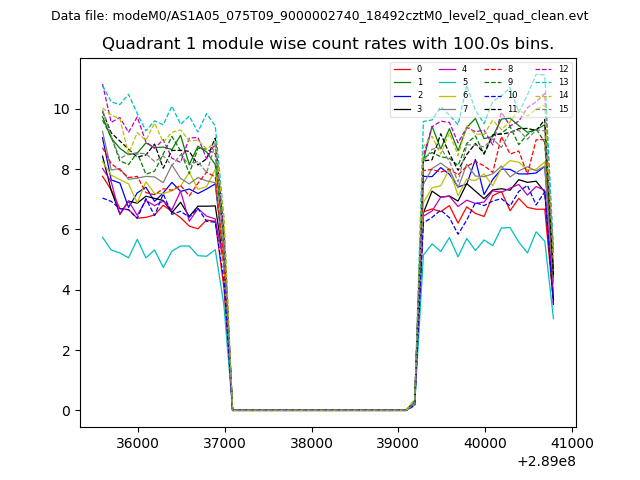
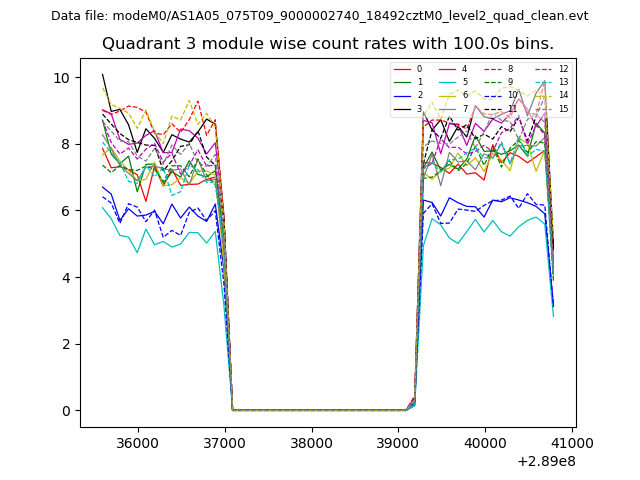
| Module-wise count rates for Quadrant A Data is divided into 100 sec bins |
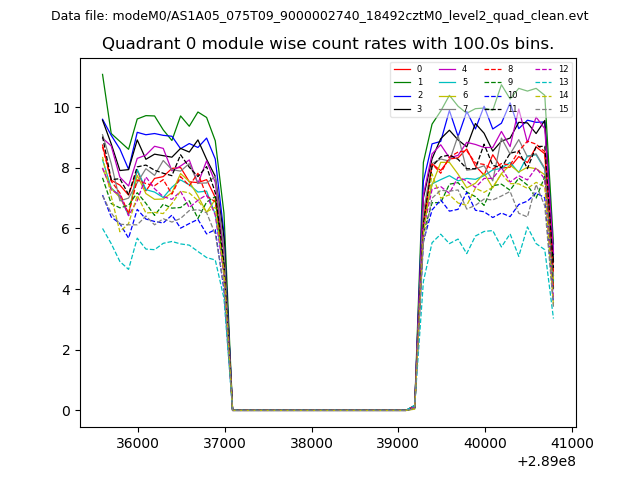 |
 |
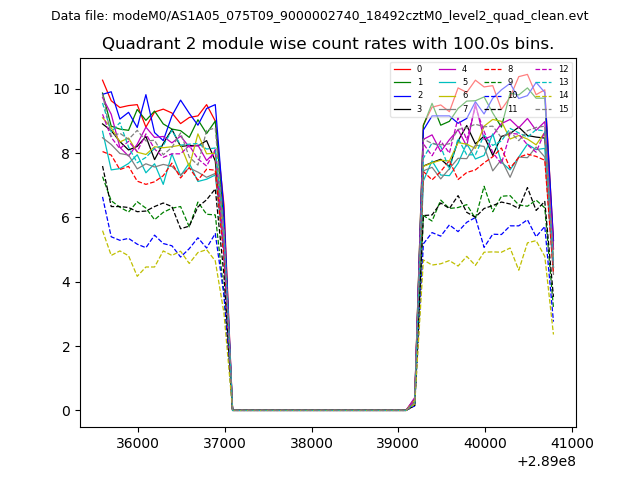
| Module-wise count rates for Quadrant B Data is divided into 100 sec bins |
 |
 |
| Module-wise count rates for Quadrant C Data is divided into 100 sec bins |
 |
 |
| Module-wise count rates for Quadrant D Data is divided into 100 sec bins |
 |
 |
| Parameter | Plot |
|---|---|
| CZT HV Monitor | 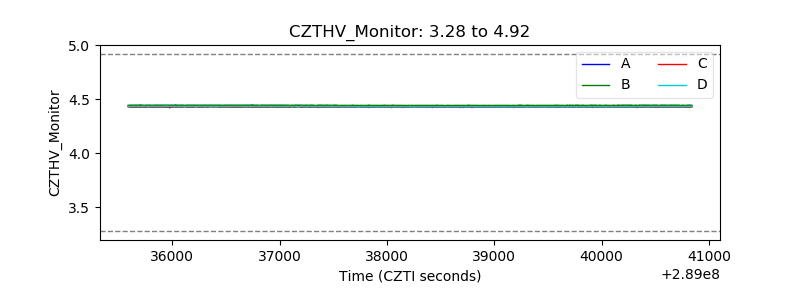 |
| D_VDD | 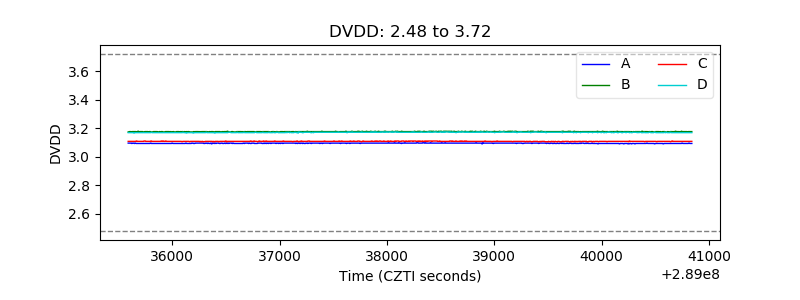 |
| Temperature 1 | 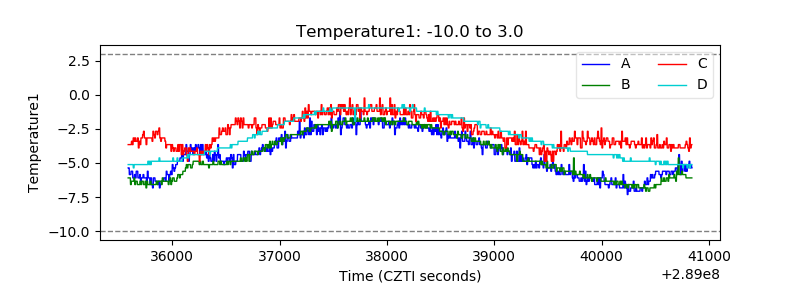 |
| Veto HV Monitor | 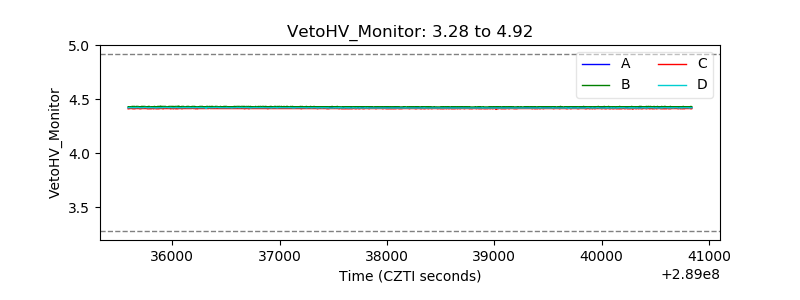 |
| Veto LLD | 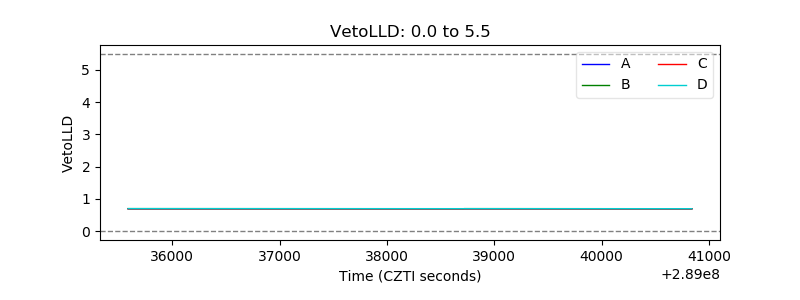 |
| Alpha Counter | 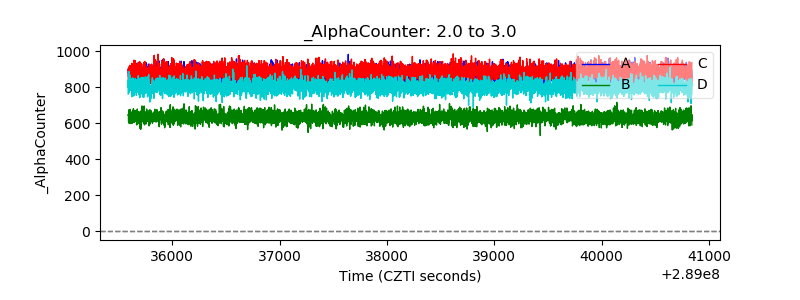 |
| _CPM_Rate | 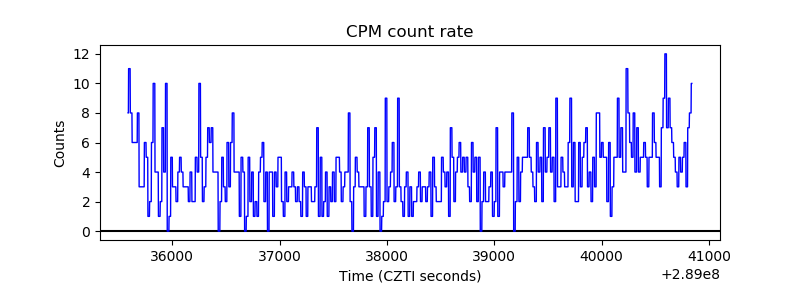 |
| CZT Counter |  |
| +2.5 Volts monitor | 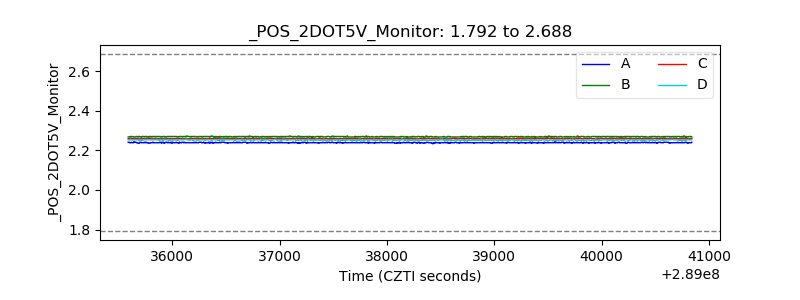 |
| +5 Volts monitor |  |
| _ROLL_ROT | 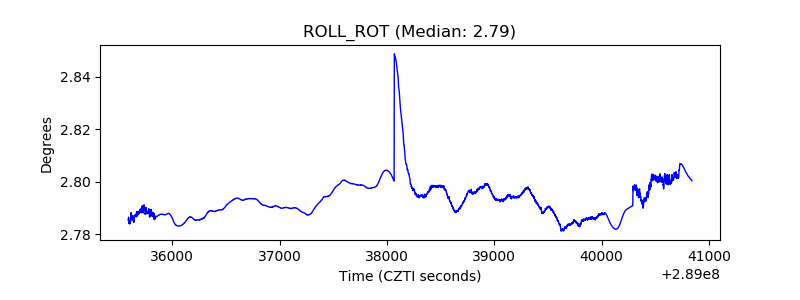 |
| _Roll_DEC | 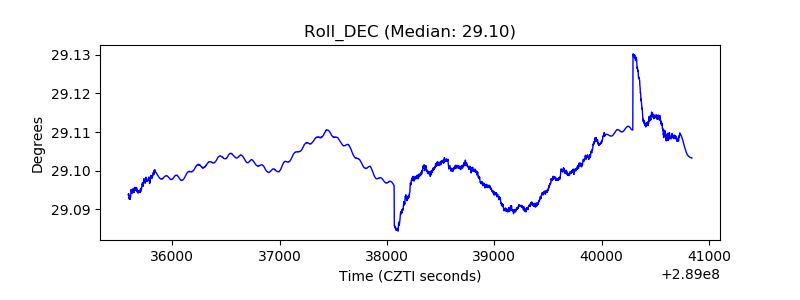 |
| _Roll_RA | 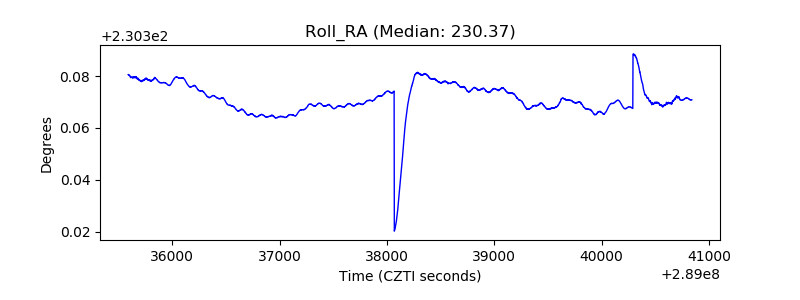 |
| Veto Counter |  |