| Param | Original file | Final file |
|---|---|---|
| Filename | modeM0/AS1A05_082T12_9000002738cztM0_level2.fits | modeM0/AS1A05_082T12_9000002738cztM0_level2_quad_clean.evt |
| Size (bytes) | 189,164,160 | 180,648,000 |
| Size | 180.4 MB | 172.3 MB |
| Events in quadrant A | 1,152,176 | 1,061,881 |
| Events in quadrant B | 1,085,692 | 1,059,879 |
| Events in quadrant C | 1,130,832 | 1,024,217 |
| Events in quadrant D | 996,110 | 960,640 |
| Mode M9 | |||
|---|---|---|---|
| Quadrant | BADHDUFLAG | Total packets | Discarded packets |
| A | 0 | 33 | 0 |
| B | 0 | 33 | 0 |
| C | 0 | 33 | 0 |
| D | 0 | 33 | 0 |
| Mode SS | |||
|---|---|---|---|
| Quadrant | BADHDUFLAG | Total packets | Discarded packets |
| A | 0 | 404 | 0 |
| B | 0 | 404 | 0 |
| C | 0 | 404 | 0 |
| D | 0 | 404 | 0 |
| Mode M0 | |||
|---|---|---|---|
| Quadrant | BADHDUFLAG | Total packets | Discarded packets |
| A | 0 | 41320 | 0 |
| B | 0 | 48785 | 0 |
| C | 0 | 46624 | 0 |
| D | 0 | 44132 | 0 |
| Quadrant | Total seconds | Saturated seconds | Saturation percentage |
|---|---|---|---|
| A | 19802 | 205 | 1.035249% |
| B | 19802 | 809 | 4.085446% |
| C | 19802 | 343 | 1.732148% |
| D | 19802 | 266 | 1.343299% |
Noise dominated data is calculated using 1-second bins in cleaned event files. If a bin has >2000 counts, and if more than 50% of those come from <1% of pixels, then it is considered to be noise-dominated and hence unusable.
| Quadrant | # 1 sec bins | Bins with >0 counts | Bins with >2000 counts | High rate bins dominated by noise | Noise dominated (total time) | Noise dominated (detector-on time) | Marked lightcurve |
|---|---|---|---|---|---|---|---|
| A | 23052 | 19798 | 0 | 0 | 0.00% | 0.00% |  |
| B | 23052 | 19797 | 0 | 0 | 0.00% | 0.00% |  |
| C | 23051 | 19797 | 0 | 0 | 0.00% | 0.00% | 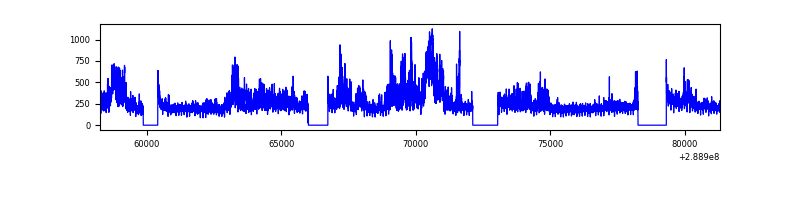 |
| D | 23052 | 19798 | 0 | 0 | 0.00% | 0.00% |  |
Top three noisy pixels from each quadrant. If the there are fewer than three noisy pixels in the level2.evt file, extra rows are filled as -1
| Pixel properties | Quadrant properties | ||||||
|---|---|---|---|---|---|---|---|
| Quadrant | DetID | PixID | Counts | Sigma | Mean | Median | Sigma |
| A | 0 | 29 | 972 | 8.97 | 299 | 280 | 77.2 |
| A | 7 | 110 | 933 | 8.46 | 299 | 280 | 77.2 |
| A | 9 | 19 | 893 | 7.94 | 299 | 280 | 77.2 |
| B | 2 | 9 | 864 | 10.01 | 286 | 272 | 59.2 |
| B | 3 | 17 | 745 | 7.99 | 286 | 272 | 59.2 |
| B | 5 | 255 | 732 | 7.77 | 286 | 272 | 59.2 |
| C | 1 | 80 | 822 | 6.9 | 298 | 277 | 78.9 |
| C | 12 | 241 | 802 | 6.65 | 298 | 277 | 78.9 |
| C | 2 | 191 | 780 | 6.37 | 298 | 277 | 78.9 |
| D | 3 | 14 | 761 | 6.49 | 283 | 257 | 77.6 |
| D | 15 | 46 | 721 | 5.98 | 283 | 257 | 77.6 |
| D | 6 | 231 | 717 | 5.93 | 283 | 257 | 77.6 |
Histogram calculated using DETX and DETY for each event in the final _common_clean file
| Quadrant A |  |
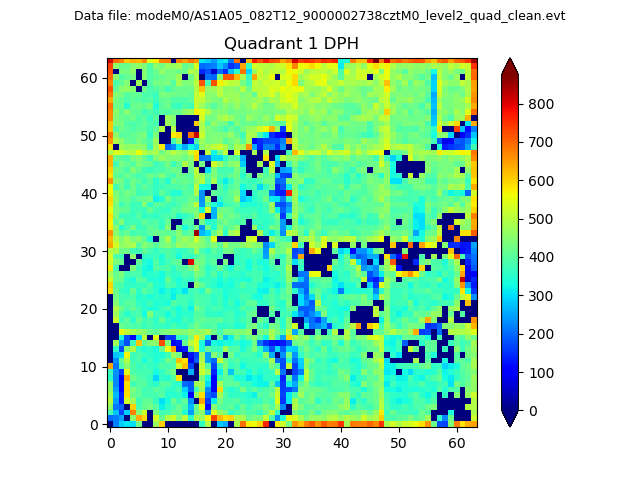 |
Quadrant B |
|---|---|---|---|
| Quadrant D |  |
 |
Quadrant C |
| Plot type | Count rate plots | Images |
|---|---|---|
| Comparison with Poisson distribution Blue bars denote a histogram of data divided into 1 sec bins. Red curve is a Poisson curve with rate = median count rate of data. |
 |
 |
| Quadrant-wise count rates Data is divided into 100 sec bins |
 |
|
| Module-wise count rates for Quadrant A Data is divided into 100 sec bins |
 |
 |
| Module-wise count rates for Quadrant B Data is divided into 100 sec bins |
 |
 |
| Module-wise count rates for Quadrant C Data is divided into 100 sec bins |
 |
 |
| Module-wise count rates for Quadrant D Data is divided into 100 sec bins |
 |
 |
| Parameter | Plot |
|---|---|
| CZT HV Monitor |  |
| D_VDD | 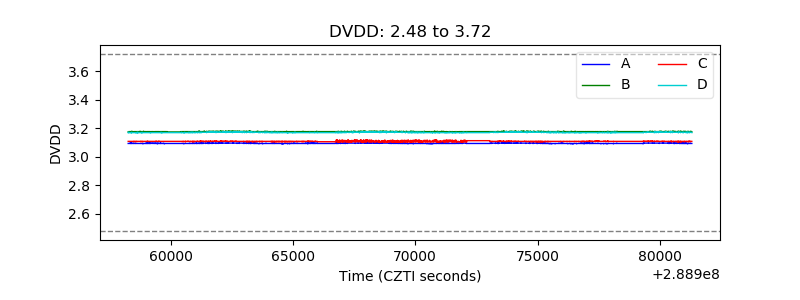 |
| Temperature 1 |  |
| Veto HV Monitor |  |
| Veto LLD |  |
| Alpha Counter |  |
| _CPM_Rate |  |
| CZT Counter |  |
| +2.5 Volts monitor |  |
| +5 Volts monitor |  |
| _ROLL_ROT |  |
| _Roll_DEC |  |
| _Roll_RA | 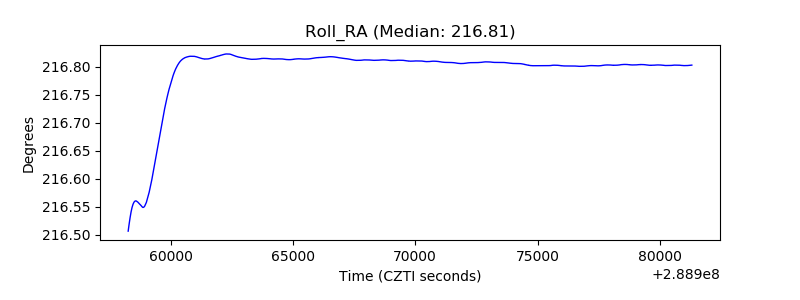 |
| Veto Counter |  |