| Param | Original file | Final file |
|---|---|---|
| Filename | modeM0/AS1A05_082T12_9000002738_18477cztM0_level2.evt | modeM0/AS1A05_082T12_9000002738_18477cztM0_level2_quad_clean.evt |
| Size (bytes) | 634,593,600 | 100,941,120 |
| Size | 605.2 MB | 96.3 MB |
| Events in quadrant A | 4,200,629 | 615,410 |
| Events in quadrant B | 5,111,054 | 626,173 |
| Events in quadrant C | 4,965,133 | 605,446 |
| Events in quadrant D | 4,348,048 | 601,673 |
| Mode M9 | |||
|---|---|---|---|
| Quadrant | BADHDUFLAG | Total packets | Discarded packets |
| A | 0 | 13 | 0 |
| B | 0 | 13 | 0 |
| C | 0 | 13 | 0 |
| D | 0 | 13 | 0 |
| Mode SS | |||
|---|---|---|---|
| Quadrant | BADHDUFLAG | Total packets | Discarded packets |
| A | 0 | 178 | 0 |
| B | 0 | 178 | 0 |
| C | 0 | 178 | 0 |
| D | 0 | 178 | 0 |
| Mode M0 | |||
|---|---|---|---|
| Quadrant | BADHDUFLAG | Total packets | Discarded packets |
| A | 0 | 18085 | 2 |
| B | 0 | 20761 | 7 |
| C | 0 | 20290 | 2 |
| D | 0 | 18744 | 2 |
| Quadrant | Total seconds | Saturated seconds | Saturation percentage |
|---|---|---|---|
| A | 8762 | 136 | 1.552157% |
| B | 8761 | 336 | 3.835179% |
| C | 8761 | 180 | 2.054560% |
| D | 8761 | 130 | 1.483849% |
Noise dominated data is calculated using 1-second bins in cleaned event files. If a bin has >2000 counts, and if more than 50% of those come from <1% of pixels, then it is considered to be noise-dominated and hence unusable.
| Quadrant | # 1 sec bins | Bins with >0 counts | Bins with >2000 counts | High rate bins dominated by noise | Noise dominated (total time) | Noise dominated (detector-on time) | Marked lightcurve |
|---|---|---|---|---|---|---|---|
| A | 10027 | 8762 | 1 | 1 | 0.01% | 0.01% | 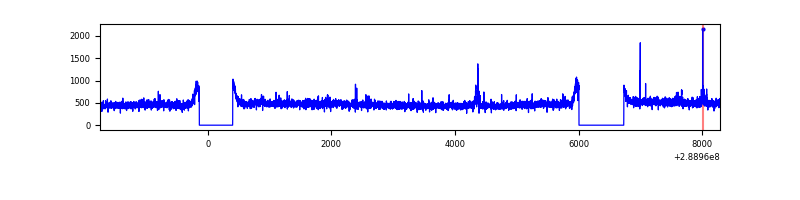 |
| B | 10025 | 8760 | 141 | 141 | 1.41% | 1.61% | 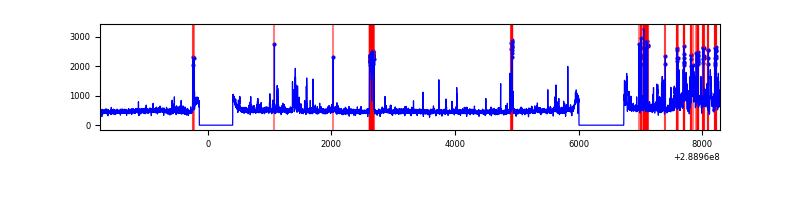 |
| C | 10026 | 8761 | 0 | 0 | 0.00% | 0.00% | 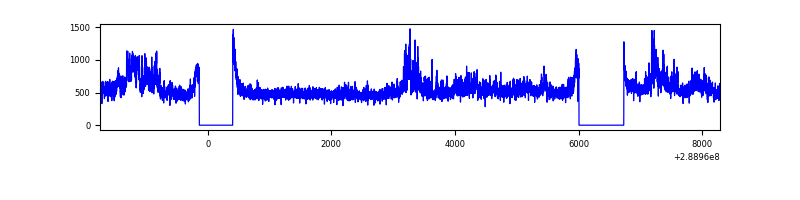 |
| D | 10026 | 8761 | 17 | 17 | 0.17% | 0.19% | 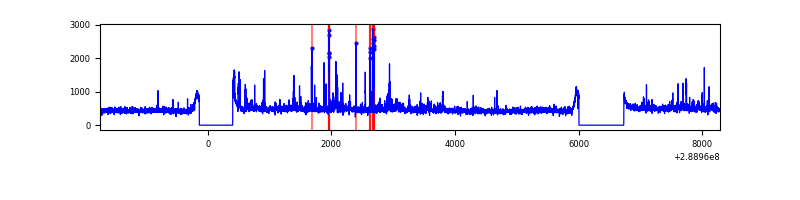 |
Top three noisy pixels from each quadrant. If the there are fewer than three noisy pixels in the level2.evt file, extra rows are filled as -1
| Pixel properties | Quadrant properties | ||||||
|---|---|---|---|---|---|---|---|
| Quadrant | DetID | PixID | Counts | Sigma | Mean | Median | Sigma |
| A | 15 | 174 | 67378 | 303.44 | 1070 | 1046 | 218.6 |
| A | 4 | 2 | 10431 | 42.93 | 1070 | 1046 | 218.6 |
| A | 0 | 226 | 9430 | 38.35 | 1070 | 1046 | 218.6 |
| B | 10 | 245 | 647368 | 3124.06 | 1062 | 1030 | 206.9 |
| B | 12 | 18 | 132044 | 633.25 | 1062 | 1030 | 206.9 |
| B | 15 | 222 | 81633 | 389.59 | 1062 | 1030 | 206.9 |
| C | 3 | 233 | 786129 | 3216.11 | 1030 | 1034 | 244.1 |
| C | 14 | 238 | 158423 | 644.74 | 1030 | 1034 | 244.1 |
| C | 13 | 61 | 7220 | 25.34 | 1030 | 1034 | 244.1 |
| D | 7 | 38 | 131484 | 509.34 | 1049 | 1020 | 256.1 |
| D | 1 | 52 | 86607 | 334.14 | 1049 | 1020 | 256.1 |
| D | 13 | 168 | 45668 | 174.31 | 1049 | 1020 | 256.1 |
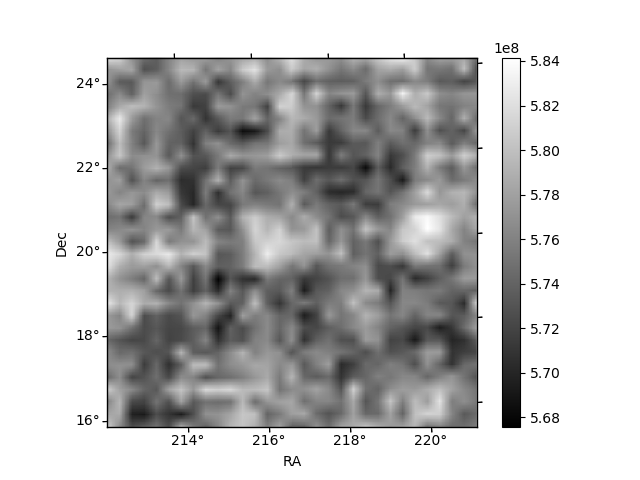
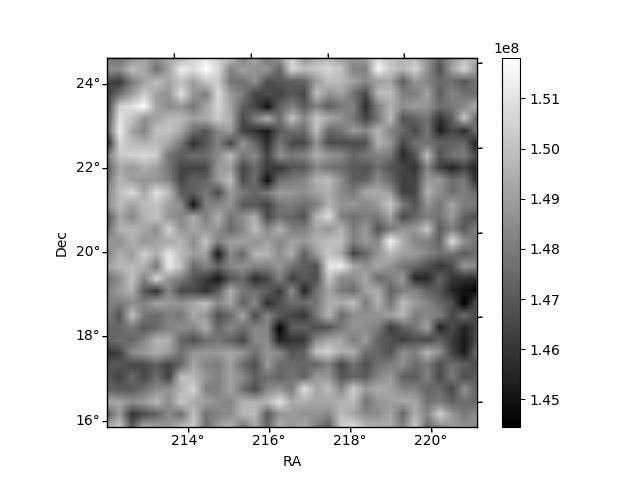
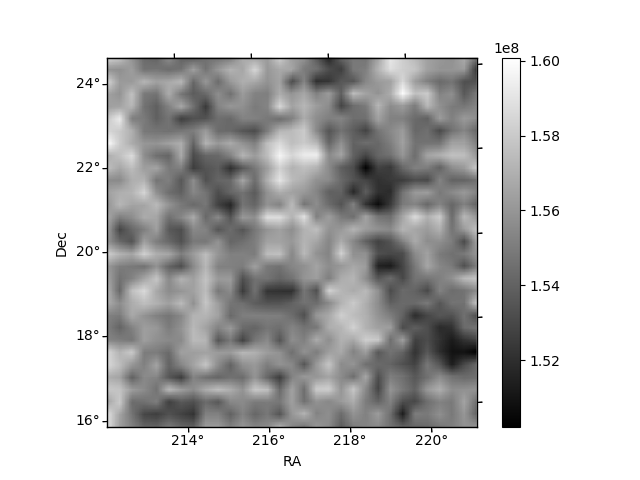
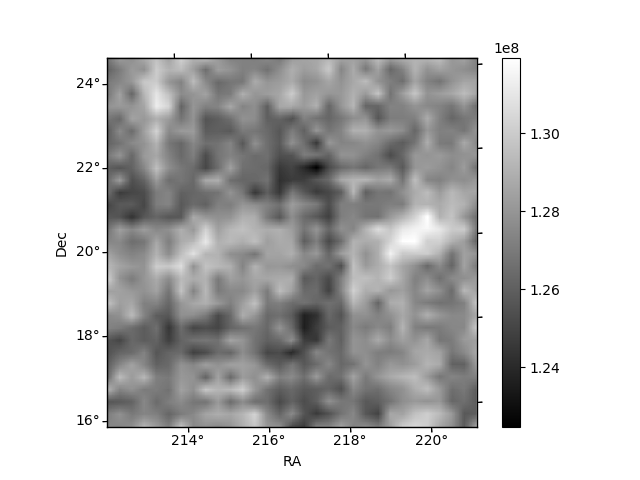
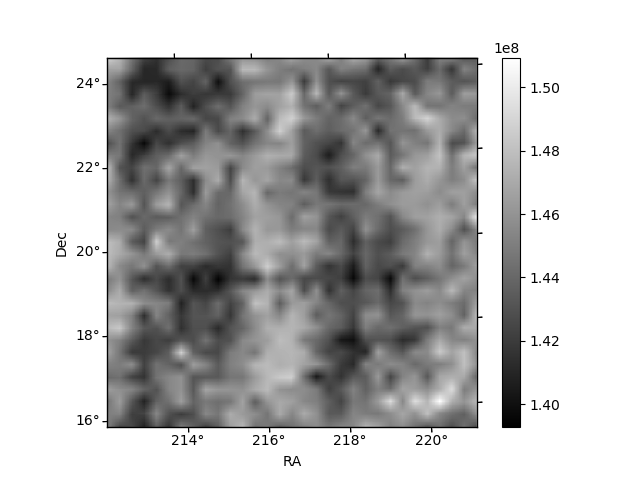
Histogram calculated using DETX and DETY for each event in the final _common_clean file
| Quadrant A | 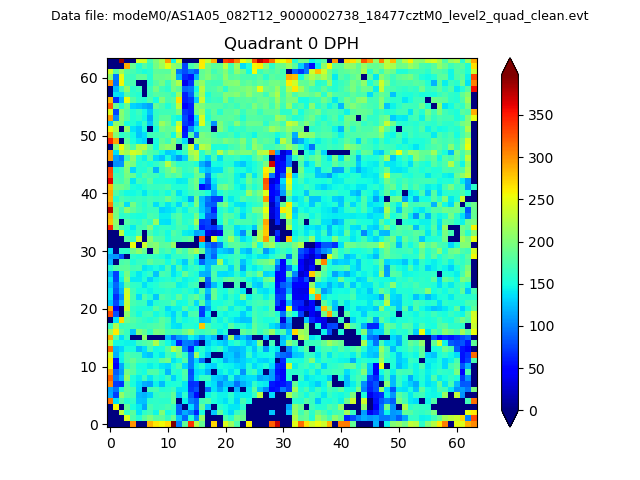 |
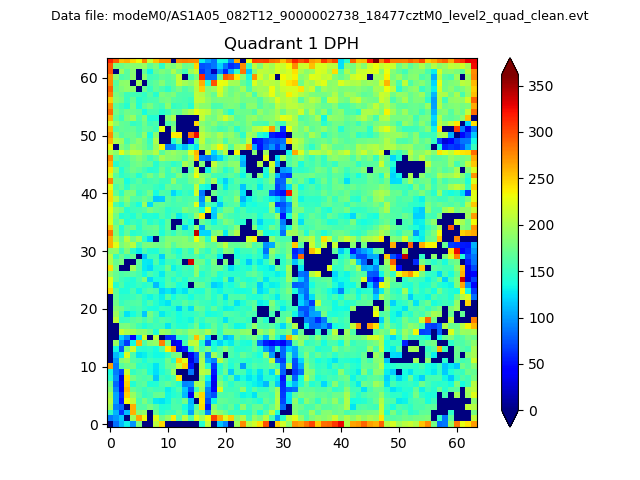 |
Quadrant B |
|---|---|---|---|
| Quadrant D | 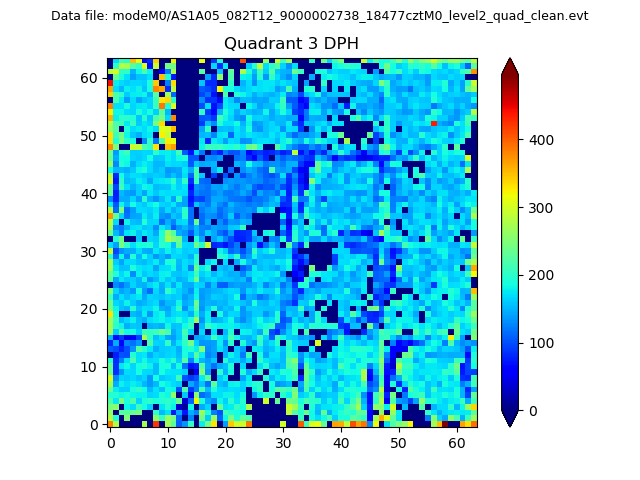 |
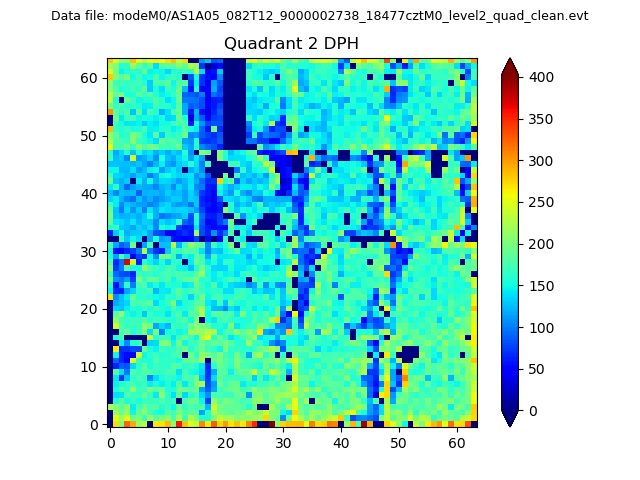 |
Quadrant C |
| Plot type | Count rate plots | Images |
|---|---|---|
| Comparison with Poisson distribution Blue bars denote a histogram of data divided into 1 sec bins. Red curve is a Poisson curve with rate = median count rate of data. |
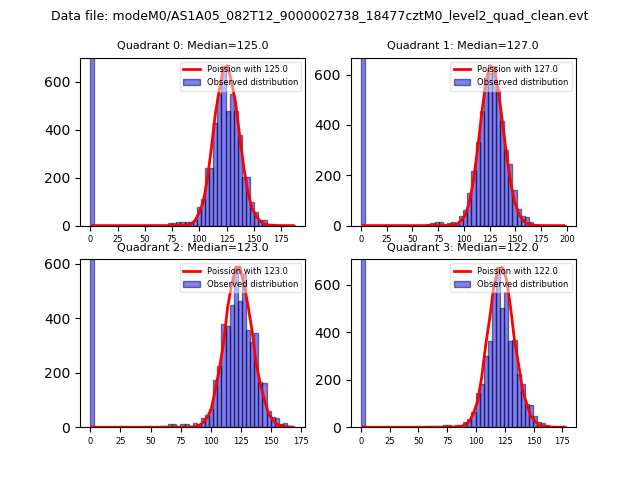 |
 |
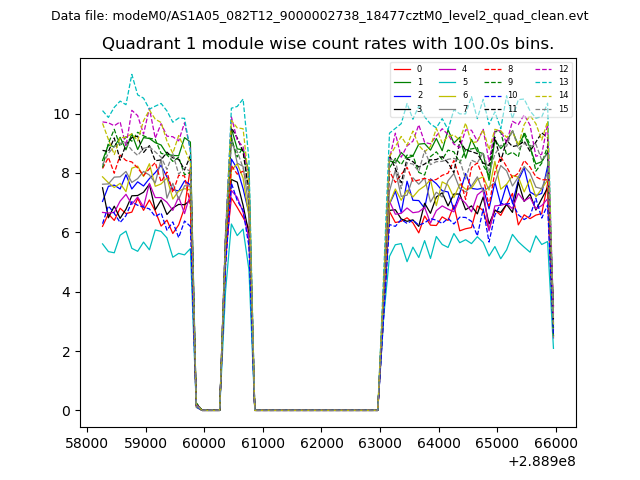
| Quadrant-wise count rates Data is divided into 100 sec bins |
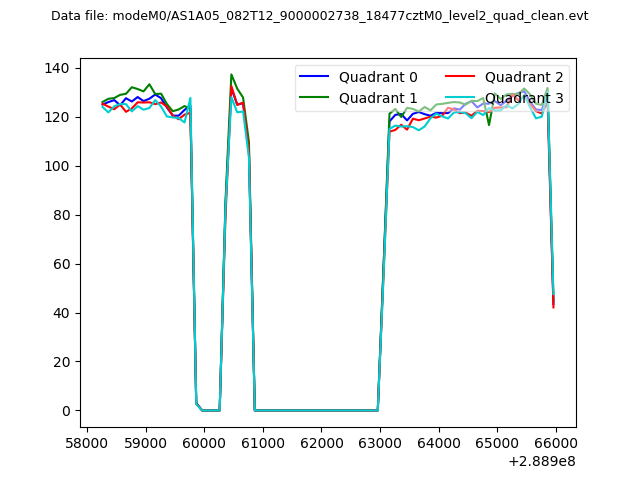 |
|
| Module-wise count rates for Quadrant A Data is divided into 100 sec bins |
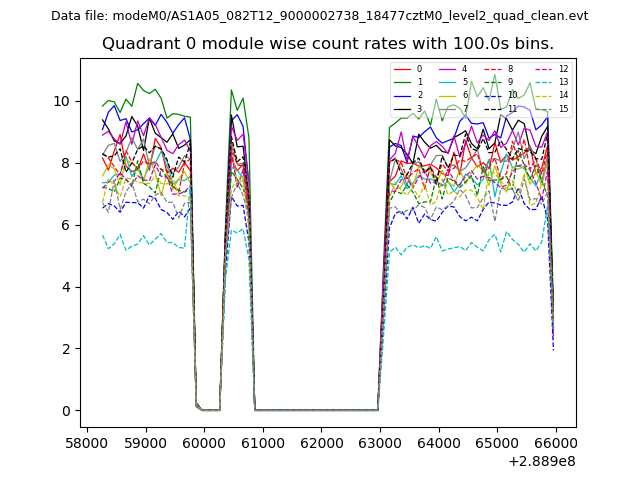 |
 |
| Module-wise count rates for Quadrant B Data is divided into 100 sec bins |
 |
 |
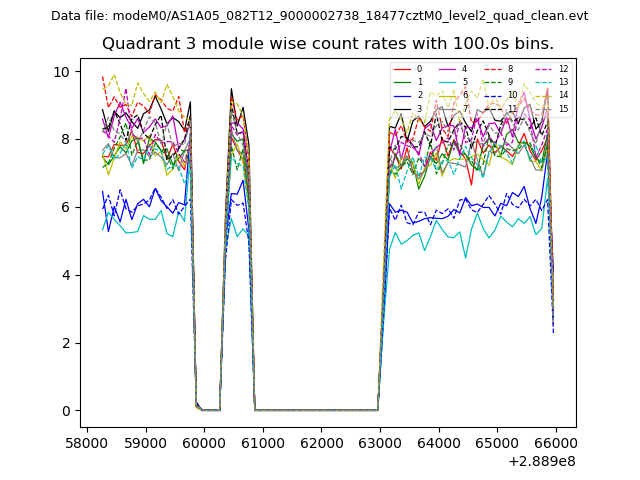
| Module-wise count rates for Quadrant C Data is divided into 100 sec bins |
 |
 |
| Module-wise count rates for Quadrant D Data is divided into 100 sec bins |
 |
 |
| Parameter | Plot |
|---|---|
| CZT HV Monitor | 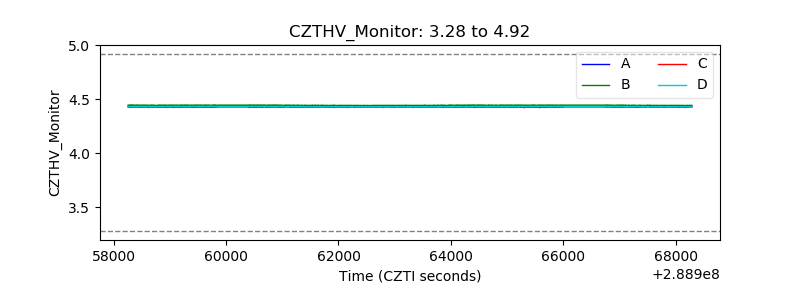 |
| D_VDD | 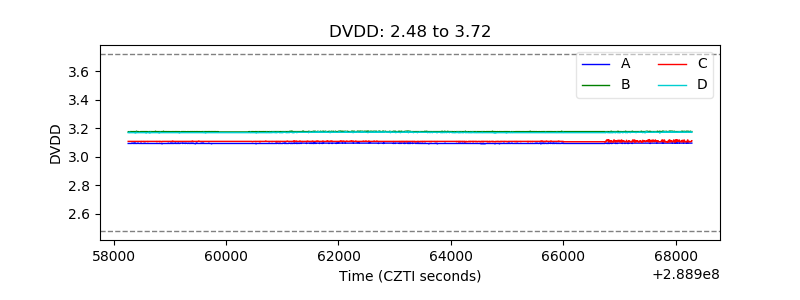 |
| Temperature 1 | 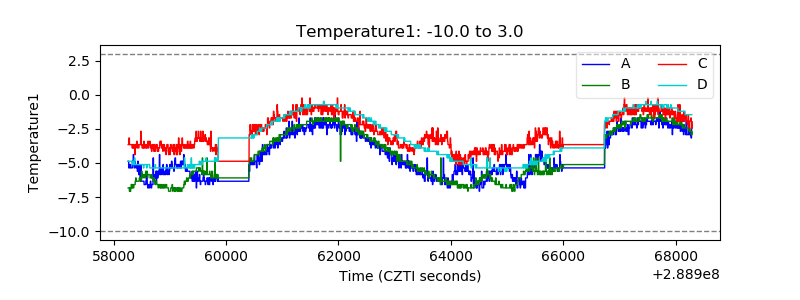 |
| Veto HV Monitor | 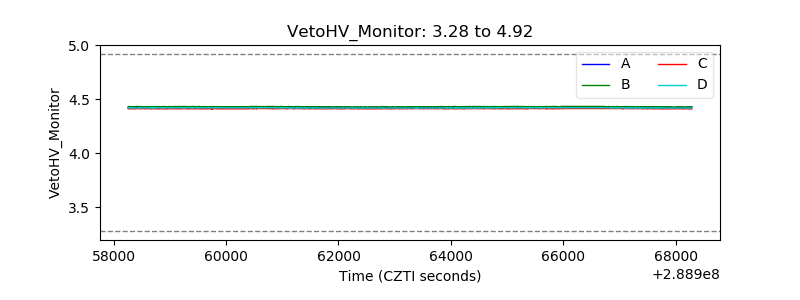 |
| Veto LLD | 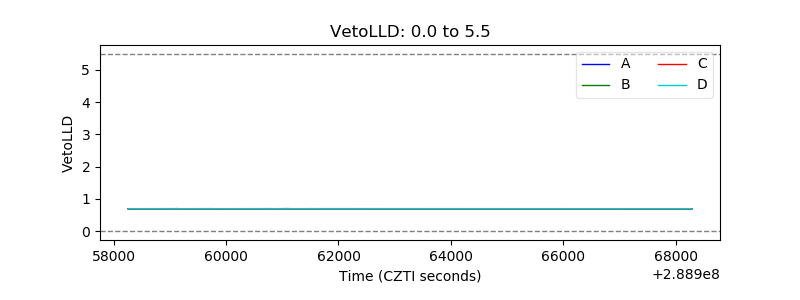 |
| Alpha Counter | 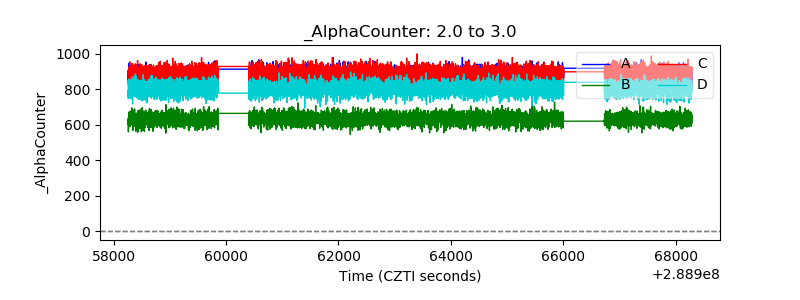 |
| _CPM_Rate | 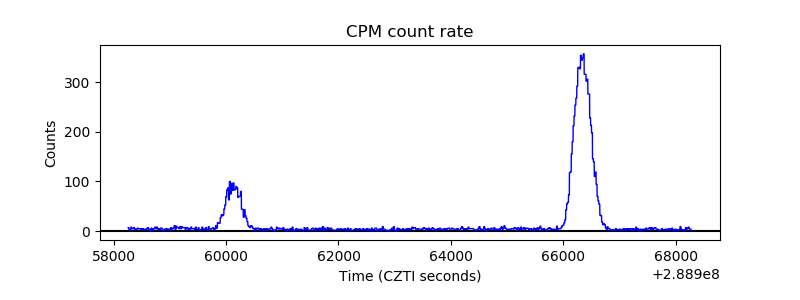 |
| CZT Counter | 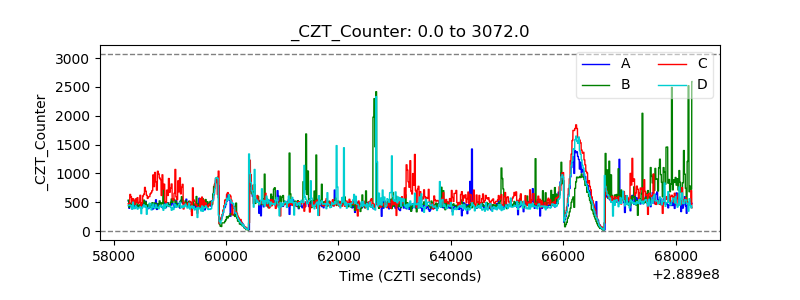 |
| +2.5 Volts monitor |  |
| +5 Volts monitor |  |
| _ROLL_ROT | 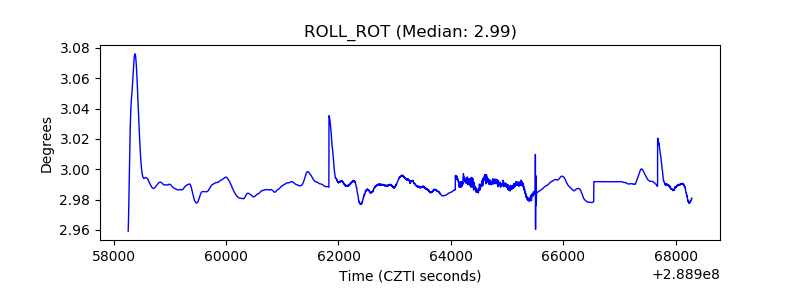 |
| _Roll_DEC | 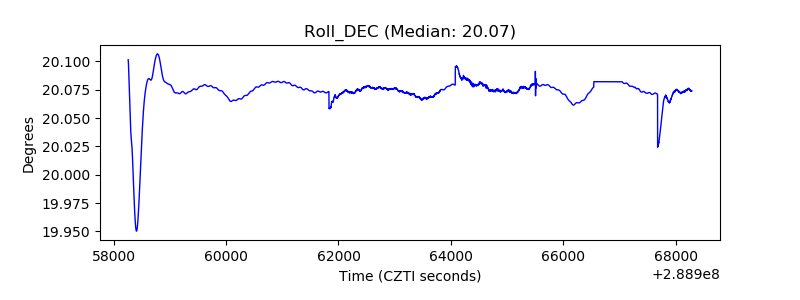 |
| _Roll_RA | 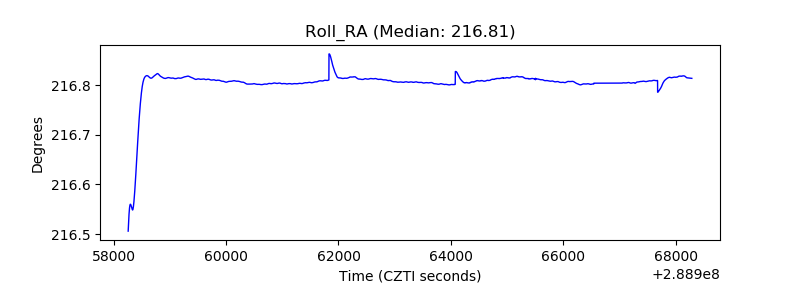 |
| Veto Counter |  |