| Param | Original file | Final file |
|---|---|---|
| Filename | modeM0/AS1A05_082T12_9000002738_18478cztM0_level2.evt | modeM0/AS1A05_082T12_9000002738_18478cztM0_level2_quad_clean.evt |
| Size (bytes) | 538,528,320 | 67,596,480 |
| Size | 513.6 MB | 64.5 MB |
| Events in quadrant A | 3,379,463 | 396,131 |
| Events in quadrant B | 4,708,741 | 399,383 |
| Events in quadrant C | 4,393,148 | 385,321 |
| Events in quadrant D | 3,364,299 | 389,305 |
| Mode M9 | |||
|---|---|---|---|
| Quadrant | BADHDUFLAG | Total packets | Discarded packets |
| A | 0 | 16 | 0 |
| B | 0 | 16 | 0 |
| C | 0 | 16 | 0 |
| D | 0 | 16 | 0 |
| Mode SS | |||
|---|---|---|---|
| Quadrant | BADHDUFLAG | Total packets | Discarded packets |
| A | 0 | 142 | 0 |
| B | 0 | 142 | 0 |
| C | 0 | 142 | 0 |
| D | 0 | 142 | 0 |
| Mode M0 | |||
|---|---|---|---|
| Quadrant | BADHDUFLAG | Total packets | Discarded packets |
| A | 0 | 14393 | 2 |
| B | 0 | 18491 | 2 |
| C | 0 | 17579 | 3 |
| D | 0 | 14543 | 2 |
| Quadrant | Total seconds | Saturated seconds | Saturation percentage |
|---|---|---|---|
| A | 6833 | 91 | 1.331772% |
| B | 6833 | 379 | 5.546612% |
| C | 6832 | 151 | 2.210187% |
| D | 6832 | 78 | 1.141686% |
Noise dominated data is calculated using 1-second bins in cleaned event files. If a bin has >2000 counts, and if more than 50% of those come from <1% of pixels, then it is considered to be noise-dominated and hence unusable.
| Quadrant | # 1 sec bins | Bins with >0 counts | Bins with >2000 counts | High rate bins dominated by noise | Noise dominated (total time) | Noise dominated (detector-on time) | Marked lightcurve |
|---|---|---|---|---|---|---|---|
| A | 8488 | 6833 | 1 | 1 | 0.01% | 0.01% | 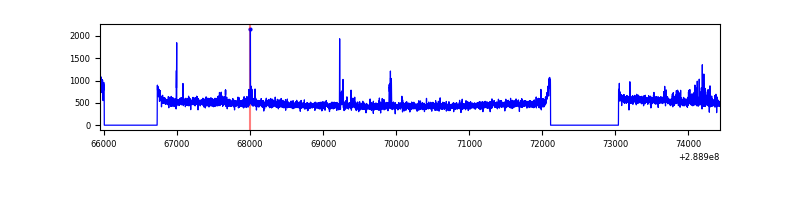 |
| B | 8488 | 6833 | 193 | 193 | 2.27% | 2.82% | 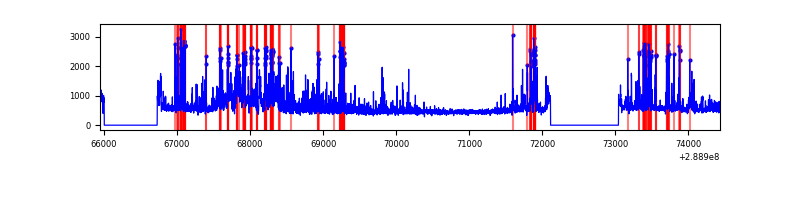 |
| C | 8487 | 6832 | 3 | 3 | 0.04% | 0.04% | 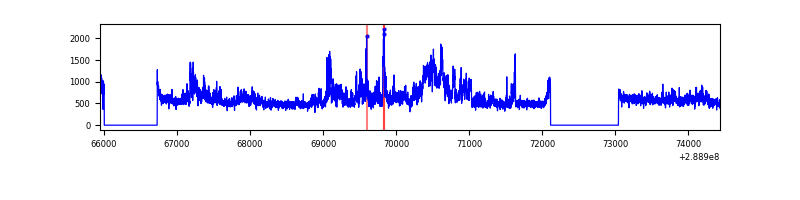 |
| D | 8487 | 6832 | 2 | 2 | 0.02% | 0.03% | 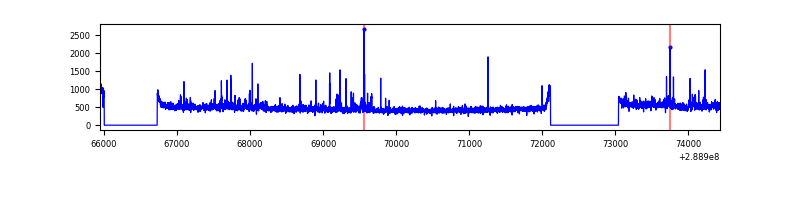 |
Top three noisy pixels from each quadrant. If the there are fewer than three noisy pixels in the level2.evt file, extra rows are filled as -1
| Pixel properties | Quadrant properties | ||||||
|---|---|---|---|---|---|---|---|
| Quadrant | DetID | PixID | Counts | Sigma | Mean | Median | Sigma |
| A | 15 | 174 | 64462 | 370.43 | 850 | 829 | 171.8 |
| A | 4 | 2 | 35329 | 200.84 | 850 | 829 | 171.8 |
| A | 0 | 226 | 7423 | 38.39 | 850 | 829 | 171.8 |
| B | 10 | 245 | 1284053 | 7883.51 | 839 | 817 | 162.8 |
| B | 15 | 222 | 59552 | 360.84 | 839 | 817 | 162.8 |
| B | 4 | 216 | 25410 | 151.09 | 839 | 817 | 162.8 |
| C | 3 | 233 | 1060574 | 5508.01 | 818 | 823 | 192.4 |
| C | 14 | 238 | 125429 | 647.63 | 818 | 823 | 192.4 |
| C | 8 | 128 | 10698 | 51.32 | 818 | 823 | 192.4 |
| D | 7 | 38 | 70338 | 338.58 | 837 | 812 | 205.3 |
| D | 7 | 96 | 32514 | 154.39 | 837 | 812 | 205.3 |
| D | 2 | 234 | 32374 | 153.7 | 837 | 812 | 205.3 |
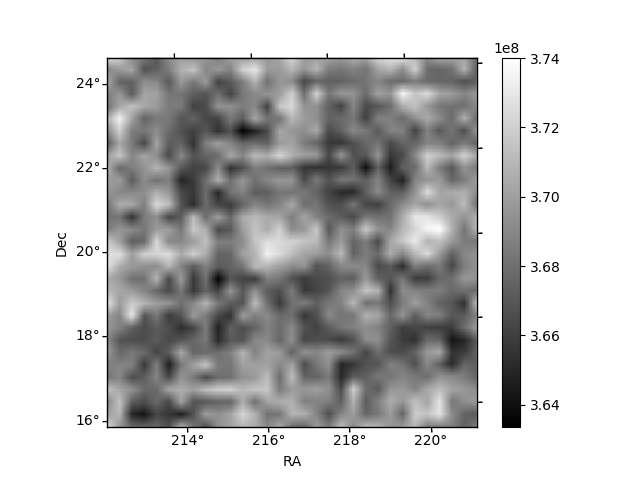
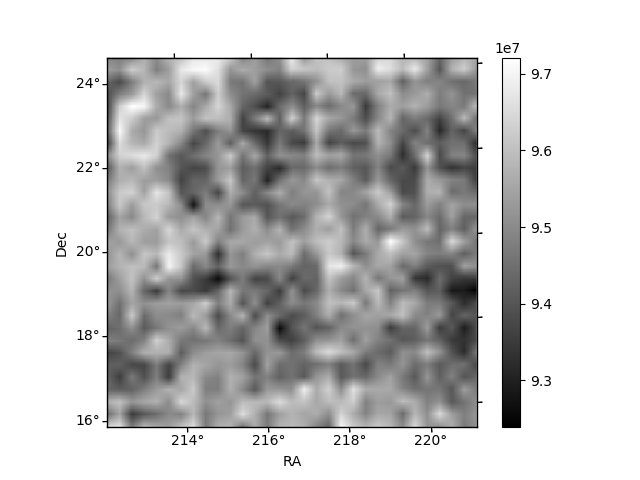
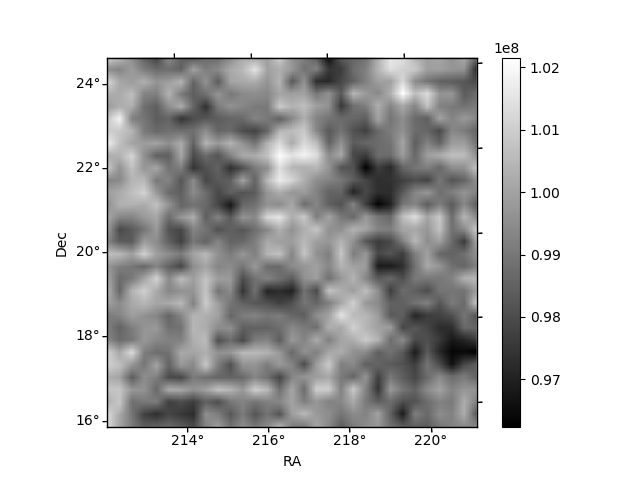
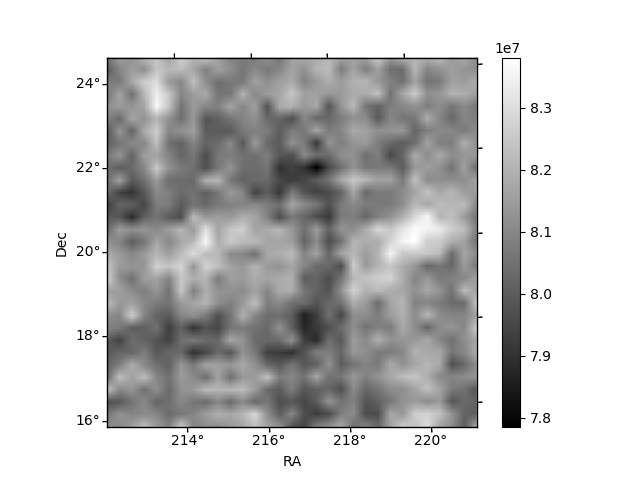
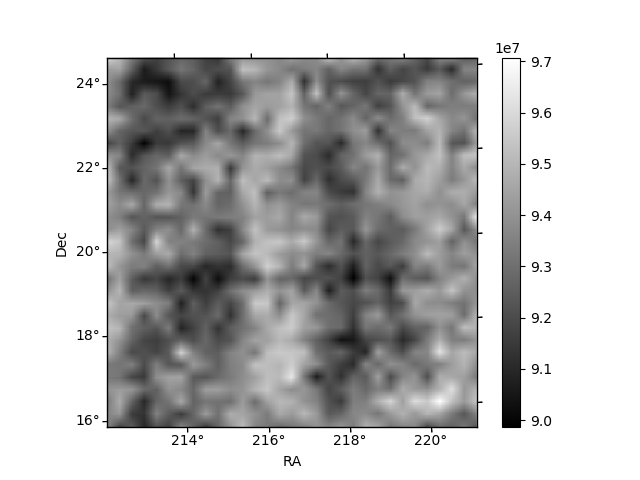
Histogram calculated using DETX and DETY for each event in the final _common_clean file
| Quadrant A | 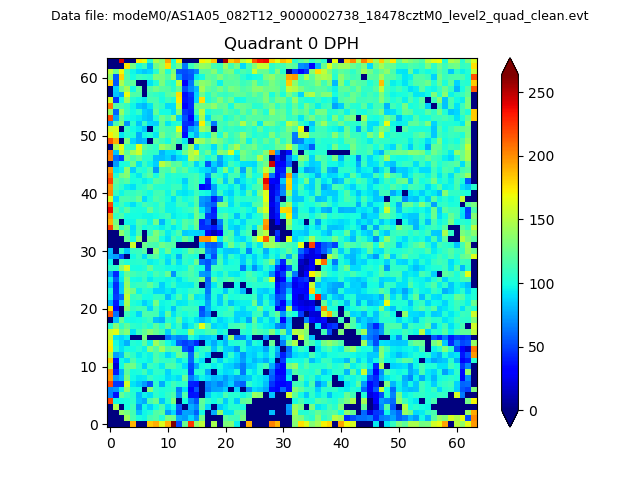 |
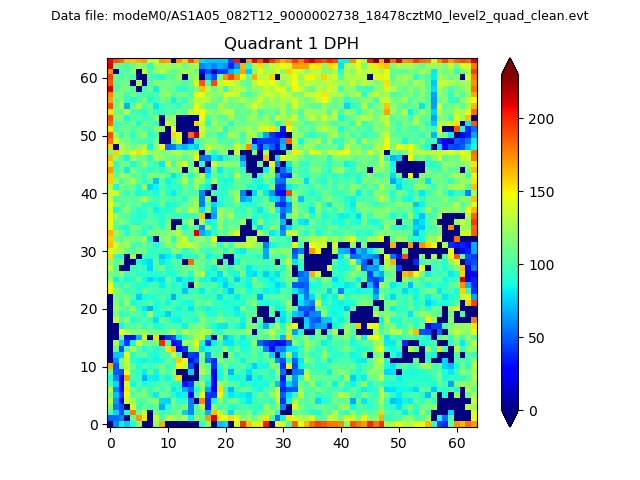 |
Quadrant B |
|---|---|---|---|
| Quadrant D |  |
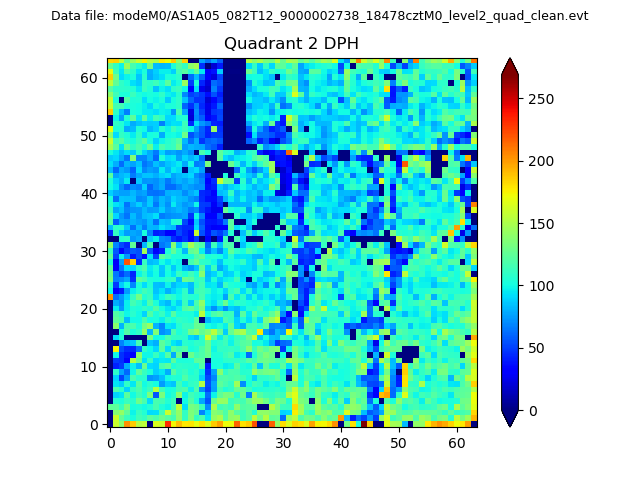 |
Quadrant C |
| Plot type | Count rate plots | Images |
|---|---|---|
| Comparison with Poisson distribution Blue bars denote a histogram of data divided into 1 sec bins. Red curve is a Poisson curve with rate = median count rate of data. |
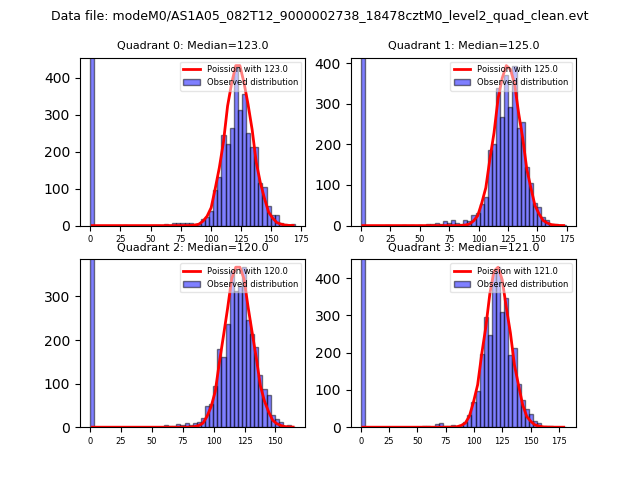 |
 |
| Quadrant-wise count rates Data is divided into 100 sec bins |
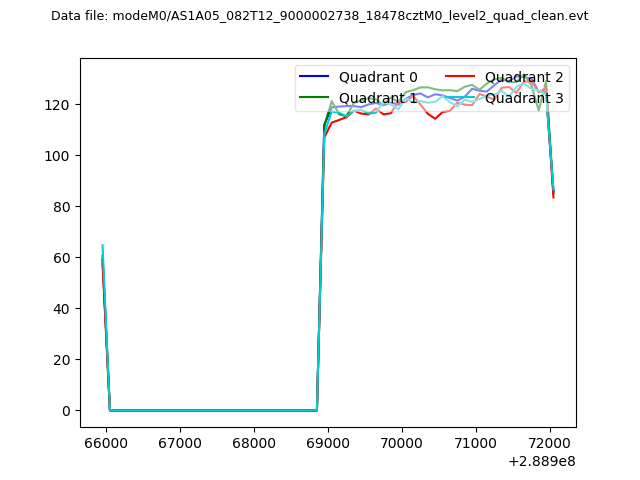 |
|
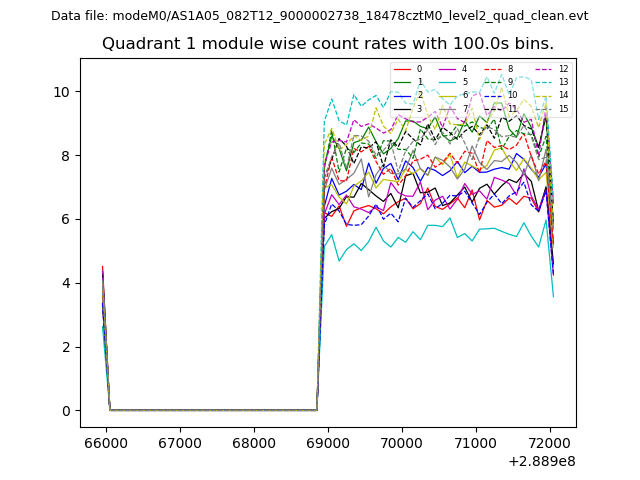
| Module-wise count rates for Quadrant A Data is divided into 100 sec bins |
 |
 |
| Module-wise count rates for Quadrant B Data is divided into 100 sec bins |
 |
 |
| Module-wise count rates for Quadrant C Data is divided into 100 sec bins |
 |
 |
| Module-wise count rates for Quadrant D Data is divided into 100 sec bins |
 |
 |
| Parameter | Plot |
|---|---|
| CZT HV Monitor | 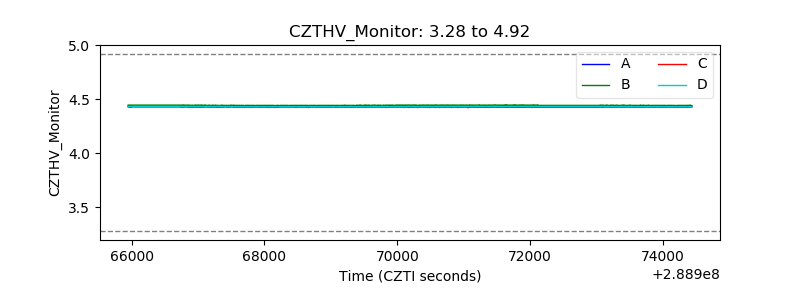 |
| D_VDD | 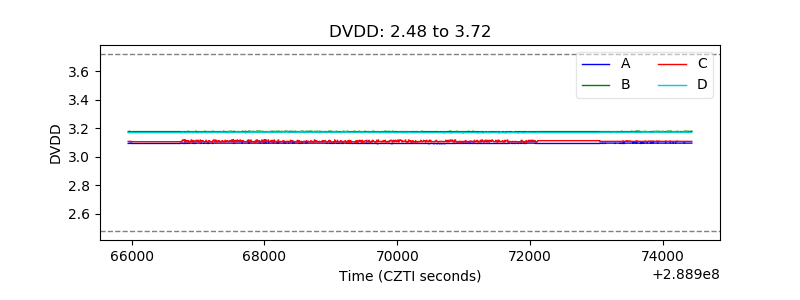 |
| Temperature 1 | 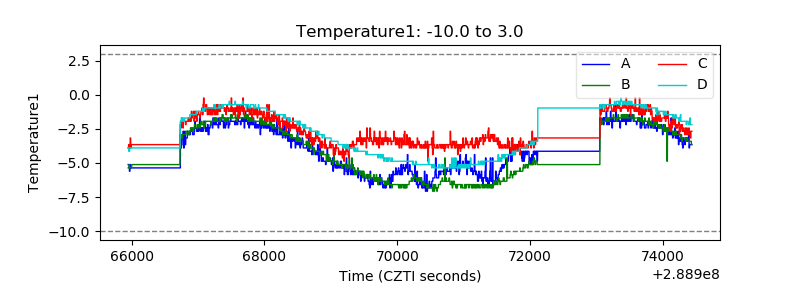 |
| Veto HV Monitor |  |
| Veto LLD | 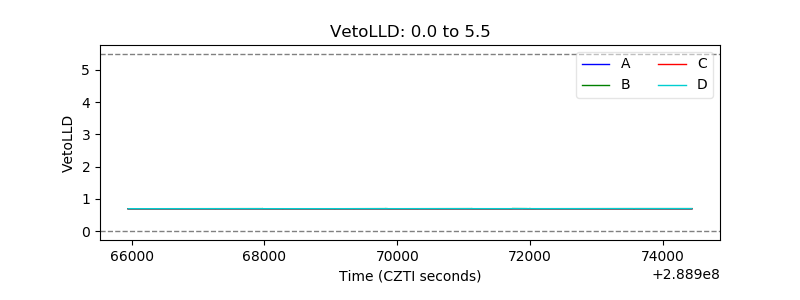 |
| Alpha Counter | 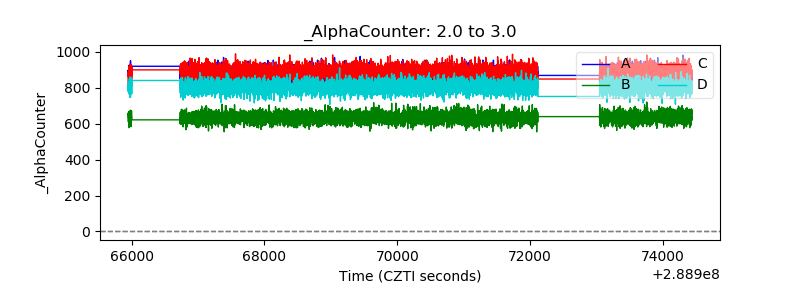 |
| _CPM_Rate | 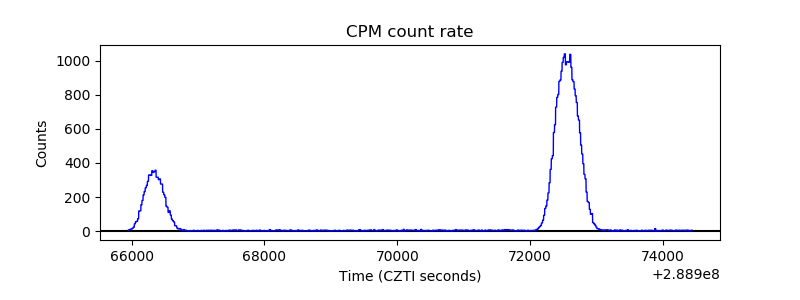 |
| CZT Counter | 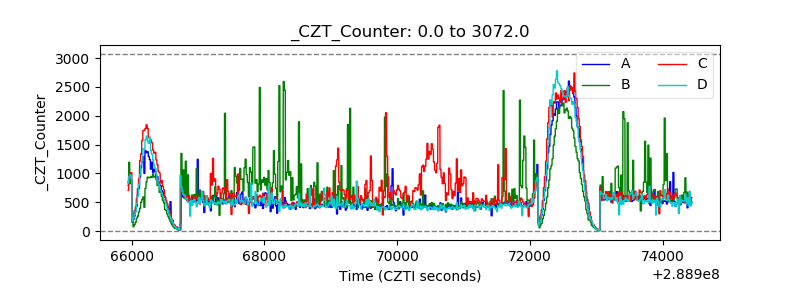 |
| +2.5 Volts monitor | 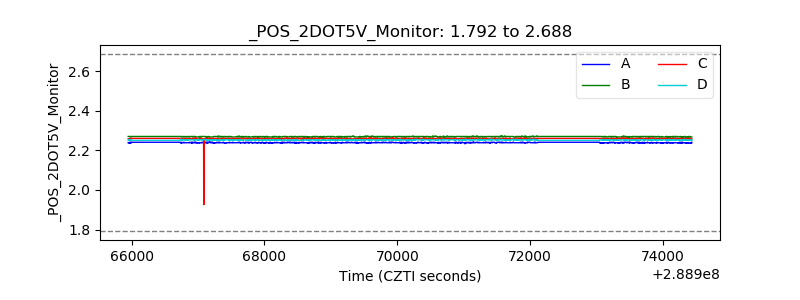 |
| +5 Volts monitor |  |
| _ROLL_ROT |  |
| _Roll_DEC |  |
| _Roll_RA | 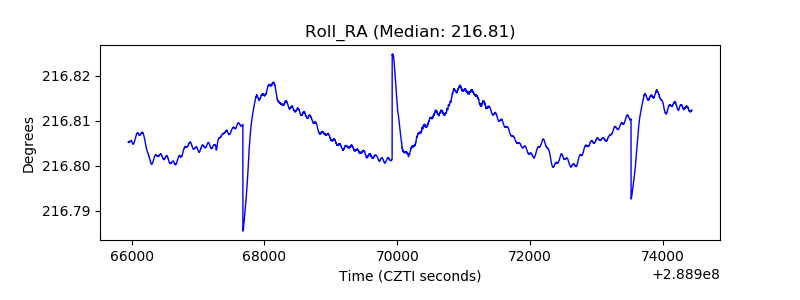 |
| Veto Counter | 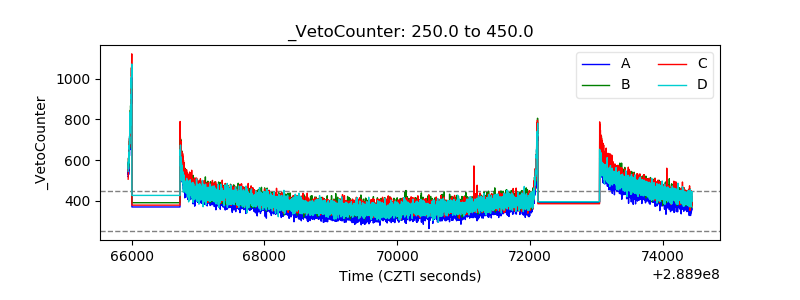 |