| Param | Original file | Final file |
|---|---|---|
| Filename | modeM0/AS1A05_082T12_9000002738_18479cztM0_level2.evt | modeM0/AS1A05_082T12_9000002738_18479cztM0_level2_quad_clean.evt |
| Size (bytes) | 507,476,160 | 72,403,200 |
| Size | 484.0 MB | 69.0 MB |
| Events in quadrant A | 3,304,126 | 435,045 |
| Events in quadrant B | 4,248,200 | 441,918 |
| Events in quadrant C | 3,513,086 | 431,961 |
| Events in quadrant D | 3,858,641 | 426,096 |
| Mode M9 | |||
|---|---|---|---|
| Quadrant | BADHDUFLAG | Total packets | Discarded packets |
| A | 0 | 19 | 0 |
| B | 0 | 20 | 0 |
| C | 0 | 20 | 0 |
| D | 0 | 20 | 0 |
| Mode SS | |||
|---|---|---|---|
| Quadrant | BADHDUFLAG | Total packets | Discarded packets |
| A | 0 | 134 | 0 |
| B | 0 | 134 | 0 |
| C | 0 | 134 | 0 |
| D | 0 | 134 | 0 |
| Mode M0 | |||
|---|---|---|---|
| Quadrant | BADHDUFLAG | Total packets | Discarded packets |
| A | 0 | 14121 | 2 |
| B | 0 | 17004 | 2 |
| C | 0 | 14896 | 2 |
| D | 0 | 16051 | 2 |
| Quadrant | Total seconds | Saturated seconds | Saturation percentage |
|---|---|---|---|
| A | 6562 | 44 | 0.670527% |
| B | 6562 | 314 | 4.785126% |
| C | 6561 | 99 | 1.508916% |
| D | 6561 | 110 | 1.676574% |
Noise dominated data is calculated using 1-second bins in cleaned event files. If a bin has >2000 counts, and if more than 50% of those come from <1% of pixels, then it is considered to be noise-dominated and hence unusable.
| Quadrant | # 1 sec bins | Bins with >0 counts | Bins with >2000 counts | High rate bins dominated by noise | Noise dominated (total time) | Noise dominated (detector-on time) | Marked lightcurve |
|---|---|---|---|---|---|---|---|
| A | 7617 | 6562 | 1 | 1 | 0.01% | 0.02% | 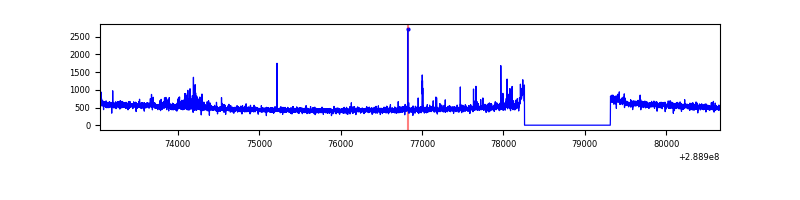 |
| B | 7617 | 6562 | 182 | 182 | 2.39% | 2.77% | 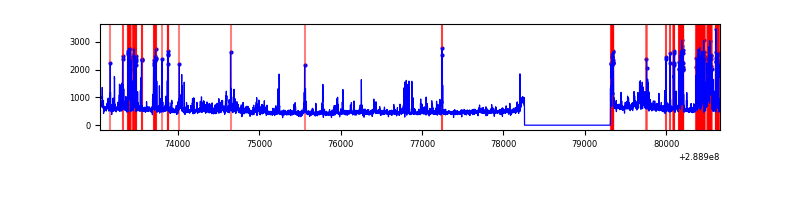 |
| C | 7616 | 6561 | 0 | 0 | 0.00% | 0.00% | 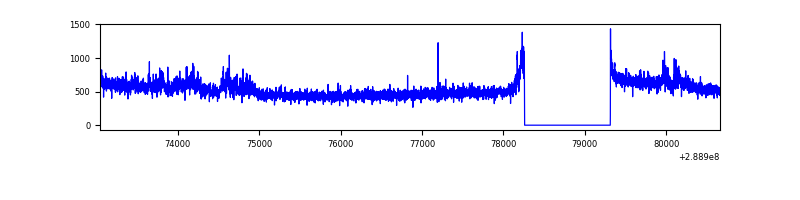 |
| D | 7616 | 6561 | 46 | 46 | 0.60% | 0.70% | 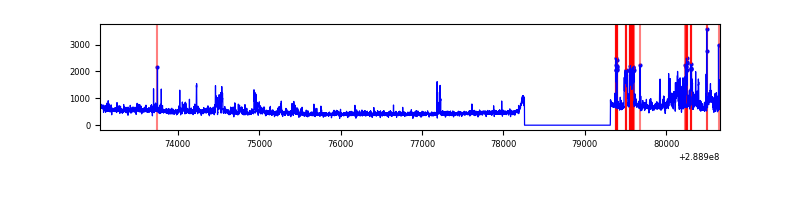 |
Top three noisy pixels from each quadrant. If the there are fewer than three noisy pixels in the level2.evt file, extra rows are filled as -1
| Pixel properties | Quadrant properties | ||||||
|---|---|---|---|---|---|---|---|
| Quadrant | DetID | PixID | Counts | Sigma | Mean | Median | Sigma |
| A | 4 | 2 | 46876 | 273.6 | 833 | 815 | 168.3 |
| A | 15 | 174 | 28034 | 161.68 | 833 | 815 | 168.3 |
| A | 0 | 13 | 20835 | 118.92 | 833 | 815 | 168.3 |
| B | 10 | 245 | 975683 | 6157.99 | 820 | 799 | 158.3 |
| B | 0 | 228 | 21554 | 131.1 | 820 | 799 | 158.3 |
| B | 12 | 111 | 18359 | 110.92 | 820 | 799 | 158.3 |
| C | 3 | 233 | 248965 | 1325.6 | 805 | 811 | 187.2 |
| C | 14 | 238 | 124200 | 659.12 | 805 | 811 | 187.2 |
| C | 13 | 61 | 5702 | 26.13 | 805 | 811 | 187.2 |
| D | 1 | 52 | 203286 | 1007.81 | 817 | 793 | 200.9 |
| D | 10 | 66 | 170880 | 846.52 | 817 | 793 | 200.9 |
| D | 7 | 38 | 133977 | 662.86 | 817 | 793 | 200.9 |
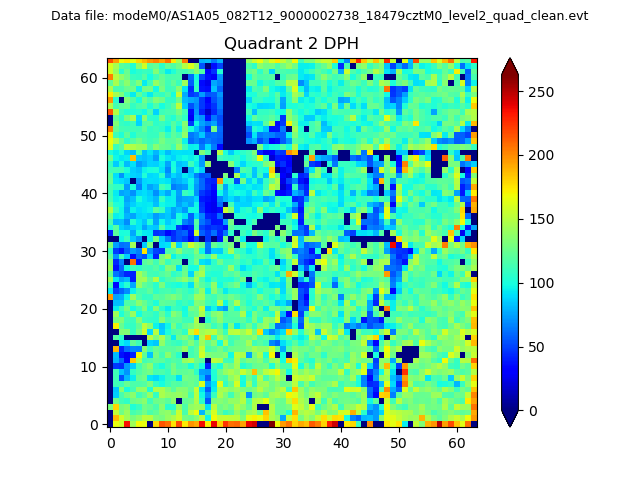
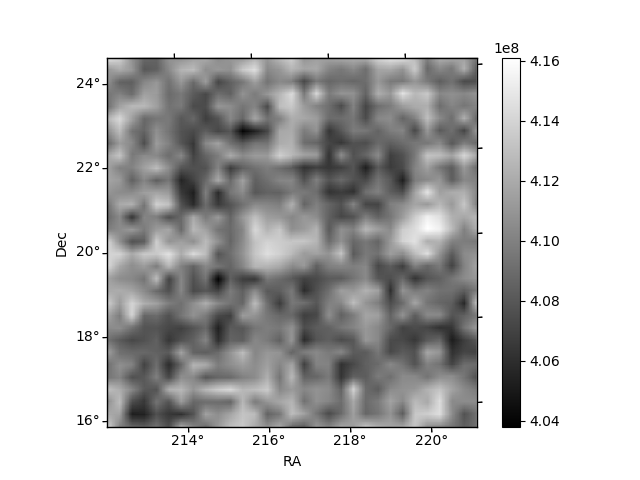
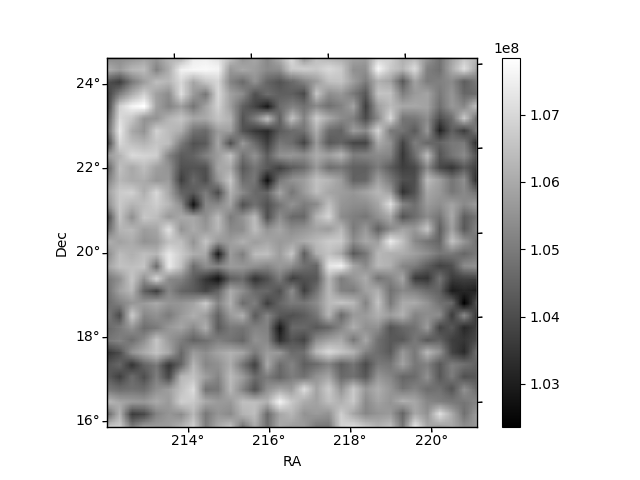
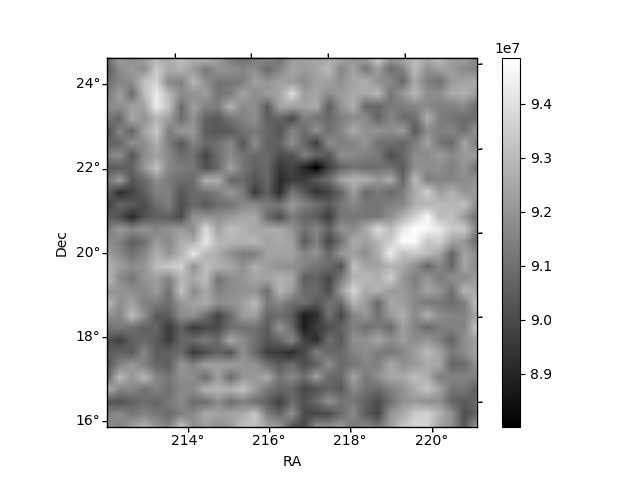
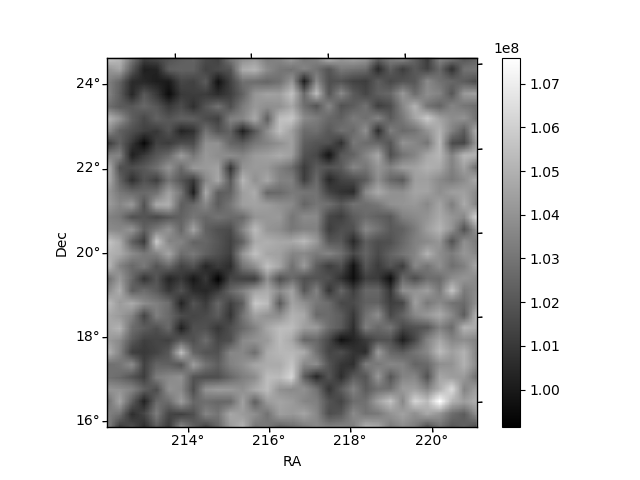
Histogram calculated using DETX and DETY for each event in the final _common_clean file
| Quadrant A | 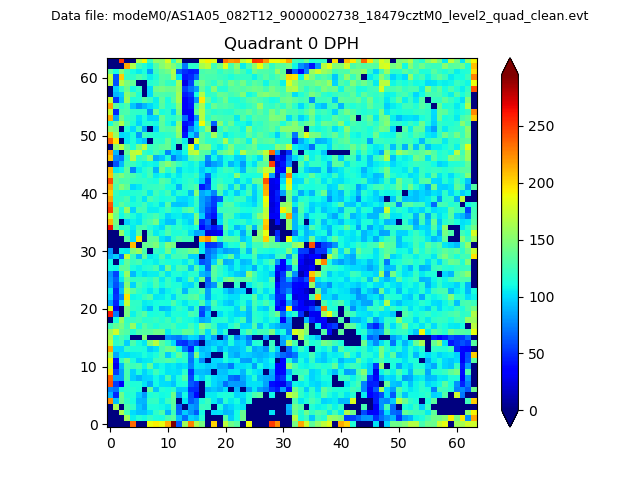 |
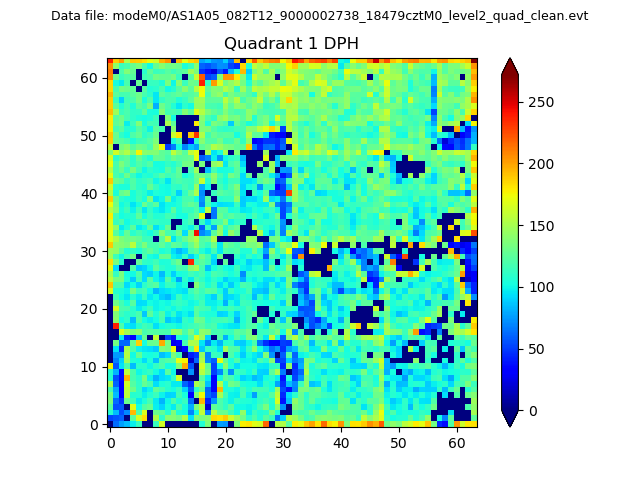 |
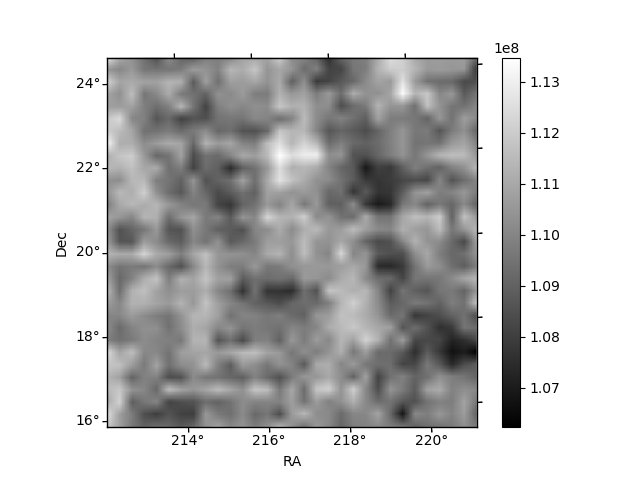
Quadrant B |
|---|---|---|---|
| Quadrant D | 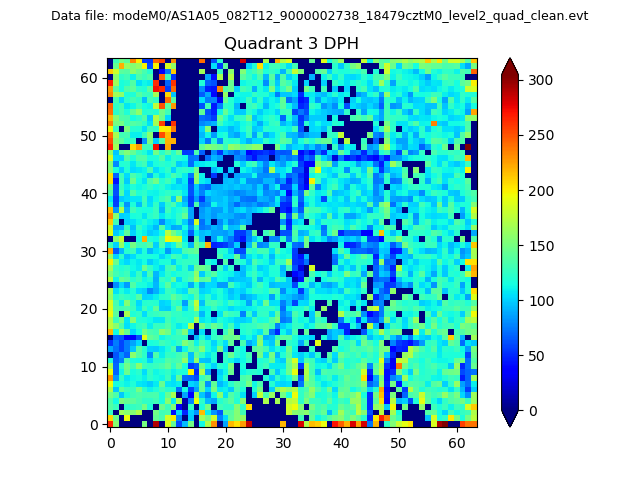 |
 |
Quadrant C |
| Plot type | Count rate plots | Images |
|---|---|---|
| Comparison with Poisson distribution Blue bars denote a histogram of data divided into 1 sec bins. Red curve is a Poisson curve with rate = median count rate of data. |
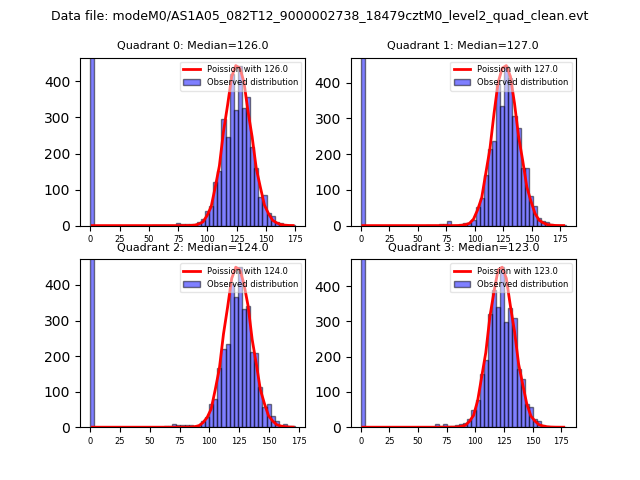 |
 |
| Quadrant-wise count rates Data is divided into 100 sec bins |
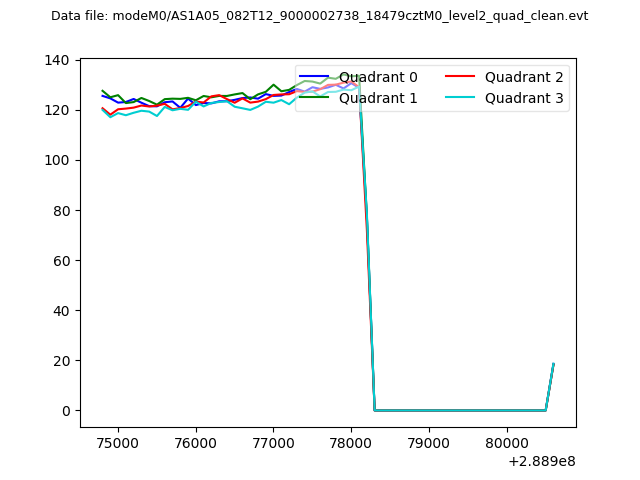 |
|
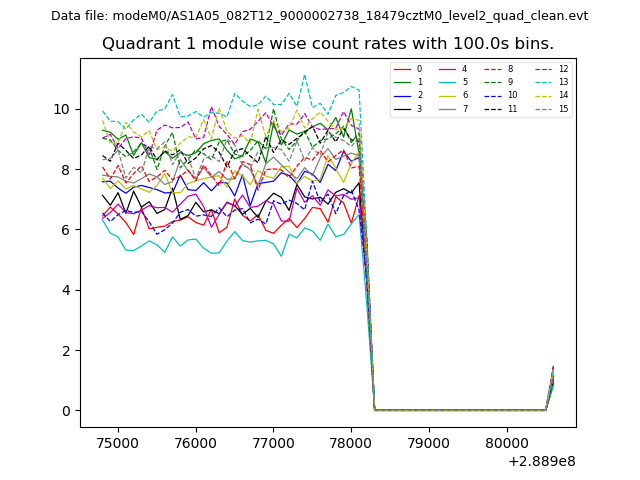
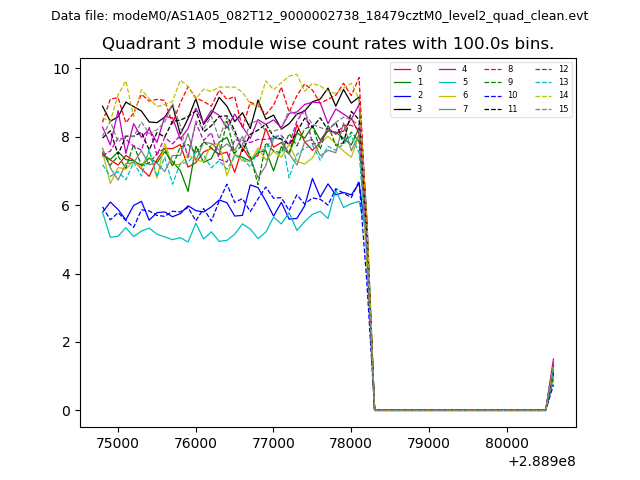
| Module-wise count rates for Quadrant A Data is divided into 100 sec bins |
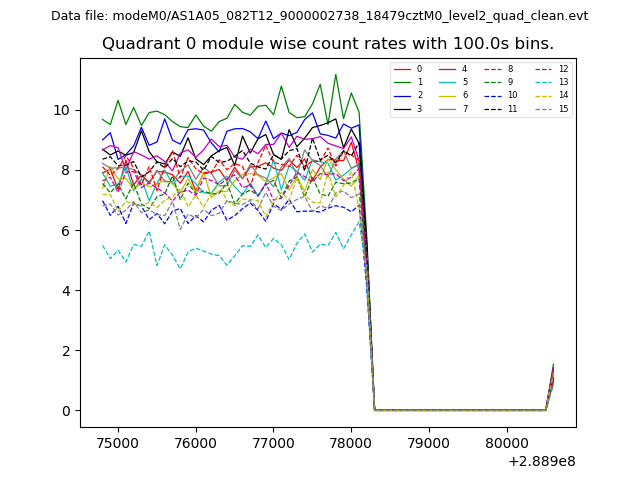 |
 |
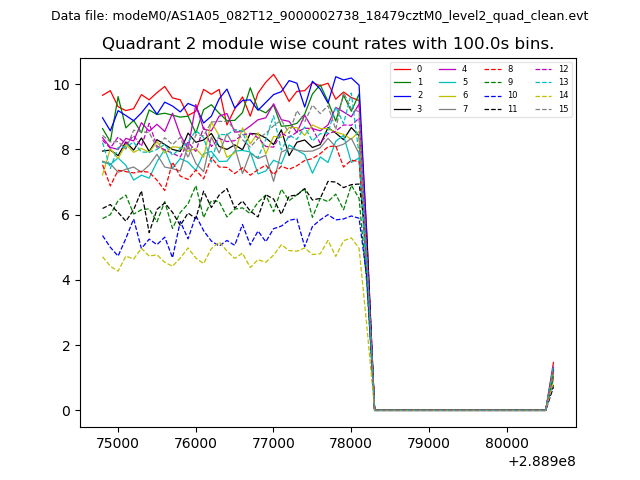
| Module-wise count rates for Quadrant B Data is divided into 100 sec bins |
 |
 |
| Module-wise count rates for Quadrant C Data is divided into 100 sec bins |
 |
 |
| Module-wise count rates for Quadrant D Data is divided into 100 sec bins |
 |
 |
| Parameter | Plot |
|---|---|
| CZT HV Monitor | 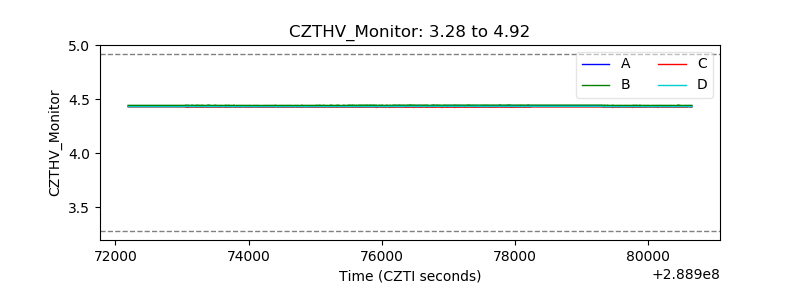 |
| D_VDD | 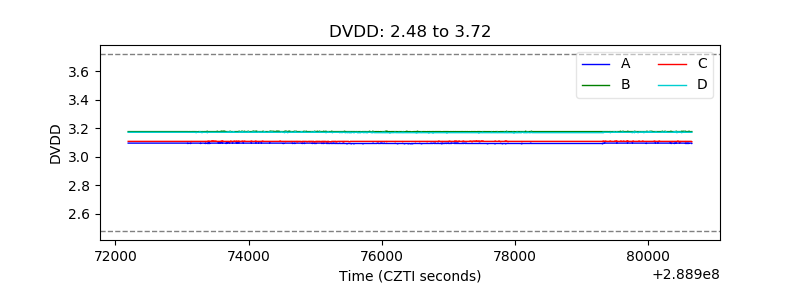 |
| Temperature 1 | 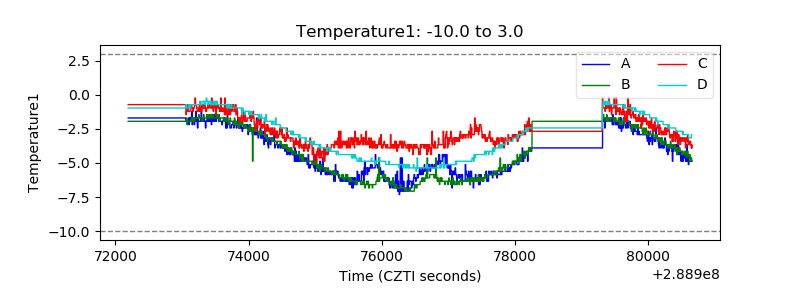 |
| Veto HV Monitor | 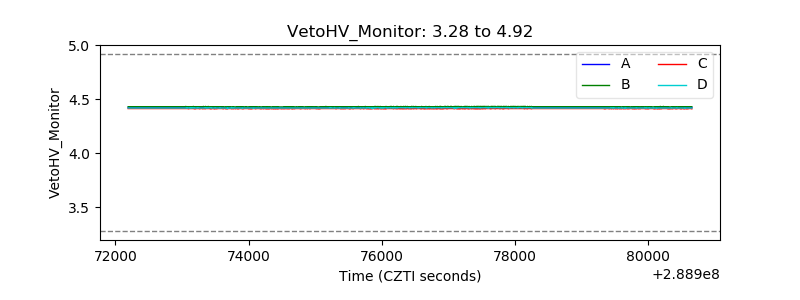 |
| Veto LLD | 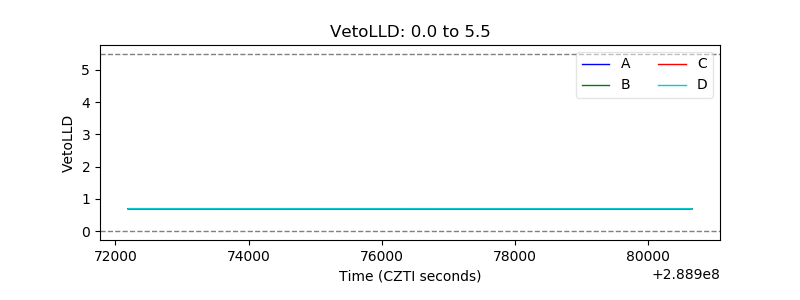 |
| Alpha Counter |  |
| _CPM_Rate |  |
| CZT Counter | 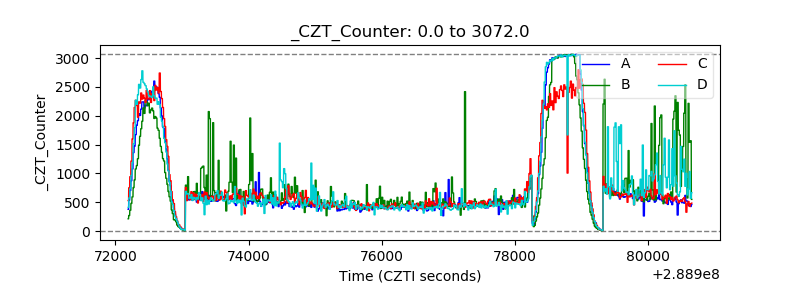 |
| +2.5 Volts monitor | 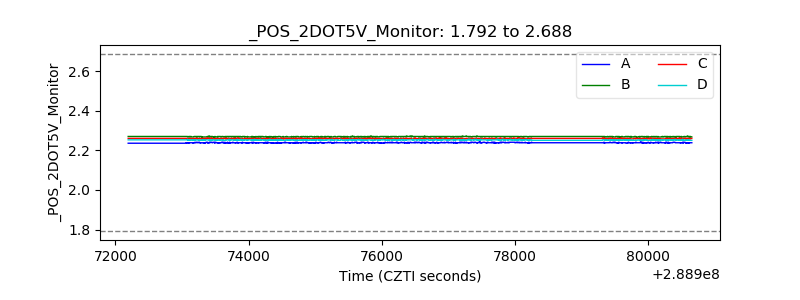 |
| +5 Volts monitor |  |
| _ROLL_ROT | 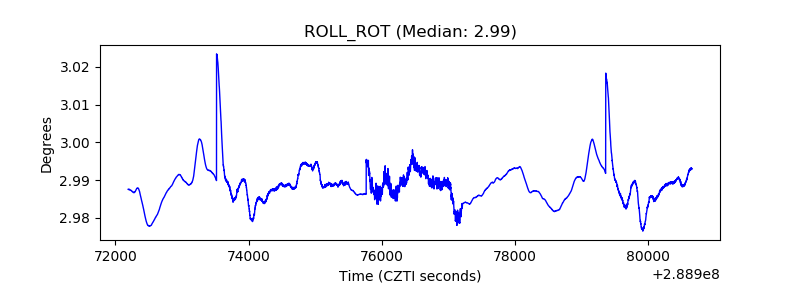 |
| _Roll_DEC | 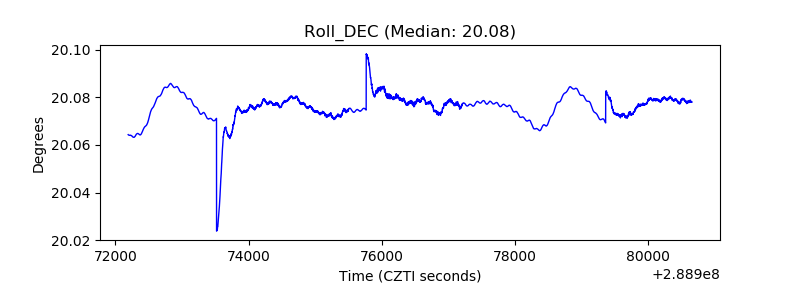 |
| _Roll_RA | 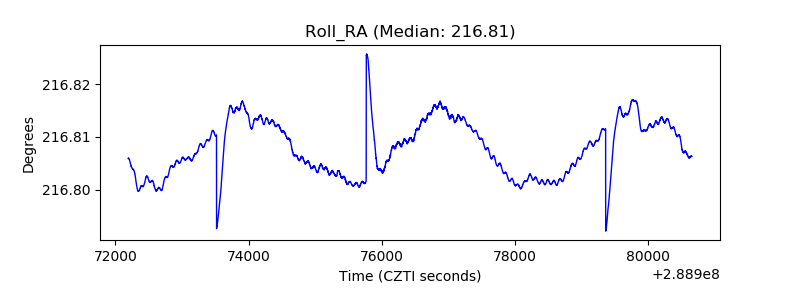 |
| Veto Counter | 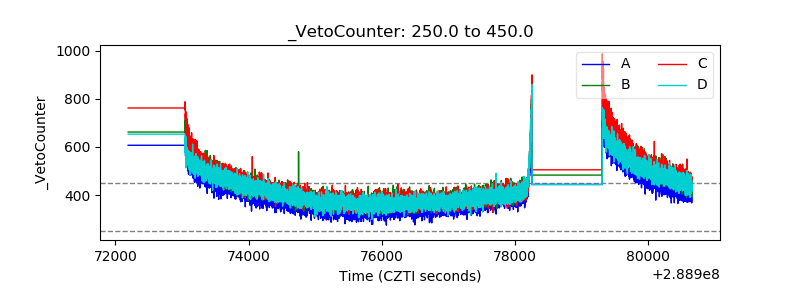 |