| Param | Original file | Final file |
|---|---|---|
| Filename | modeM0/AS1A05_082T12_9000002738_18481cztM0_level2.evt | modeM0/AS1A05_082T12_9000002738_18481cztM0_level2_quad_clean.evt |
| Size (bytes) | 188,311,680 | 16,228,800 |
| Size | 179.6 MB | 15.5 MB |
| Events in quadrant A | 1,070,930 | 87,528 |
| Events in quadrant B | 1,704,749 | 86,890 |
| Events in quadrant C | 1,164,637 | 86,589 |
| Events in quadrant D | 1,625,069 | 84,492 |
| Mode M9 | |||
|---|---|---|---|
| Quadrant | BADHDUFLAG | Total packets | Discarded packets |
| A | 0 | 4 | 0 |
| B | 0 | 5 | 0 |
| C | 0 | 5 | 0 |
| D | 0 | 5 | 0 |
| Mode SS | |||
|---|---|---|---|
| Quadrant | BADHDUFLAG | Total packets | Discarded packets |
| A | 0 | 40 | 0 |
| B | 0 | 40 | 0 |
| C | 0 | 40 | 0 |
| D | 0 | 40 | 0 |
| Mode M0 | |||
|---|---|---|---|
| Quadrant | BADHDUFLAG | Total packets | Discarded packets |
| A | 0 | 4435 | 1 |
| B | 0 | 6456 | 1 |
| C | 0 | 4835 | 1 |
| D | 0 | 6311 | 1 |
| Quadrant | Total seconds | Saturated seconds | Saturation percentage |
|---|---|---|---|
| A | 1996 | 6 | 0.300601% |
| B | 1996 | 231 | 11.573146% |
| C | 1996 | 35 | 1.753507% |
| D | 1996 | 87 | 4.358717% |
Noise dominated data is calculated using 1-second bins in cleaned event files. If a bin has >2000 counts, and if more than 50% of those come from <1% of pixels, then it is considered to be noise-dominated and hence unusable.
| Quadrant | # 1 sec bins | Bins with >0 counts | Bins with >2000 counts | High rate bins dominated by noise | Noise dominated (total time) | Noise dominated (detector-on time) | Marked lightcurve |
|---|---|---|---|---|---|---|---|
| A | 1996 | 1996 | 0 | 0 | 0.00% | 0.00% |  |
| B | 1996 | 1996 | 163 | 163 | 8.17% | 8.17% | 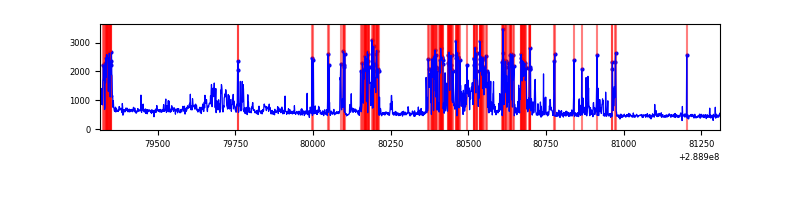 |
| C | 1996 | 1996 | 0 | 0 | 0.00% | 0.00% |  |
| D | 1996 | 1996 | 46 | 46 | 2.30% | 2.30% | 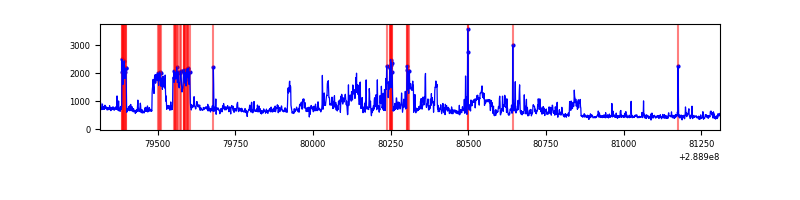 |
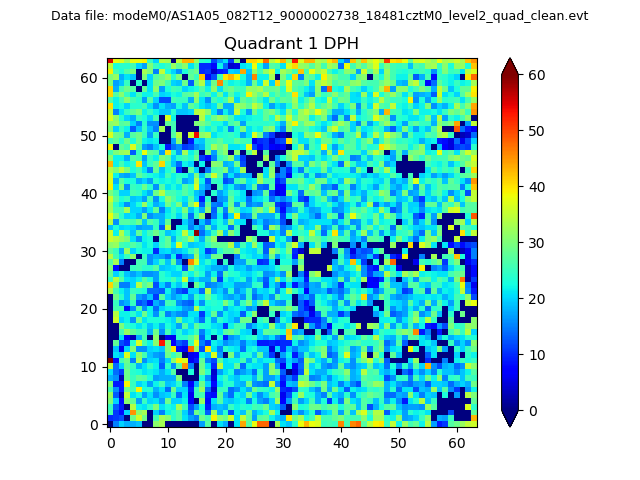
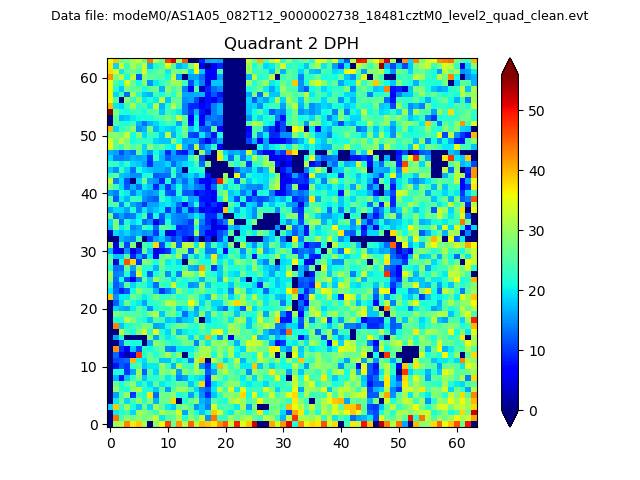
Top three noisy pixels from each quadrant. If the there are fewer than three noisy pixels in the level2.evt file, extra rows are filled as -1
| Pixel properties | Quadrant properties | ||||||
|---|---|---|---|---|---|---|---|
| Quadrant | DetID | PixID | Counts | Sigma | Mean | Median | Sigma |
| A | 15 | 174 | 15625 | 270.0 | 273 | 267 | 56.9 |
| A | 0 | 13 | 2502 | 39.29 | 273 | 267 | 56.9 |
| A | 0 | 226 | 2333 | 36.32 | 273 | 267 | 56.9 |
| B | 10 | 245 | 659004 | 12796.63 | 263 | 257 | 51.5 |
| B | 12 | 111 | 5660 | 104.96 | 263 | 257 | 51.5 |
| B | 11 | 111 | 4865 | 89.51 | 263 | 257 | 51.5 |
| C | 3 | 233 | 84841 | 1340.1 | 266 | 267 | 63.1 |
| C | 14 | 238 | 42020 | 661.59 | 266 | 267 | 63.1 |
| C | 13 | 61 | 1935 | 26.43 | 266 | 267 | 63.1 |
| D | 1 | 52 | 203691 | 3031.96 | 267 | 259 | 67.1 |
| D | 10 | 66 | 159982 | 2380.52 | 267 | 259 | 67.1 |
| D | 7 | 38 | 125546 | 1867.29 | 267 | 259 | 67.1 |
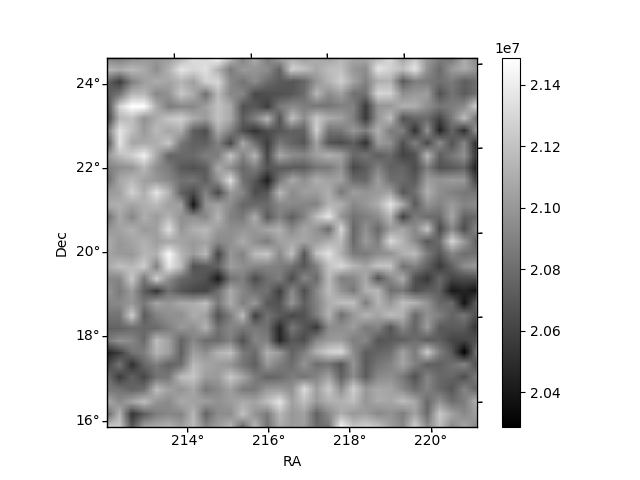
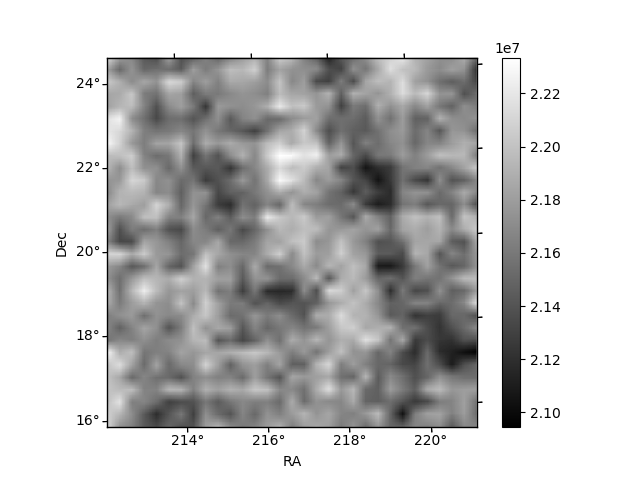
Histogram calculated using DETX and DETY for each event in the final _common_clean file
| Quadrant A | 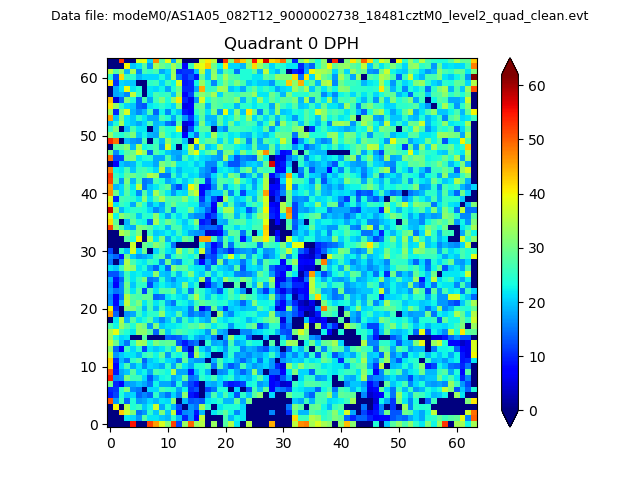 |
 |
Quadrant B |
|---|---|---|---|
| Quadrant D | 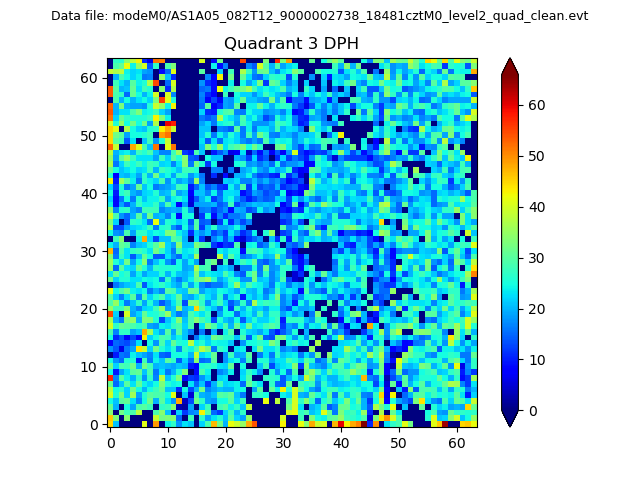 |
 |
Quadrant C |
| Plot type | Count rate plots | Images |
|---|---|---|
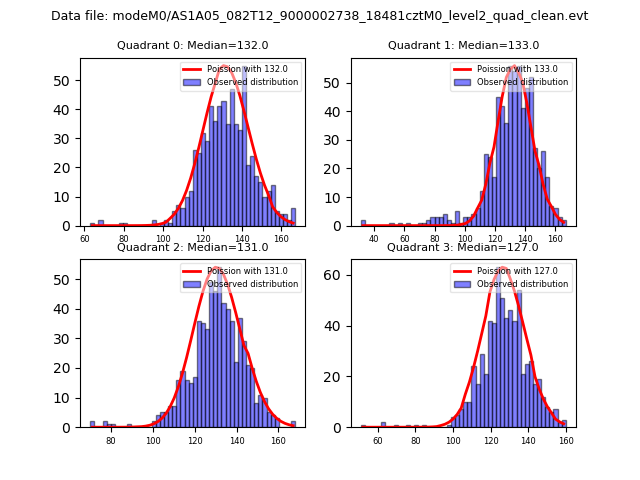
| Comparison with Poisson distribution Blue bars denote a histogram of data divided into 1 sec bins. Red curve is a Poisson curve with rate = median count rate of data. |
 |
 |
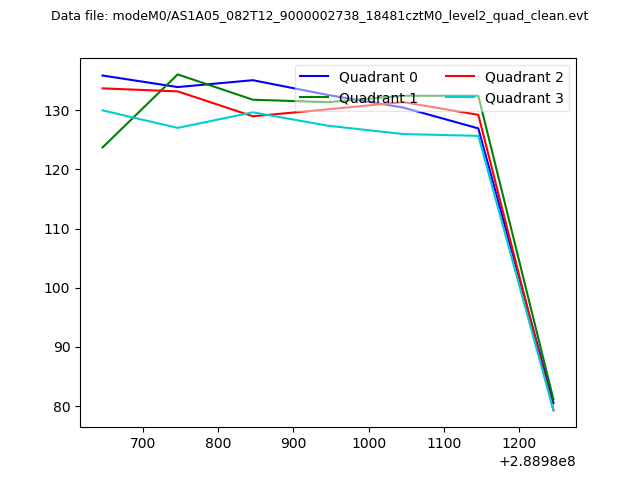
| Quadrant-wise count rates Data is divided into 100 sec bins |
 |
|
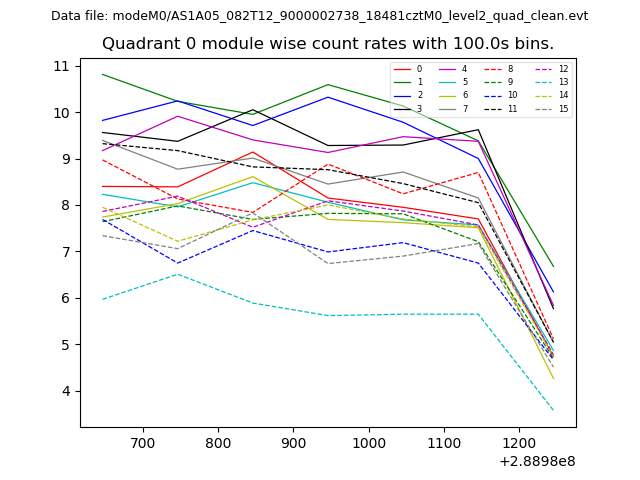
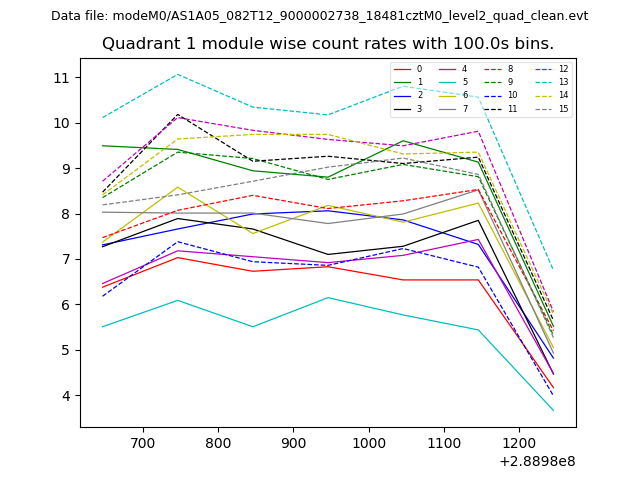
| Module-wise count rates for Quadrant A Data is divided into 100 sec bins |
 |
 |
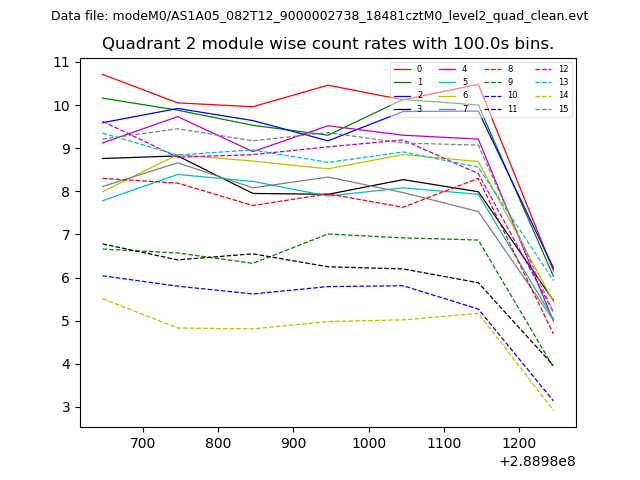
| Module-wise count rates for Quadrant B Data is divided into 100 sec bins |
 |
 |
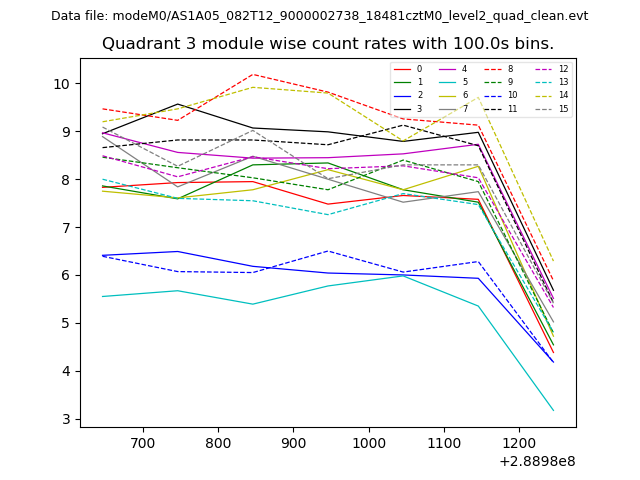
| Module-wise count rates for Quadrant C Data is divided into 100 sec bins |
 |
 |
| Module-wise count rates for Quadrant D Data is divided into 100 sec bins |
 |
 |
| Parameter | Plot |
|---|---|
| CZT HV Monitor | 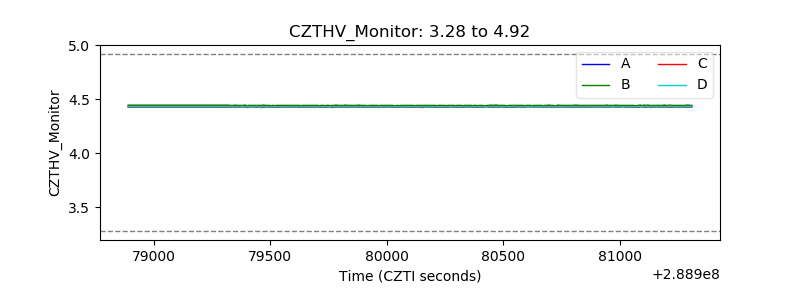 |
| D_VDD | 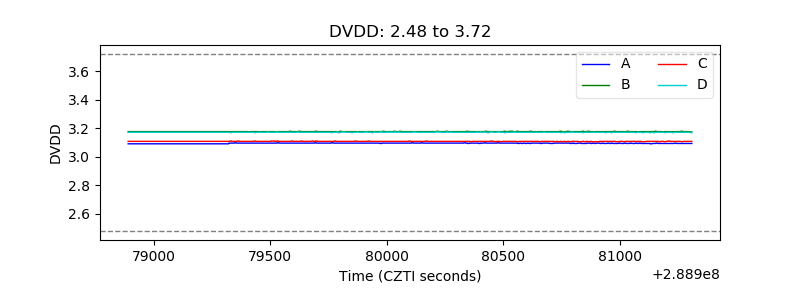 |
| Temperature 1 | 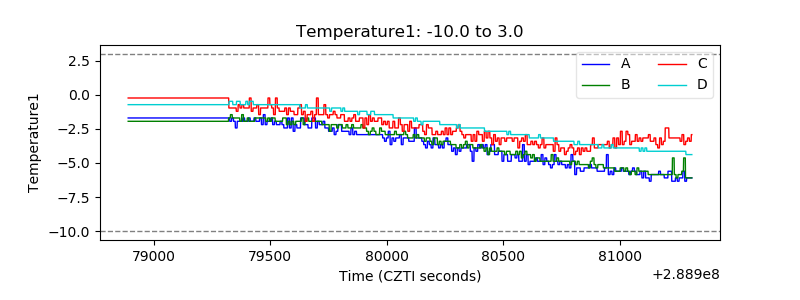 |
| Veto HV Monitor | 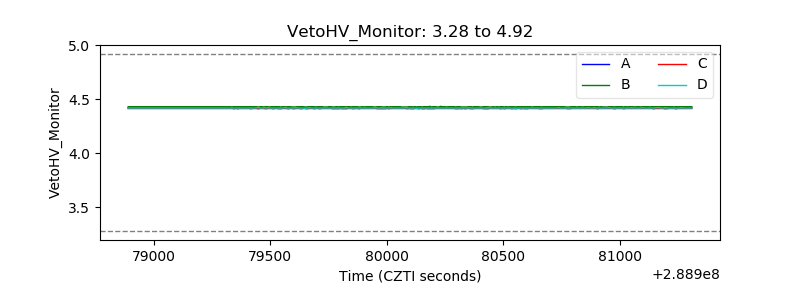 |
| Veto LLD | 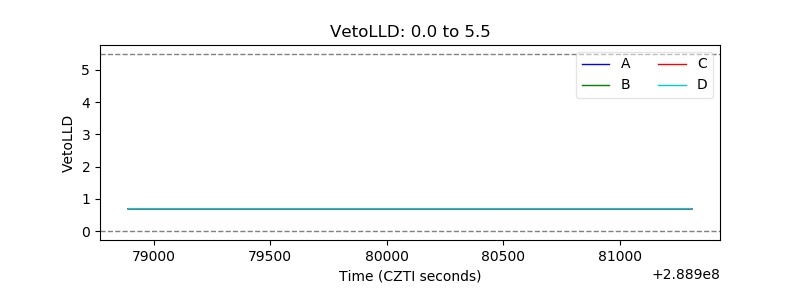 |
| Alpha Counter | 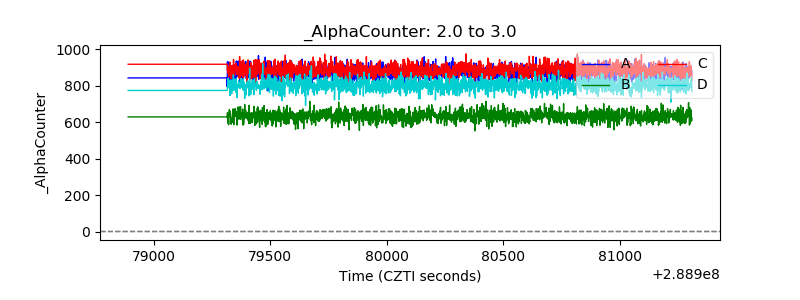 |
| _CPM_Rate |  |
| CZT Counter | 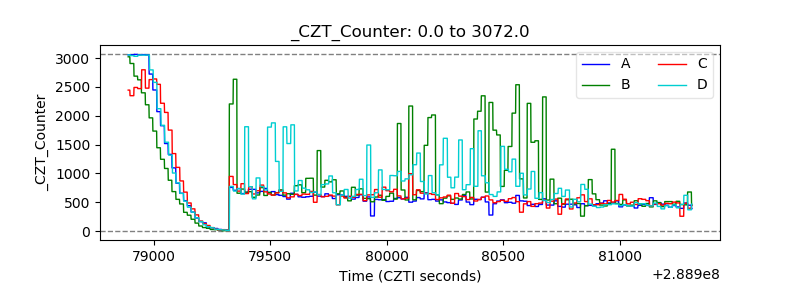 |
| +2.5 Volts monitor | 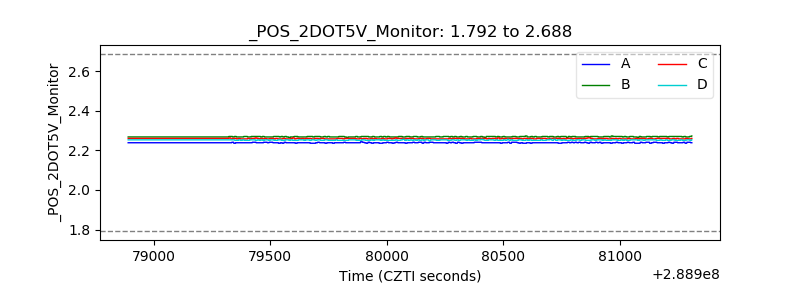 |
| +5 Volts monitor |  |
| _ROLL_ROT |  |
| _Roll_DEC | 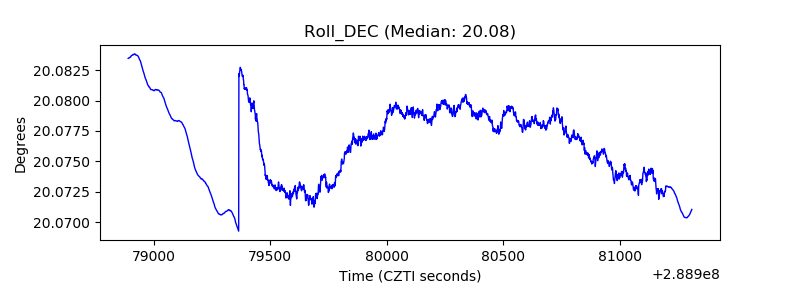 |
| _Roll_RA | 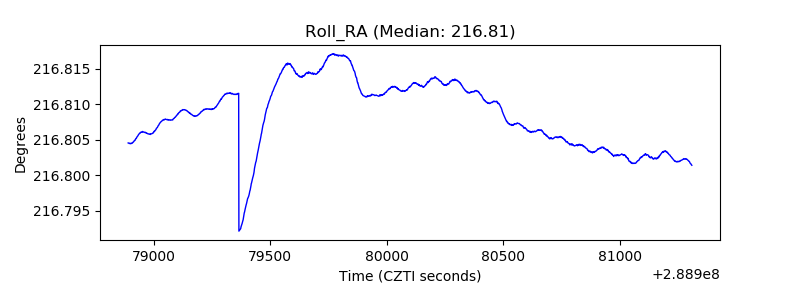 |
| Veto Counter | 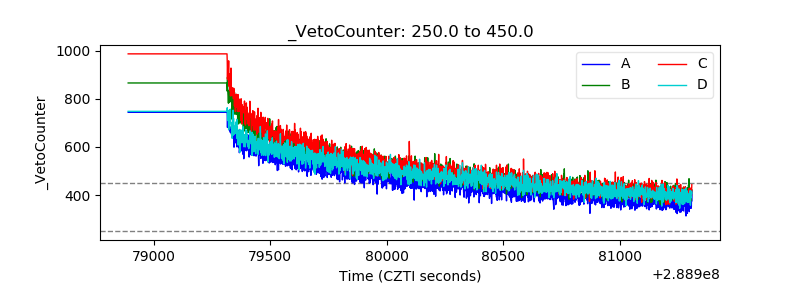 |