| Param | Original file | Final file |
|---|---|---|
| Filename | modeM0/AS1A05_075T08_9000002744cztM0_level2.fits | modeM0/AS1A05_075T08_9000002744cztM0_level2_quad_clean.evt |
| Size (bytes) | 487,411,200 | 446,172,480 |
| Size | 464.8 MB | 425.5 MB |
| Events in quadrant A | 2,925,294 | 2,530,668 |
| Events in quadrant B | 2,893,732 | 2,656,804 |
| Events in quadrant C | 2,946,352 | 2,553,186 |
| Events in quadrant D | 2,567,212 | 2,343,805 |
| Mode M0 | |||
|---|---|---|---|
| Quadrant | BADHDUFLAG | Total packets | Discarded packets |
| A | 0 | 120818 | 0 |
| B | 0 | 109036 | 0 |
| C | 0 | 104216 | 0 |
| D | 0 | 109499 | 0 |
| Mode SS | |||
|---|---|---|---|
| Quadrant | BADHDUFLAG | Total packets | Discarded packets |
| A | 0 | 1016 | 0 |
| B | 0 | 1014 | 0 |
| C | 0 | 1012 | 0 |
| D | 0 | 1018 | 0 |
| Mode M9 | |||
|---|---|---|---|
| Quadrant | BADHDUFLAG | Total packets | Discarded packets |
| A | 0 | 68 | 0 |
| B | 0 | 68 | 0 |
| C | 0 | 68 | 0 |
| D | 0 | 68 | 0 |
| Quadrant | Total seconds | Saturated seconds | Saturation percentage |
|---|---|---|---|
| A | 49884 | 2280 | 4.570604% |
| B | 49959 | 1124 | 2.249845% |
| C | 49963 | 978 | 1.957449% |
| D | 49957 | 858 | 1.717477% |
Noise dominated data is calculated using 1-second bins in cleaned event files. If a bin has >2000 counts, and if more than 50% of those come from <1% of pixels, then it is considered to be noise-dominated and hence unusable.
| Quadrant | # 1 sec bins | Bins with >0 counts | Bins with >2000 counts | High rate bins dominated by noise | Noise dominated (total time) | Noise dominated (detector-on time) | Marked lightcurve |
|---|---|---|---|---|---|---|---|
| A | 57627 | 50198 | 0 | 0 | 0.00% | 0.00% | 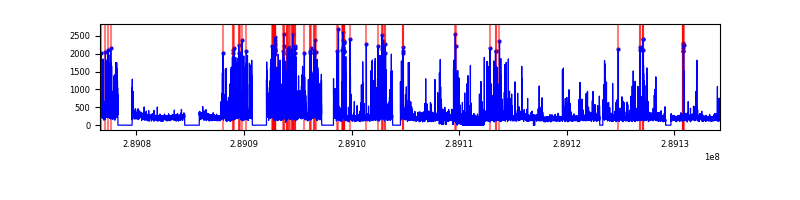 |
| B | 57627 | 50271 | 0 | 0 | 0.00% | 0.00% |  |
| C | 57627 | 50263 | 0 | 0 | 0.00% | 0.00% | 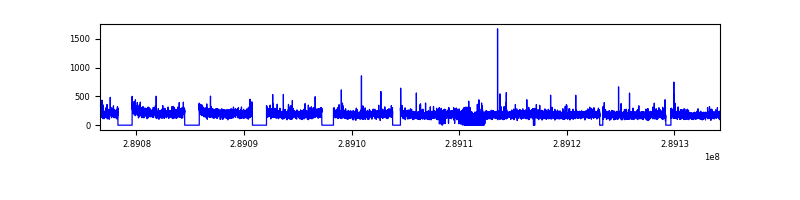 |
| D | 57627 | 50264 | 0 | 0 | 0.00% | 0.00% |  |
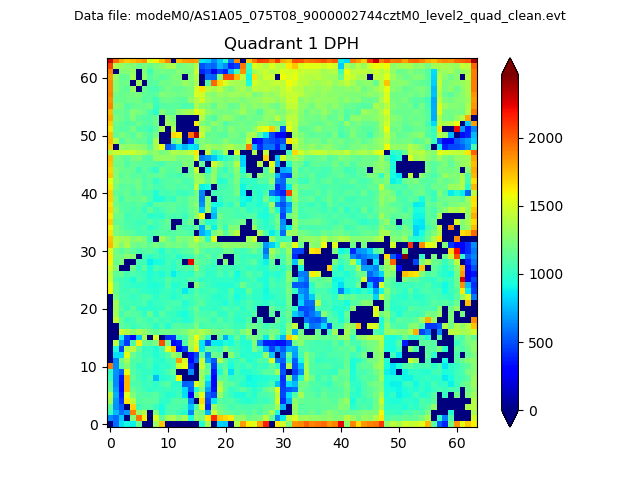
Top three noisy pixels from each quadrant. If the there are fewer than three noisy pixels in the level2.evt file, extra rows are filled as -1
| Pixel properties | Quadrant properties | ||||||
|---|---|---|---|---|---|---|---|
| Quadrant | DetID | PixID | Counts | Sigma | Mean | Median | Sigma |
| A | 0 | 29 | 2440 | 9.06 | 761 | 714 | 190.5 |
| A | 7 | 110 | 2397 | 8.84 | 761 | 714 | 190.5 |
| A | 9 | 19 | 2176 | 7.68 | 761 | 714 | 190.5 |
| B | 2 | 9 | 2405 | 11.03 | 763 | 728 | 152.0 |
| B | 2 | 8 | 1939 | 7.97 | 763 | 728 | 152.0 |
| B | 14 | 254 | 1895 | 7.68 | 763 | 728 | 152.0 |
| C | 12 | 241 | 2107 | 6.87 | 778 | 726 | 201.0 |
| C | 3 | 126 | 2027 | 6.47 | 778 | 726 | 201.0 |
| C | 9 | 242 | 1950 | 6.09 | 778 | 726 | 201.0 |
| D | 3 | 14 | 1930 | 6.53 | 732 | 666 | 193.5 |
| D | 10 | 190 | 1858 | 6.16 | 732 | 666 | 193.5 |
| D | 6 | 231 | 1807 | 5.9 | 732 | 666 | 193.5 |
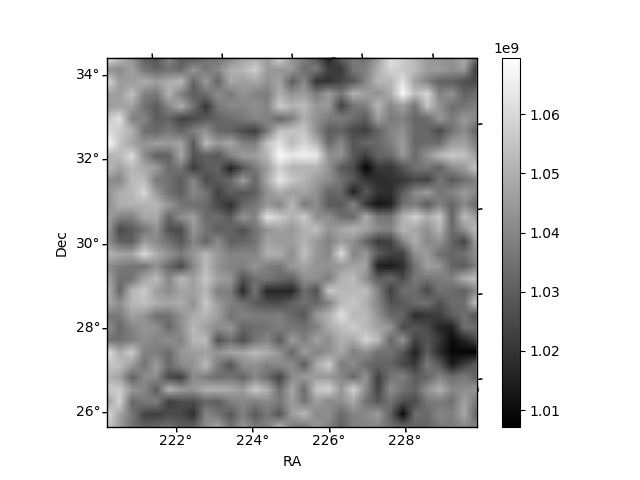
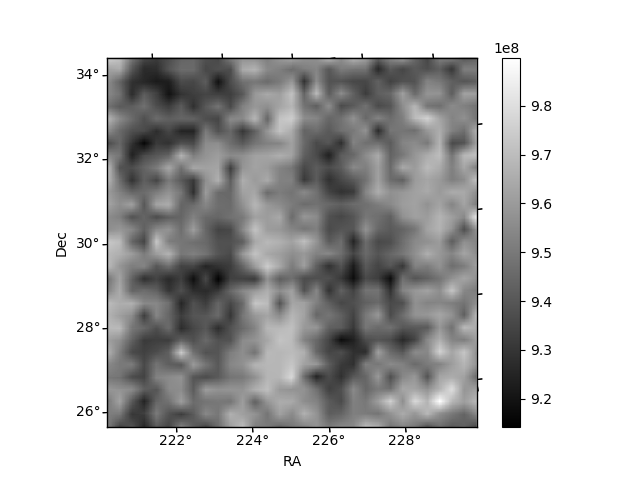
Histogram calculated using DETX and DETY for each event in the final _common_clean file
| Quadrant A | 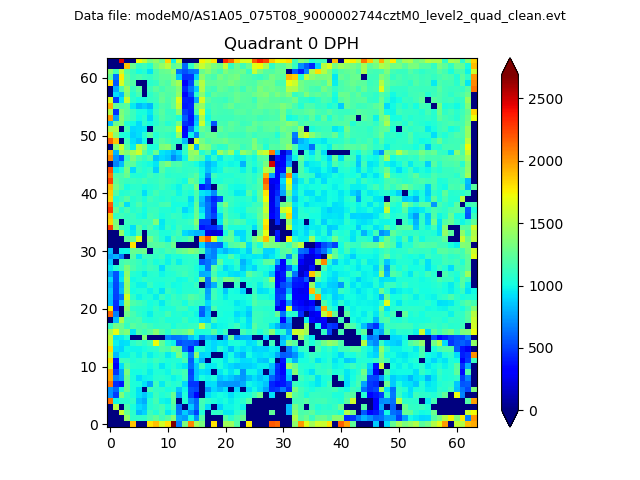 |
 |
Quadrant B |
|---|---|---|---|
| Quadrant D | 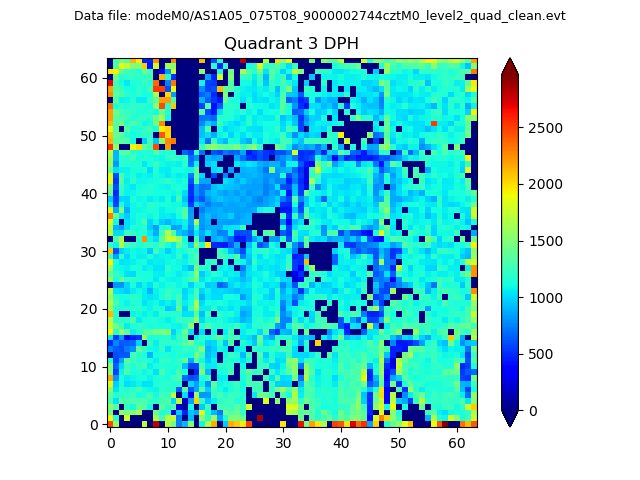 |
 |
Quadrant C |
| Plot type | Count rate plots | Images |
|---|---|---|
| Comparison with Poisson distribution Blue bars denote a histogram of data divided into 1 sec bins. Red curve is a Poisson curve with rate = median count rate of data. |
 |
 |
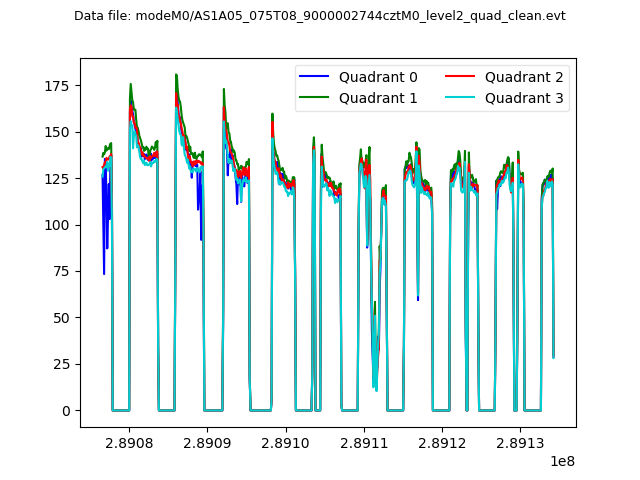
| Quadrant-wise count rates Data is divided into 100 sec bins |
 |
|
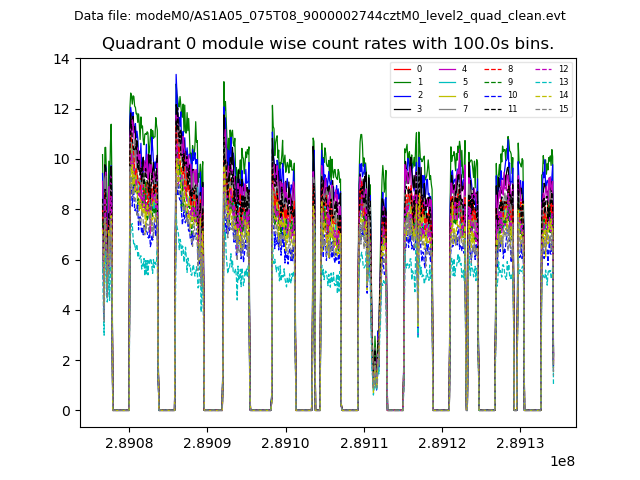
| Module-wise count rates for Quadrant A Data is divided into 100 sec bins |
 |
 |
| Module-wise count rates for Quadrant B Data is divided into 100 sec bins |
 |
 |
| Module-wise count rates for Quadrant C Data is divided into 100 sec bins |
 |
 |
| Module-wise count rates for Quadrant D Data is divided into 100 sec bins |
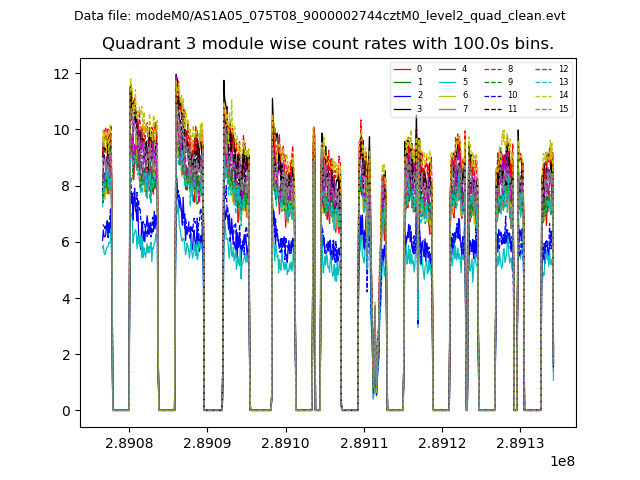 |
 |
| Parameter | Plot |
|---|---|
| CZT HV Monitor |  |
| D_VDD | 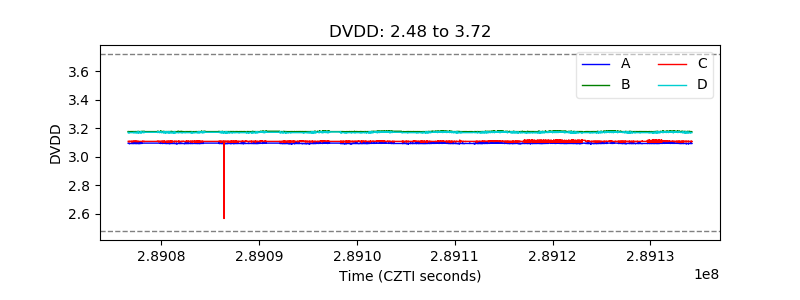 |
| Temperature 1 |  |
| Veto HV Monitor |  |
| Veto LLD |  |
| Alpha Counter |  |
| _CPM_Rate |  |
| CZT Counter |  |
| +2.5 Volts monitor |  |
| +5 Volts monitor |  |
| _ROLL_ROT |  |
| _Roll_DEC | 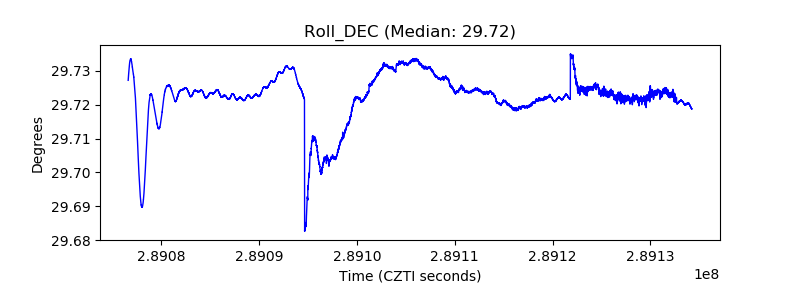 |
| _Roll_RA |  |
| Veto Counter |  |