| Param | Original file | Final file |
|---|---|---|
| Filename | modeM0/AS1A05_075T08_9000002744_18497cztM0_level2.evt | modeM0/AS1A05_075T08_9000002744_18497cztM0_level2_quad_clean.evt |
| Size (bytes) | 268,885,440 | 44,533,440 |
| Size | 256.4 MB | 42.5 MB |
| Events in quadrant A | 2,764,407 | 265,923 |
| Events in quadrant B | 1,624,036 | 304,433 |
| Events in quadrant C | 1,616,717 | 289,812 |
| Events in quadrant D | 1,939,093 | 280,379 |
| Mode M0 | |||
|---|---|---|---|
| Quadrant | BADHDUFLAG | Total packets | Discarded packets |
| A | 0 | 10148 | 1 |
| B | 0 | 6661 | 1 |
| C | 0 | 6669 | 1 |
| D | 0 | 7704 | 1 |
| Mode SS | |||
|---|---|---|---|
| Quadrant | BADHDUFLAG | Total packets | Discarded packets |
| A | 0 | 58 | 0 |
| B | 0 | 58 | 0 |
| C | 0 | 58 | 0 |
| D | 0 | 58 | 0 |
| Mode M9 | |||
|---|---|---|---|
| Quadrant | BADHDUFLAG | Total packets | Discarded packets |
| A | 0 | 14 | 0 |
| B | 0 | 14 | 0 |
| C | 0 | 14 | 0 |
| D | 0 | 14 | 0 |
| Quadrant | Total seconds | Saturated seconds | Saturation percentage |
|---|---|---|---|
| A | 2916 | 492 | 16.872428% |
| B | 2916 | 43 | 1.474623% |
| C | 2916 | 63 | 2.160494% |
| D | 2916 | 85 | 2.914952% |
Noise dominated data is calculated using 1-second bins in cleaned event files. If a bin has >2000 counts, and if more than 50% of those come from <1% of pixels, then it is considered to be noise-dominated and hence unusable.
| Quadrant | # 1 sec bins | Bins with >0 counts | Bins with >2000 counts | High rate bins dominated by noise | Noise dominated (total time) | Noise dominated (detector-on time) | Marked lightcurve |
|---|---|---|---|---|---|---|---|
| A | 4241 | 2917 | 382 | 382 | 9.01% | 13.10% | 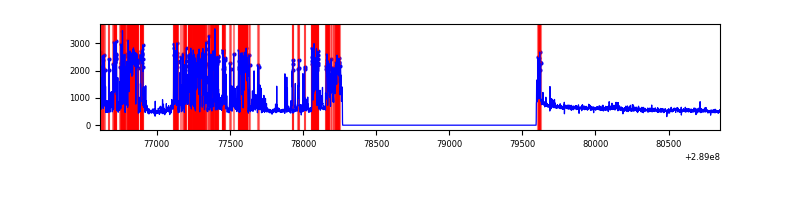 |
| B | 4241 | 2917 | 0 | 0 | 0.00% | 0.00% | 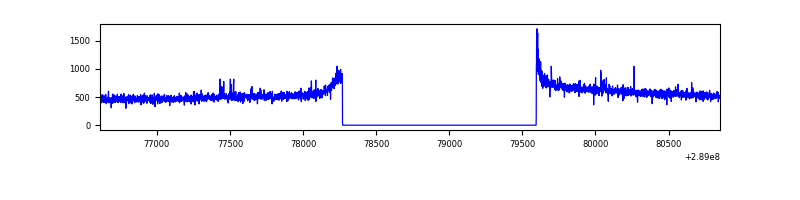 |
| C | 4241 | 2917 | 0 | 0 | 0.00% | 0.00% | 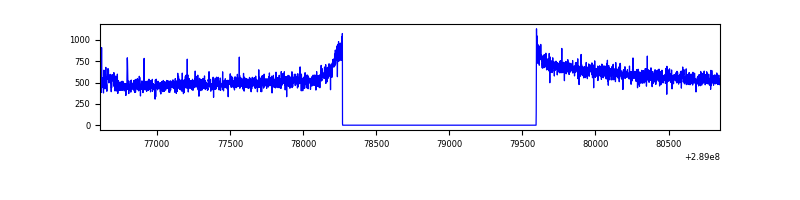 |
| D | 4241 | 2917 | 62 | 62 | 1.46% | 2.13% | 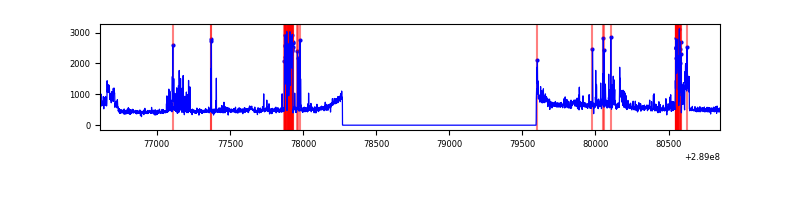 |
Top three noisy pixels from each quadrant. If the there are fewer than three noisy pixels in the level2.evt file, extra rows are filled as -1
| Pixel properties | Quadrant properties | ||||||
|---|---|---|---|---|---|---|---|
| Quadrant | DetID | PixID | Counts | Sigma | Mean | Median | Sigma |
| A | 0 | 13 | 1287519 | 16754.22 | 377 | 370 | 76.8 |
| A | 15 | 192 | 21962 | 281.05 | 377 | 370 | 76.8 |
| A | 13 | 254 | 3797 | 44.61 | 377 | 370 | 76.8 |
| B | 12 | 111 | 8973 | 108.7 | 410 | 400 | 78.9 |
| B | 11 | 111 | 7638 | 91.77 | 410 | 400 | 78.9 |
| B | 10 | 245 | 7420 | 89.01 | 410 | 400 | 78.9 |
| C | 14 | 238 | 62069 | 662.23 | 395 | 399 | 93.1 |
| C | 7 | 247 | 9234 | 94.87 | 395 | 399 | 93.1 |
| C | 3 | 233 | 3600 | 34.37 | 395 | 399 | 93.1 |
| D | 1 | 52 | 200586 | 2075.06 | 396 | 385 | 96.5 |
| D | 7 | 238 | 180040 | 1862.11 | 396 | 385 | 96.5 |
| D | 7 | 223 | 56696 | 583.66 | 396 | 385 | 96.5 |
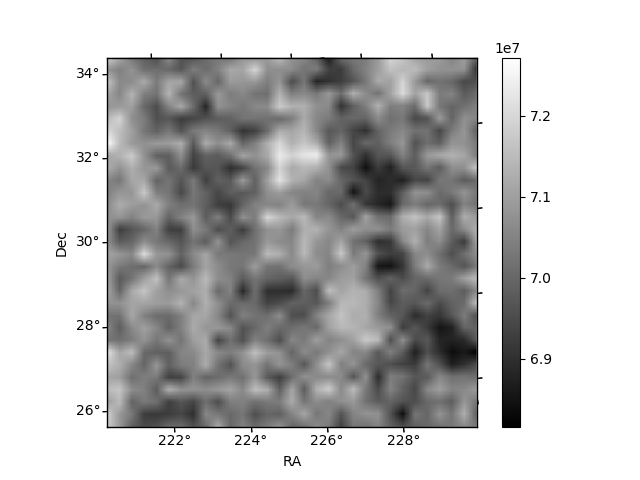
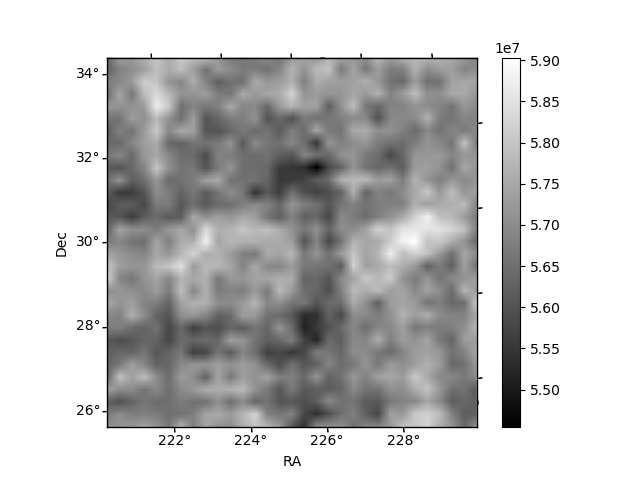
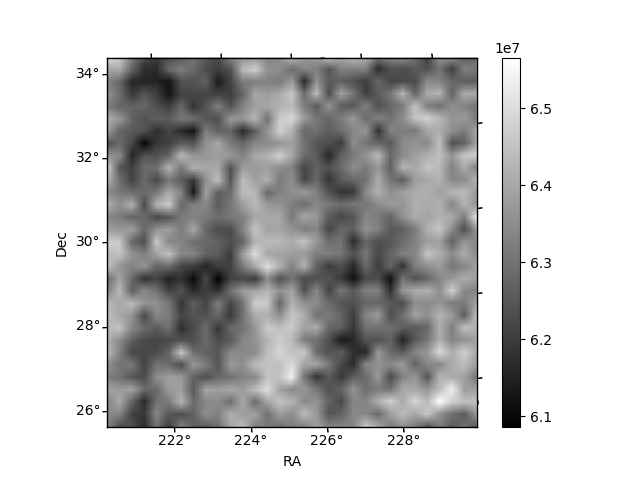
Histogram calculated using DETX and DETY for each event in the final _common_clean file
| Quadrant A | 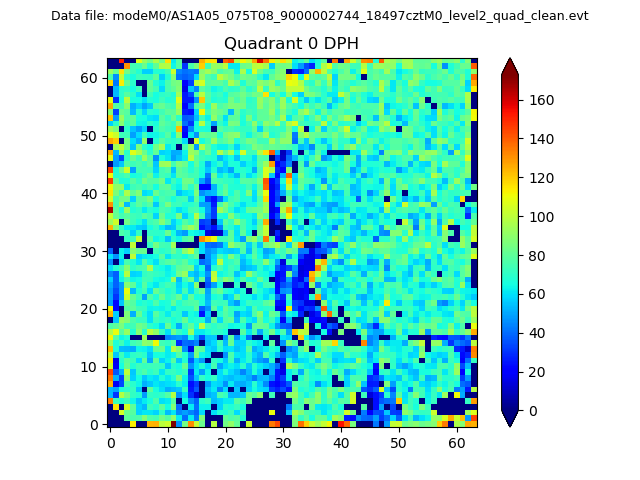 |
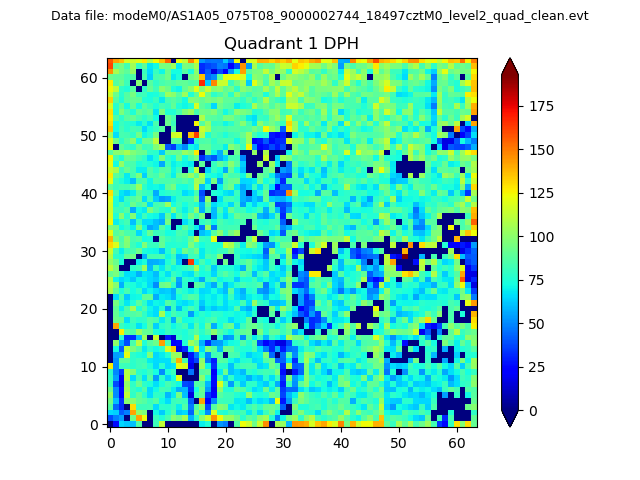 |
Quadrant B |
|---|---|---|---|
| Quadrant D | 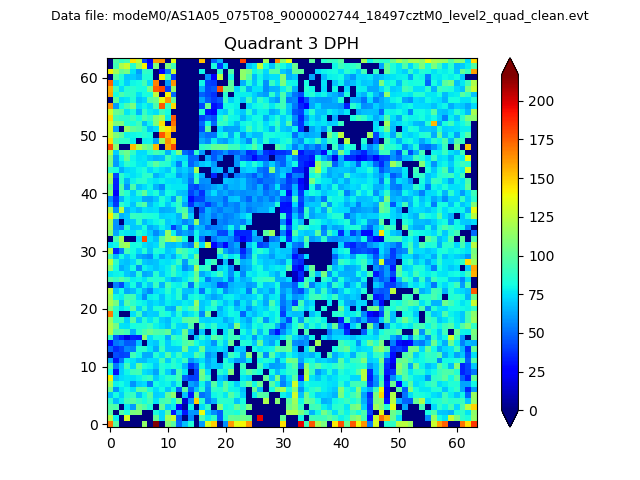 |
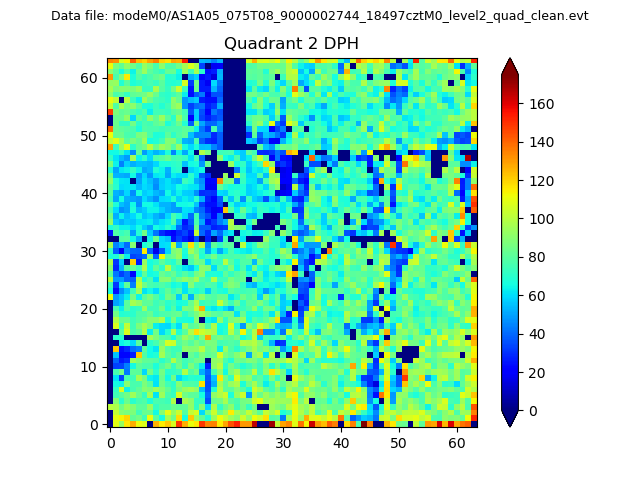 |
Quadrant C |
| Plot type | Count rate plots | Images |
|---|---|---|
| Comparison with Poisson distribution Blue bars denote a histogram of data divided into 1 sec bins. Red curve is a Poisson curve with rate = median count rate of data. |
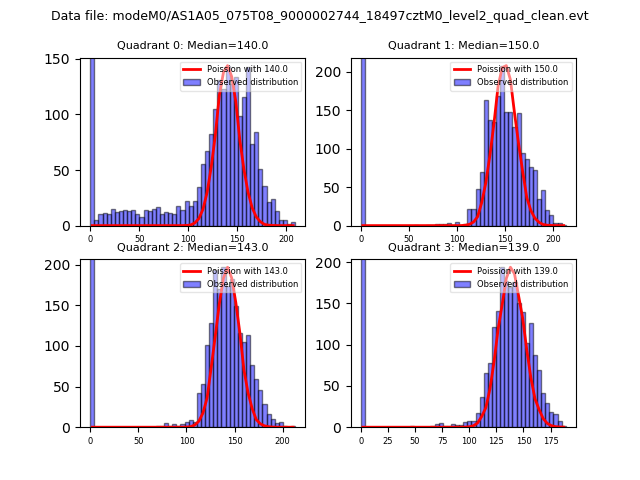 |
 |
| Quadrant-wise count rates Data is divided into 100 sec bins |
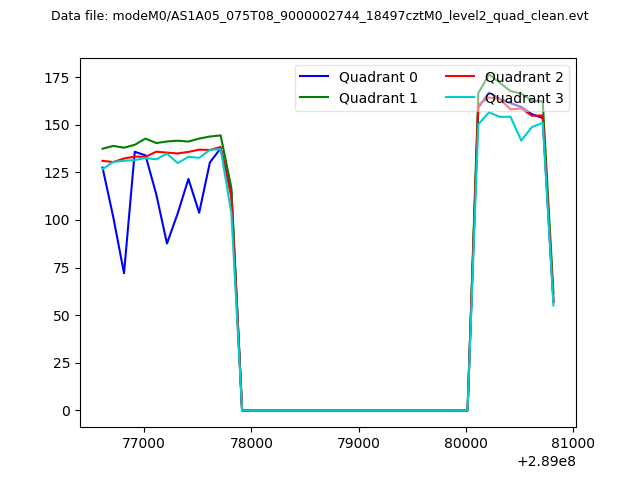 |
|
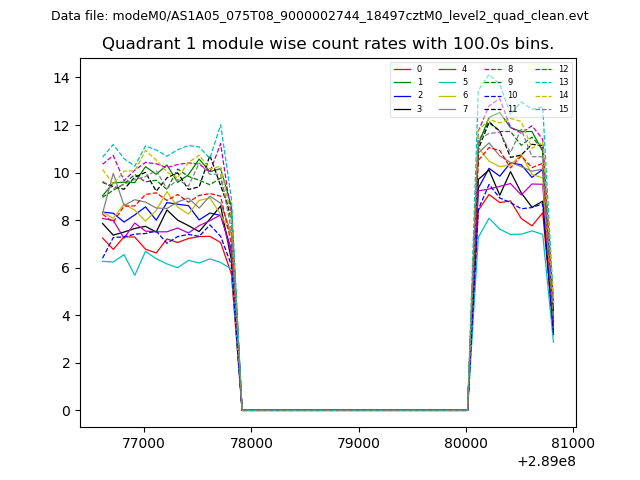
| Module-wise count rates for Quadrant A Data is divided into 100 sec bins |
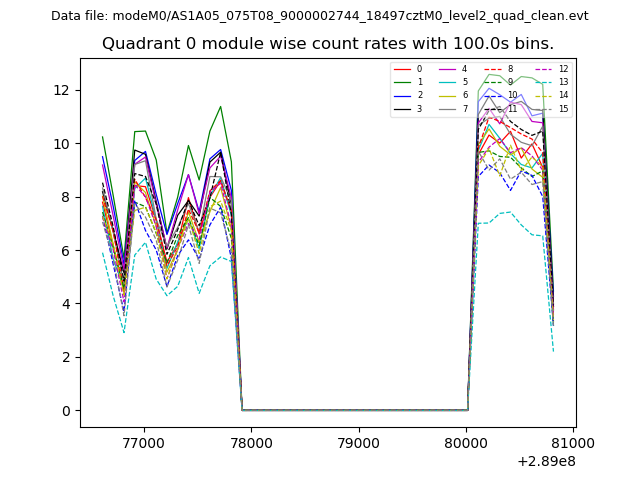 |
 |
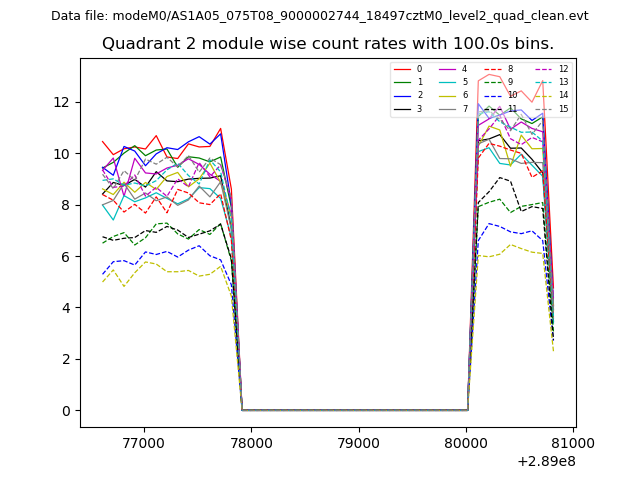
| Module-wise count rates for Quadrant B Data is divided into 100 sec bins |
 |
 |
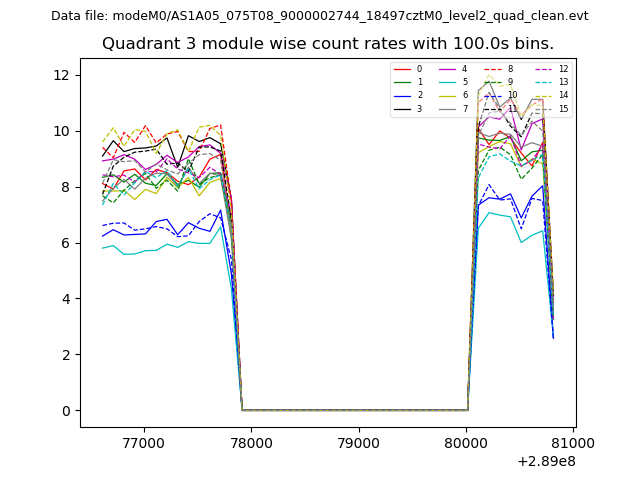
| Module-wise count rates for Quadrant C Data is divided into 100 sec bins |
 |
 |
| Module-wise count rates for Quadrant D Data is divided into 100 sec bins |
 |
 |
| Parameter | Plot |
|---|---|
| CZT HV Monitor | 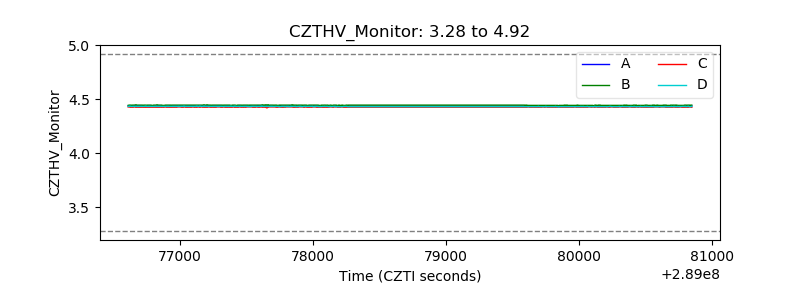 |
| D_VDD | 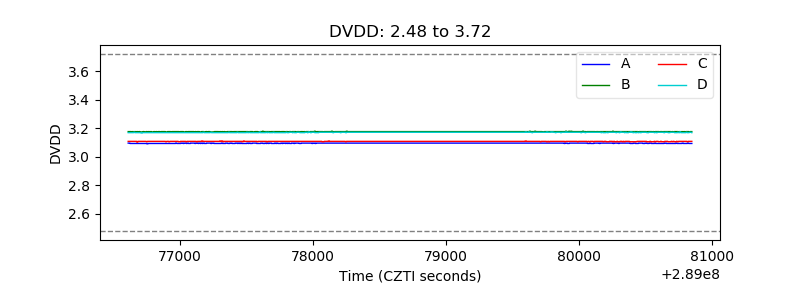 |
| Temperature 1 | 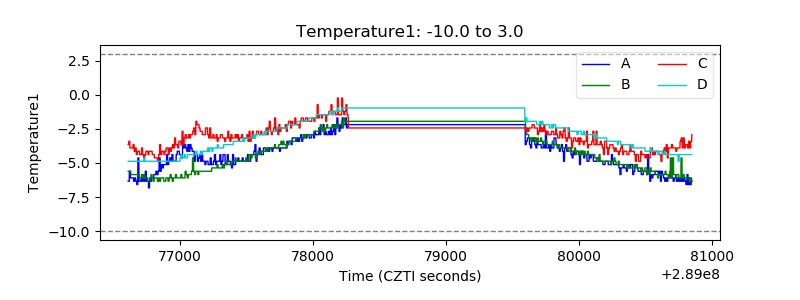 |
| Veto HV Monitor | 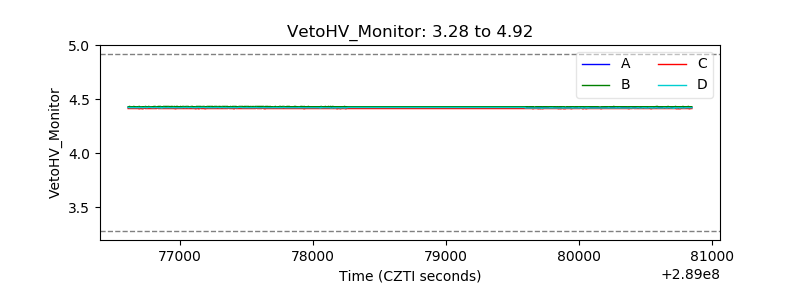 |
| Veto LLD | 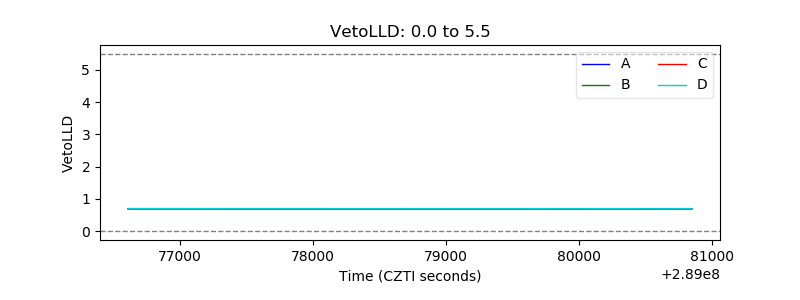 |
| Alpha Counter | 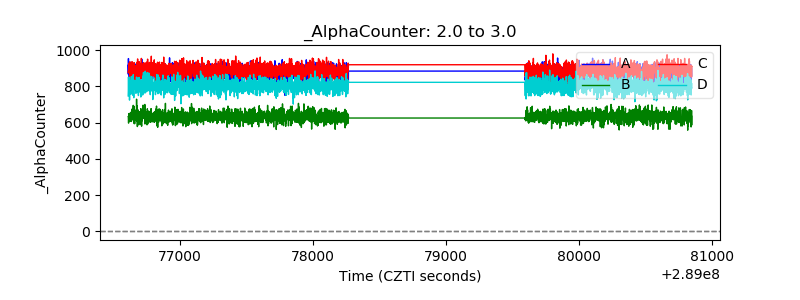 |
| _CPM_Rate | 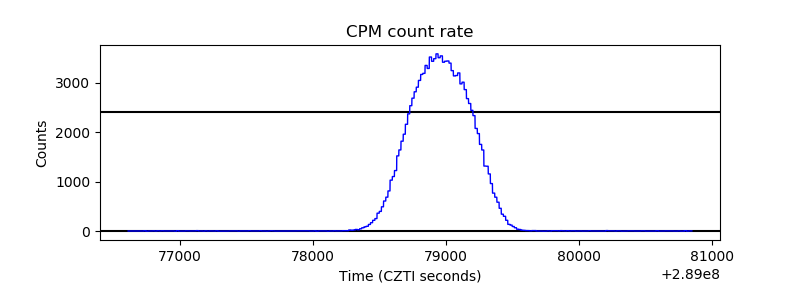 |
| CZT Counter |  |
| +2.5 Volts monitor |  |
| +5 Volts monitor |  |
| _ROLL_ROT | 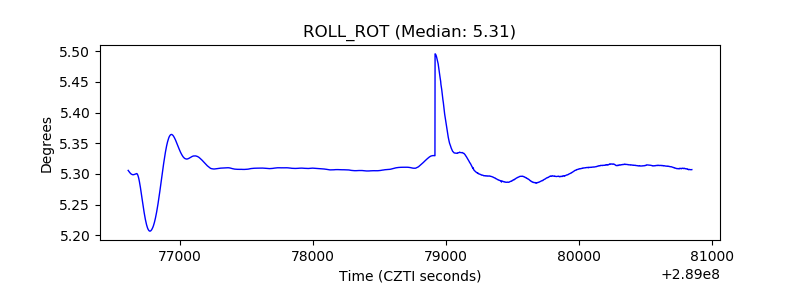 |
| _Roll_DEC | 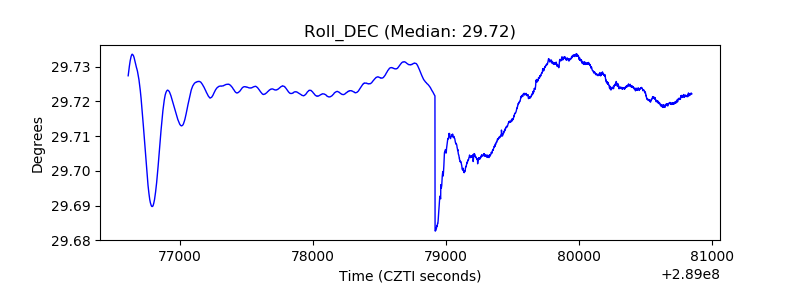 |
| _Roll_RA |  |
| Veto Counter | 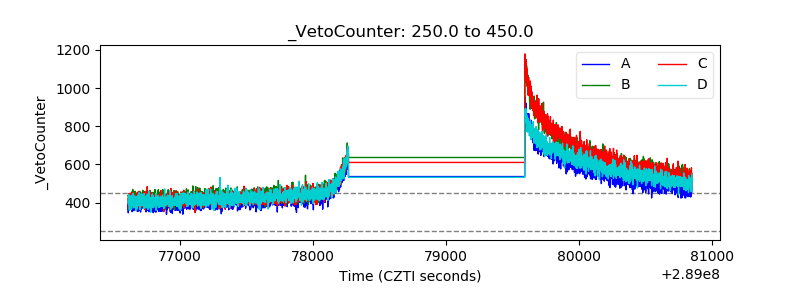 |