| Param | Original file | Final file |
|---|---|---|
| Filename | modeM0/AS1A05_075T08_9000002744_18501cztM0_level2.evt | modeM0/AS1A05_075T08_9000002744_18501cztM0_level2_quad_clean.evt |
| Size (bytes) | 534,686,400 | 100,805,760 |
| Size | 509.9 MB | 96.1 MB |
| Events in quadrant A | 4,445,845 | 635,671 |
| Events in quadrant B | 4,096,636 | 657,868 |
| Events in quadrant C | 3,448,227 | 636,938 |
| Events in quadrant D | 3,710,993 | 618,174 |
| Mode M0 | |||
|---|---|---|---|
| Quadrant | BADHDUFLAG | Total packets | Discarded packets |
| A | 0 | 18159 | 2 |
| B | 0 | 17124 | 2 |
| C | 0 | 15019 | 2 |
| D | 0 | 16264 | 2 |
| Mode SS | |||
|---|---|---|---|
| Quadrant | BADHDUFLAG | Total packets | Discarded packets |
| A | 0 | 148 | 0 |
| B | 0 | 148 | 0 |
| C | 0 | 148 | 0 |
| D | 0 | 148 | 0 |
| Mode M9 | |||
|---|---|---|---|
| Quadrant | BADHDUFLAG | Total packets | Discarded packets |
| A | 0 | 17 | 0 |
| B | 0 | 18 | 0 |
| C | 0 | 18 | 0 |
| D | 0 | 18 | 0 |
| Quadrant | Total seconds | Saturated seconds | Saturation percentage |
|---|---|---|---|
| A | 7243 | 327 | 4.514704% |
| B | 7243 | 182 | 2.512771% |
| C | 7243 | 82 | 1.132128% |
| D | 7242 | 101 | 1.394642% |
Noise dominated data is calculated using 1-second bins in cleaned event files. If a bin has >2000 counts, and if more than 50% of those come from <1% of pixels, then it is considered to be noise-dominated and hence unusable.
| Quadrant | # 1 sec bins | Bins with >0 counts | Bins with >2000 counts | High rate bins dominated by noise | Noise dominated (total time) | Noise dominated (detector-on time) | Marked lightcurve |
|---|---|---|---|---|---|---|---|
| A | 7973 | 7243 | 182 | 182 | 2.28% | 2.51% | 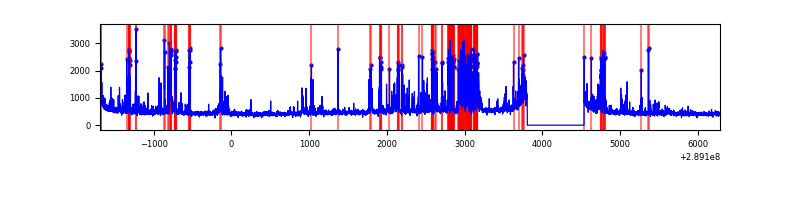 |
| B | 7973 | 7243 | 49 | 49 | 0.61% | 0.68% | 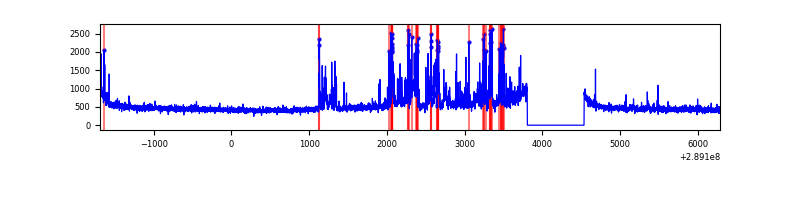 |
| C | 7973 | 7243 | 0 | 0 | 0.00% | 0.00% | 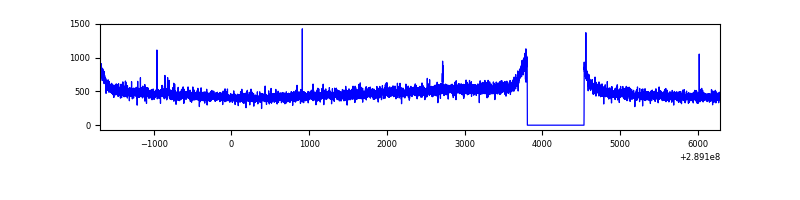 |
| D | 7972 | 7243 | 34 | 34 | 0.43% | 0.47% | 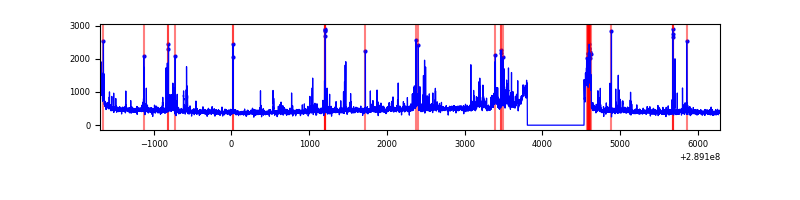 |
Top three noisy pixels from each quadrant. If the there are fewer than three noisy pixels in the level2.evt file, extra rows are filled as -1
| Pixel properties | Quadrant properties | ||||||
|---|---|---|---|---|---|---|---|
| Quadrant | DetID | PixID | Counts | Sigma | Mean | Median | Sigma |
| A | 0 | 13 | 1077632 | 6167.02 | 862 | 844 | 174.6 |
| A | 14 | 111 | 26450 | 146.65 | 862 | 844 | 174.6 |
| A | 15 | 192 | 14123 | 76.05 | 862 | 844 | 174.6 |
| B | 10 | 245 | 637861 | 3767.75 | 879 | 857 | 169.1 |
| B | 12 | 111 | 20065 | 113.61 | 879 | 857 | 169.1 |
| B | 11 | 111 | 16998 | 95.47 | 879 | 857 | 169.1 |
| C | 14 | 238 | 131996 | 660.27 | 845 | 851 | 198.6 |
| C | 3 | 233 | 10406 | 48.11 | 845 | 851 | 198.6 |
| C | 9 | 54 | 7061 | 31.27 | 845 | 851 | 198.6 |
| D | 7 | 238 | 256682 | 1243.98 | 848 | 824 | 205.7 |
| D | 12 | 110 | 100417 | 484.22 | 848 | 824 | 205.7 |
| D | 7 | 38 | 62396 | 299.36 | 848 | 824 | 205.7 |
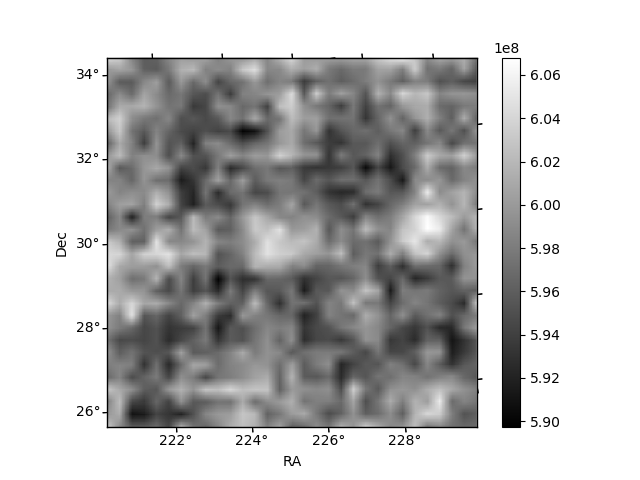
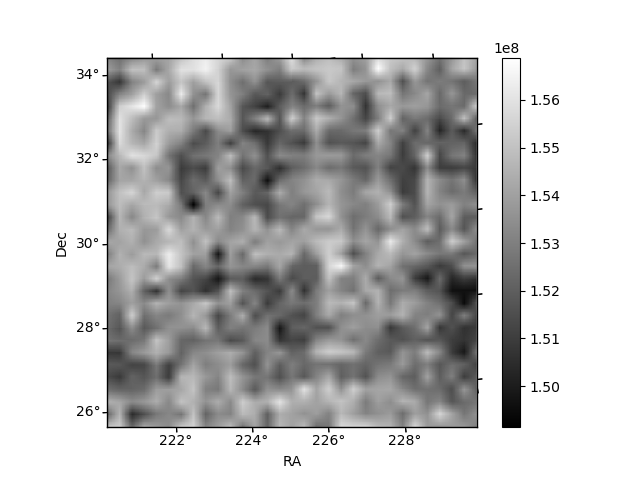
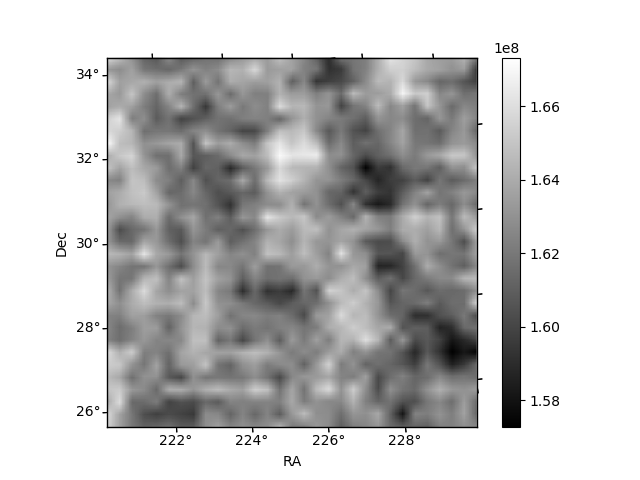
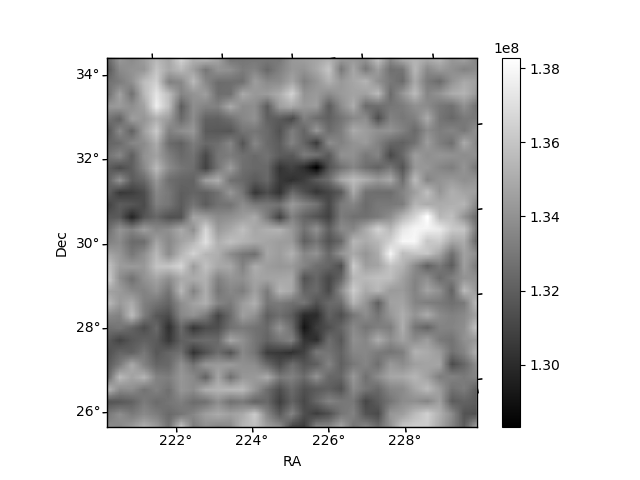
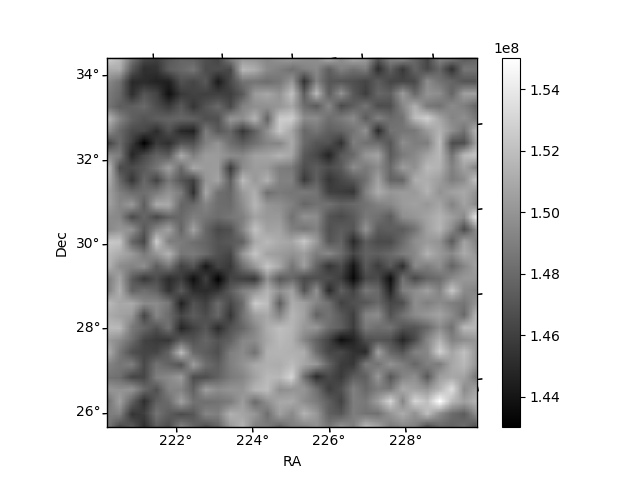
Histogram calculated using DETX and DETY for each event in the final _common_clean file
| Quadrant A | 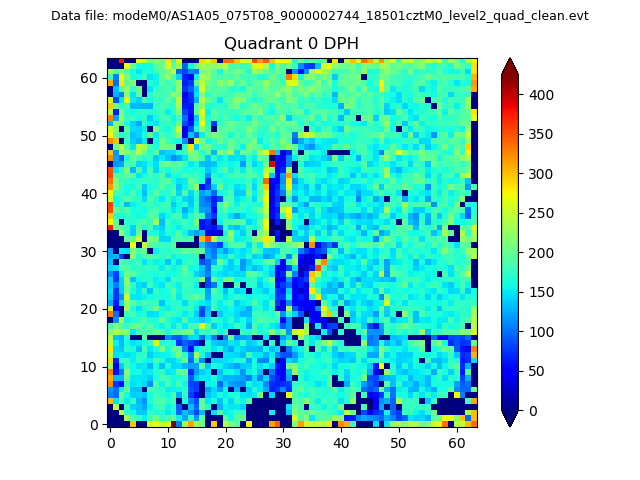 |
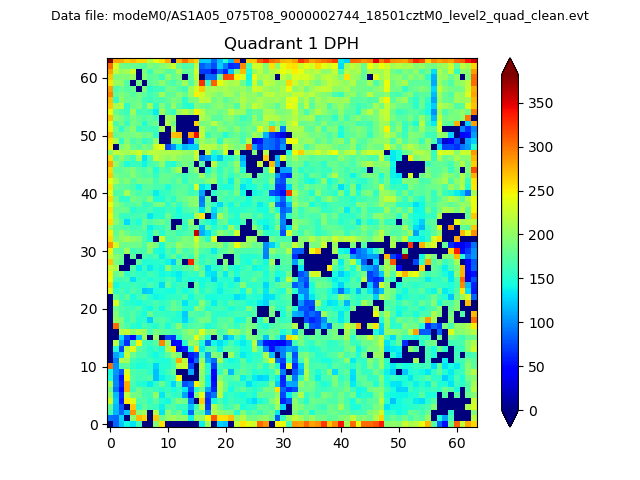 |
Quadrant B |
|---|---|---|---|
| Quadrant D | 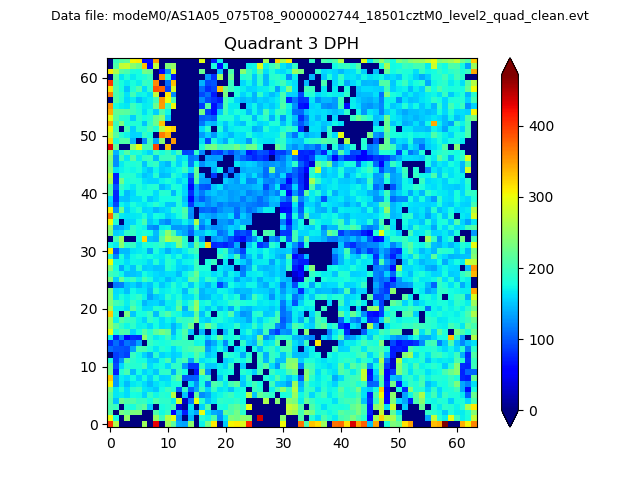 |
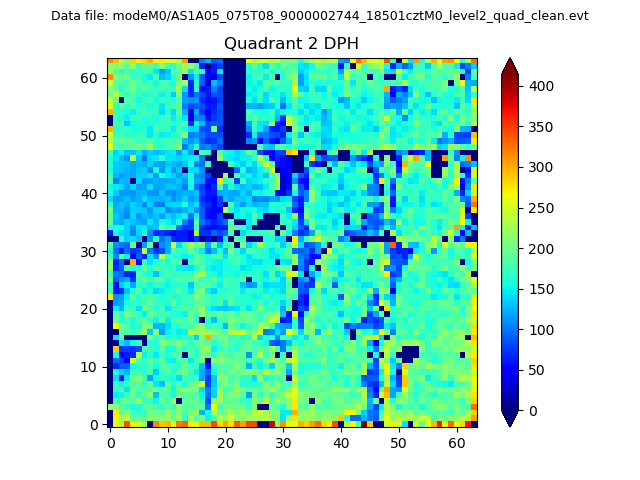 |
Quadrant C |
| Plot type | Count rate plots | Images |
|---|---|---|
| Comparison with Poisson distribution Blue bars denote a histogram of data divided into 1 sec bins. Red curve is a Poisson curve with rate = median count rate of data. |
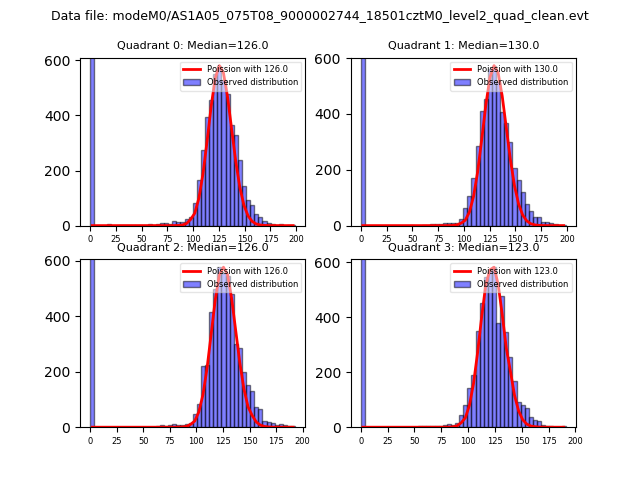 |
 |
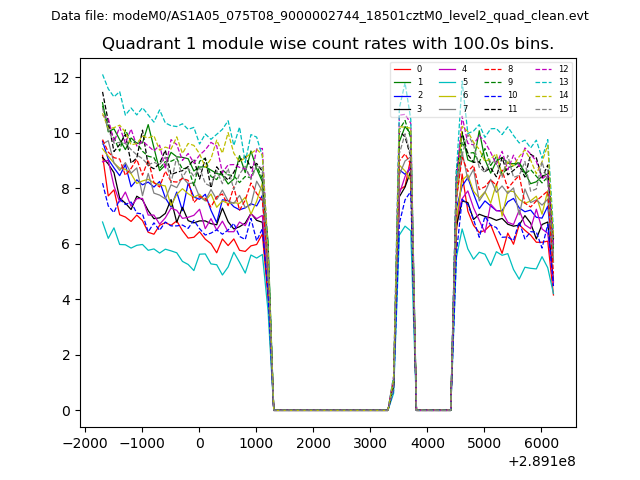
| Quadrant-wise count rates Data is divided into 100 sec bins |
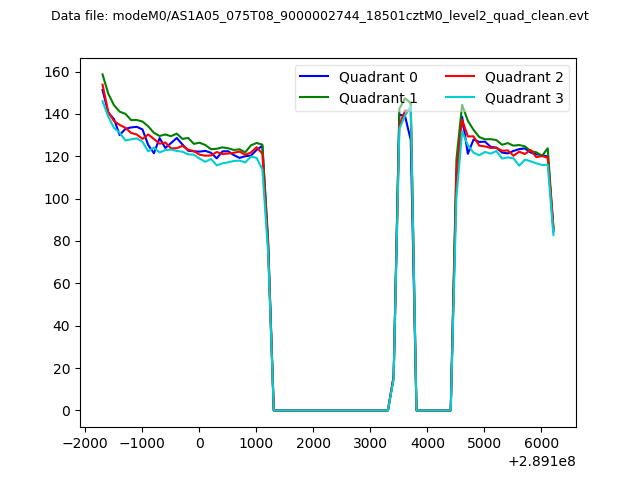 |
|
| Module-wise count rates for Quadrant A Data is divided into 100 sec bins |
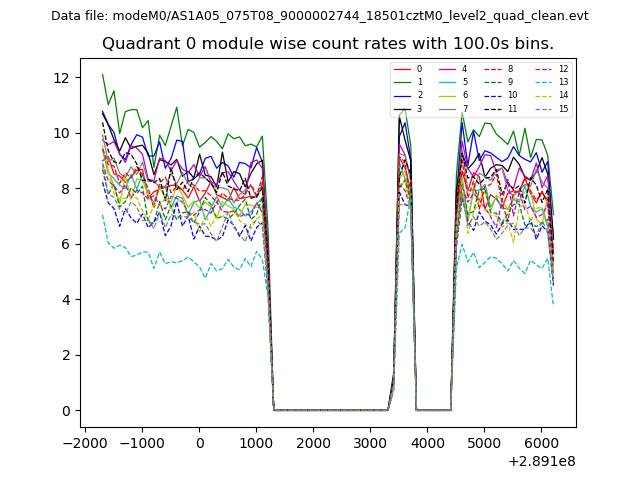 |
 |
| Module-wise count rates for Quadrant B Data is divided into 100 sec bins |
 |
 |
| Module-wise count rates for Quadrant C Data is divided into 100 sec bins |
 |
 |
| Module-wise count rates for Quadrant D Data is divided into 100 sec bins |
 |
 |
| Parameter | Plot |
|---|---|
| CZT HV Monitor |  |
| D_VDD | 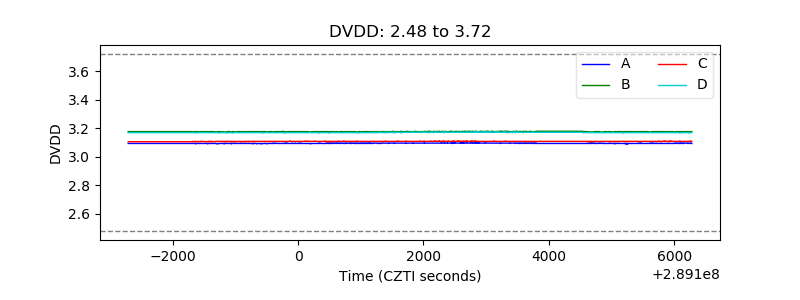 |
| Temperature 1 | 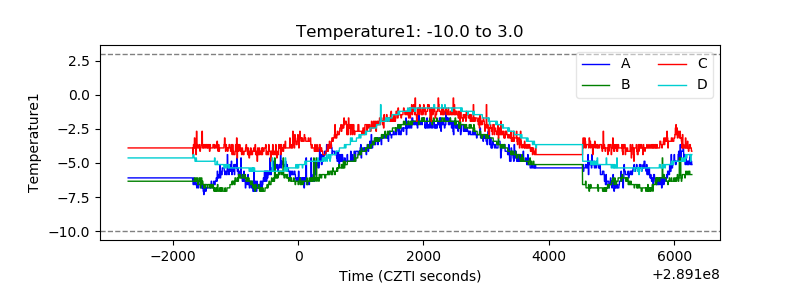 |
| Veto HV Monitor | 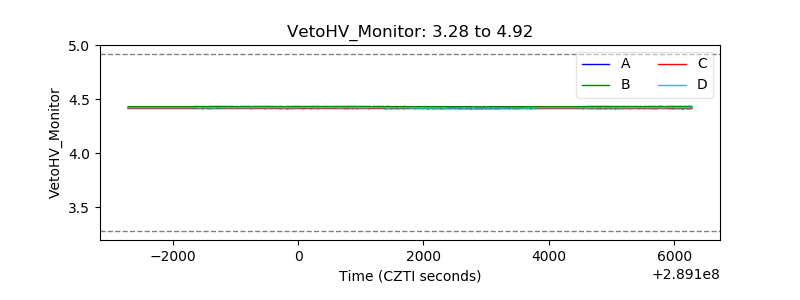 |
| Veto LLD |  |
| Alpha Counter | 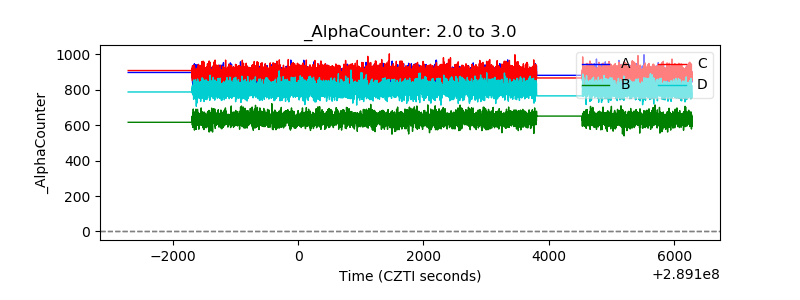 |
| _CPM_Rate | 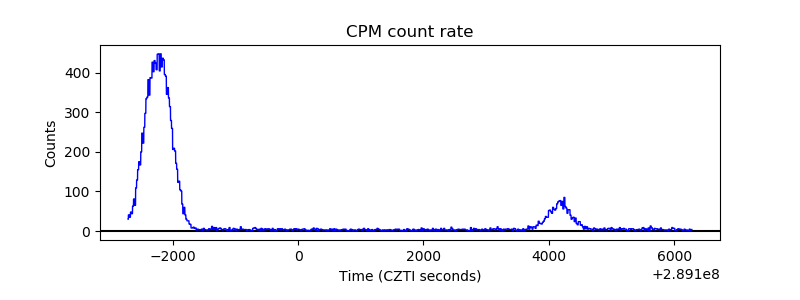 |
| CZT Counter | 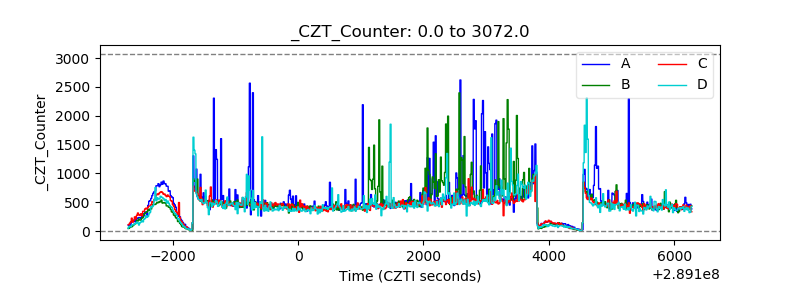 |
| +2.5 Volts monitor |  |
| +5 Volts monitor |  |
| _ROLL_ROT |  |
| _Roll_DEC | 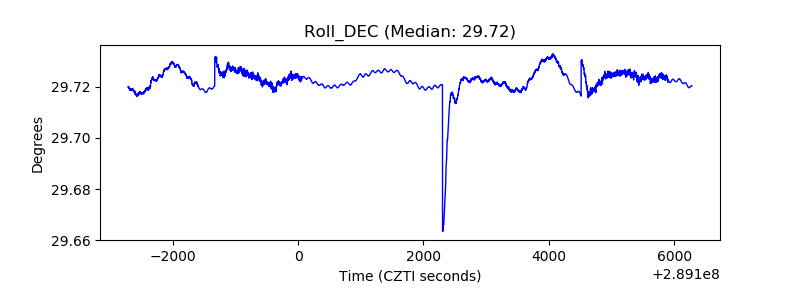 |
| _Roll_RA | 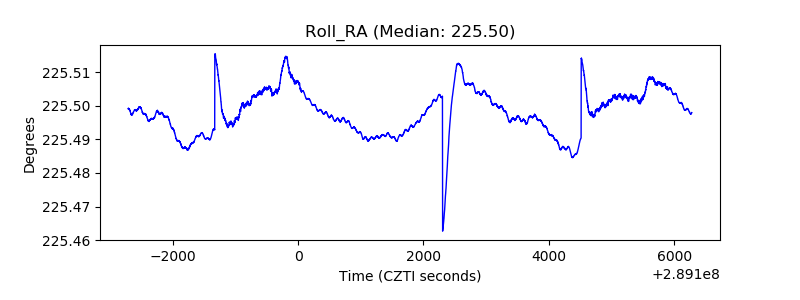 |
| Veto Counter | 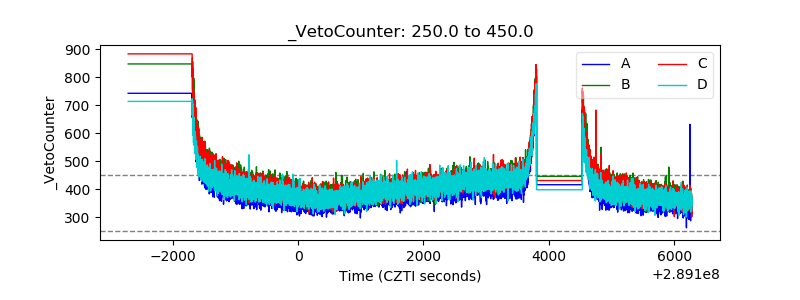 |