| Param | Original file | Final file |
|---|---|---|
| Filename | modeM0/AS1A05_075T08_9000002744_18503cztM0_level2.evt | modeM0/AS1A05_075T08_9000002744_18503cztM0_level2_quad_clean.evt |
| Size (bytes) | 582,410,880 | 121,184,640 |
| Size | 555.4 MB | 115.6 MB |
| Events in quadrant A | 4,523,060 | 765,765 |
| Events in quadrant B | 4,372,674 | 795,557 |
| Events in quadrant C | 4,096,144 | 771,412 |
| Events in quadrant D | 4,077,056 | 754,736 |
| Mode M0 | |||
|---|---|---|---|
| Quadrant | BADHDUFLAG | Total packets | Discarded packets |
| A | 0 | 18961 | 3 |
| B | 0 | 18504 | 3 |
| C | 0 | 17730 | 3 |
| D | 0 | 18111 | 3 |
| Mode SS | |||
|---|---|---|---|
| Quadrant | BADHDUFLAG | Total packets | Discarded packets |
| A | 0 | 170 | 0 |
| B | 0 | 170 | 0 |
| C | 0 | 170 | 0 |
| D | 0 | 170 | 0 |
| Mode M9 | |||
|---|---|---|---|
| Quadrant | BADHDUFLAG | Total packets | Discarded packets |
| A | 0 | 1 | 0 |
| B | 0 | 1 | 0 |
| C | 0 | 1 | 0 |
| D | 0 | 1 | 0 |
| Quadrant | Total seconds | Saturated seconds | Saturation percentage |
|---|---|---|---|
| A | 8380 | 500 | 5.966587% |
| B | 8380 | 474 | 5.656325% |
| C | 8380 | 361 | 4.307876% |
| D | 8380 | 288 | 3.436754% |
Noise dominated data is calculated using 1-second bins in cleaned event files. If a bin has >2000 counts, and if more than 50% of those come from <1% of pixels, then it is considered to be noise-dominated and hence unusable.
| Quadrant | # 1 sec bins | Bins with >0 counts | Bins with >2000 counts | High rate bins dominated by noise | Noise dominated (total time) | Noise dominated (detector-on time) | Marked lightcurve |
|---|---|---|---|---|---|---|---|
| A | 8510 | 8383 | 50 | 50 | 0.59% | 0.60% | 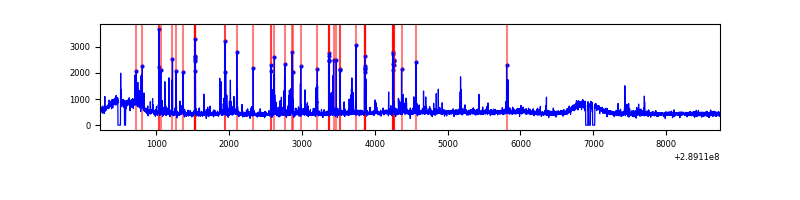 |
| B | 8510 | 8383 | 46 | 46 | 0.54% | 0.55% | 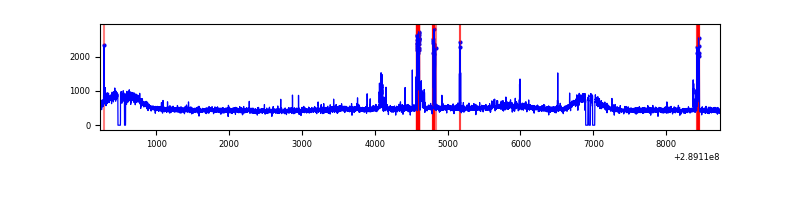 |
| C | 8510 | 8384 | 1 | 1 | 0.01% | 0.01% | 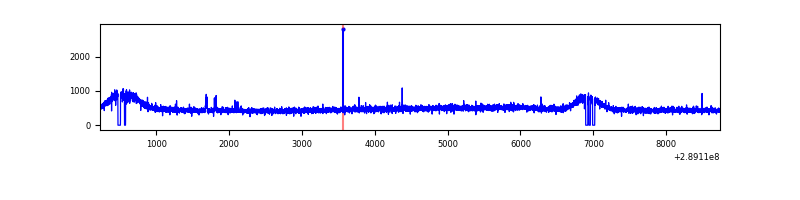 |
| D | 8510 | 8385 | 25 | 25 | 0.29% | 0.30% | 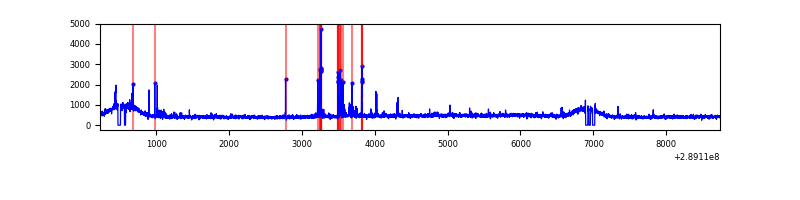 |
Top three noisy pixels from each quadrant. If the there are fewer than three noisy pixels in the level2.evt file, extra rows are filled as -1
| Pixel properties | Quadrant properties | ||||||
|---|---|---|---|---|---|---|---|
| Quadrant | DetID | PixID | Counts | Sigma | Mean | Median | Sigma |
| A | 0 | 13 | 488884 | 2294.71 | 1040 | 1015 | 212.6 |
| A | 15 | 192 | 16507 | 72.87 | 1040 | 1015 | 212.6 |
| A | 13 | 254 | 11026 | 47.09 | 1040 | 1015 | 212.6 |
| B | 10 | 245 | 232813 | 1133.05 | 1041 | 1011 | 204.6 |
| B | 7 | 220 | 25737 | 120.86 | 1041 | 1011 | 204.6 |
| B | 12 | 111 | 24981 | 117.16 | 1041 | 1011 | 204.6 |
| C | 14 | 238 | 155582 | 653.06 | 1001 | 1007 | 236.7 |
| C | 3 | 233 | 24303 | 98.42 | 1001 | 1007 | 236.7 |
| C | 13 | 61 | 7282 | 26.51 | 1001 | 1007 | 236.7 |
| D | 7 | 238 | 137013 | 540.48 | 1019 | 987 | 251.7 |
| D | 2 | 234 | 33620 | 129.66 | 1019 | 987 | 251.7 |
| D | 7 | 38 | 27230 | 104.27 | 1019 | 987 | 251.7 |
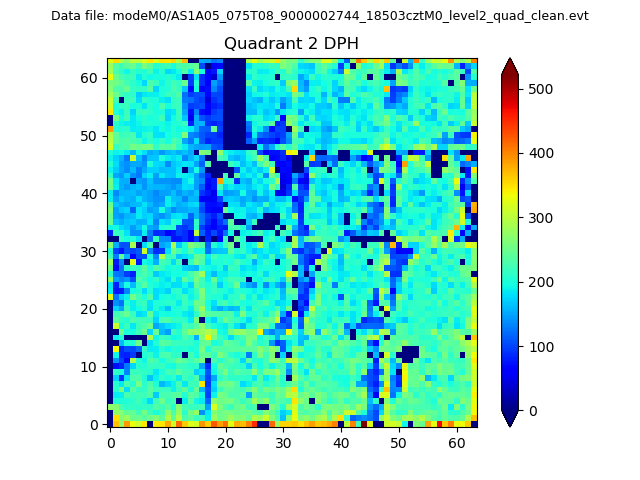
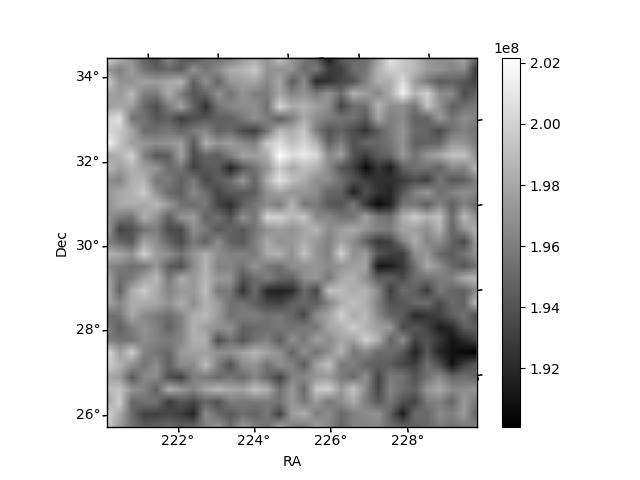
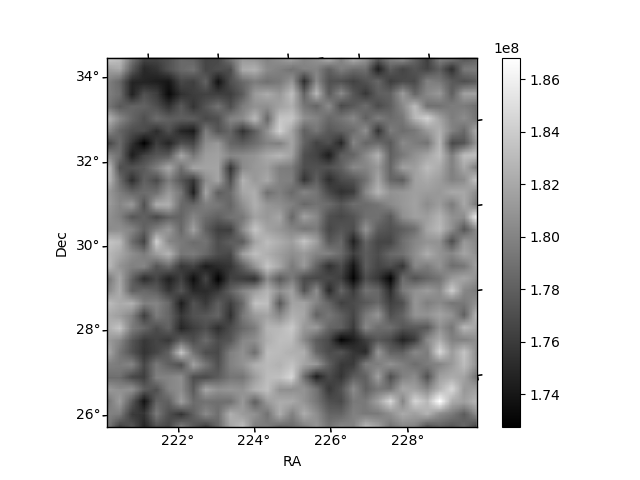
Histogram calculated using DETX and DETY for each event in the final _common_clean file
| Quadrant A | 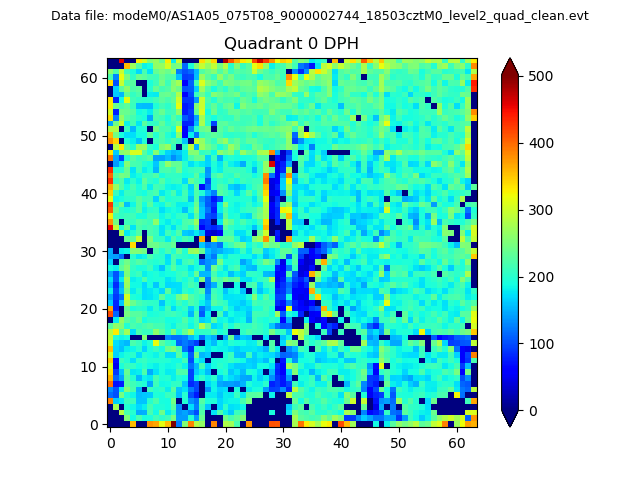 |
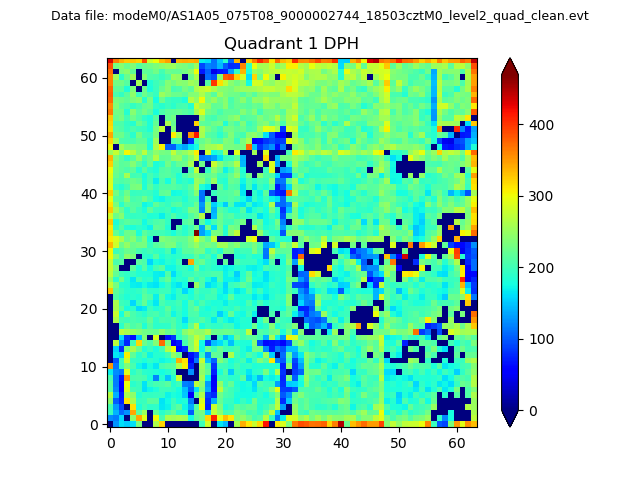 |
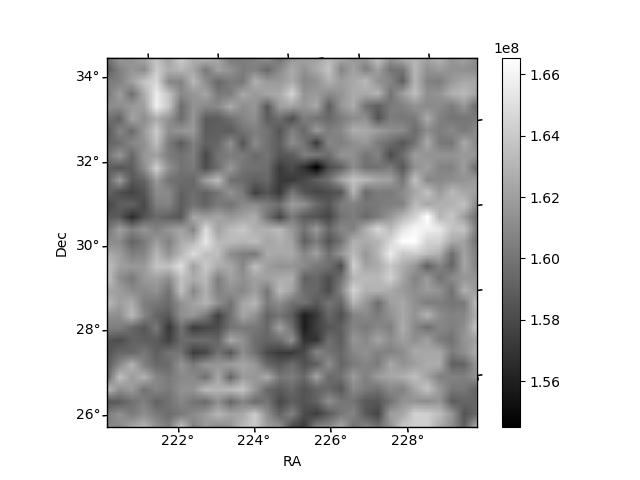
Quadrant B |
|---|---|---|---|
| Quadrant D | 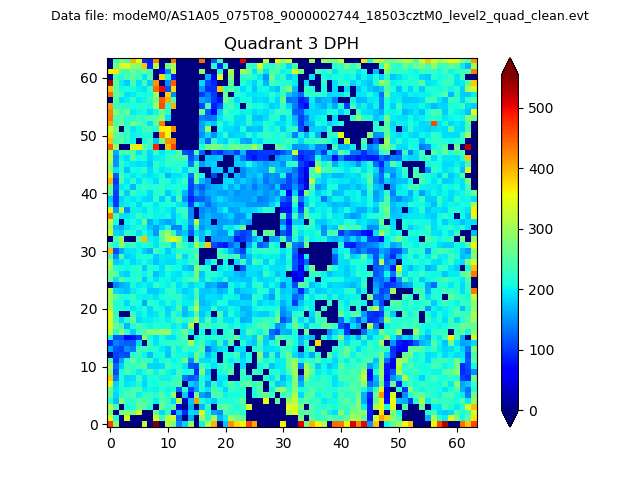 |
 |
Quadrant C |
| Plot type | Count rate plots | Images |
|---|---|---|
| Comparison with Poisson distribution Blue bars denote a histogram of data divided into 1 sec bins. Red curve is a Poisson curve with rate = median count rate of data. |
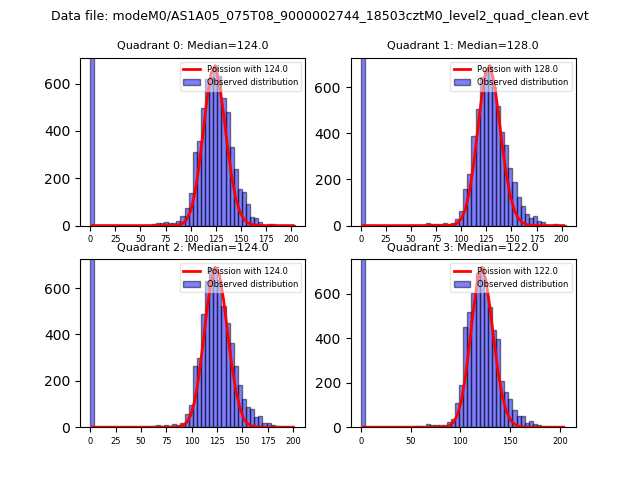 |
 |
| Quadrant-wise count rates Data is divided into 100 sec bins |
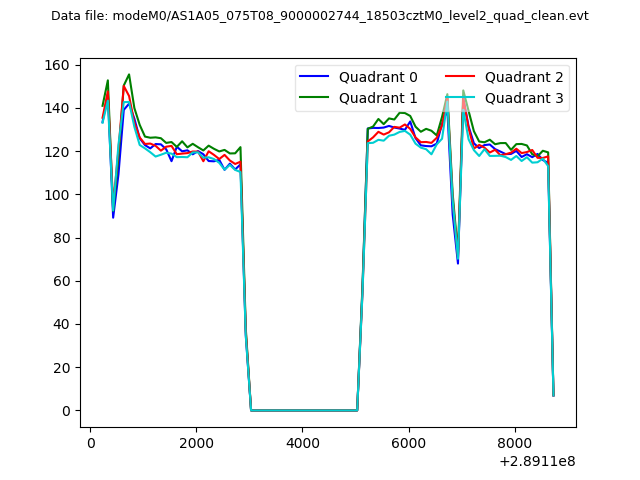 |
|
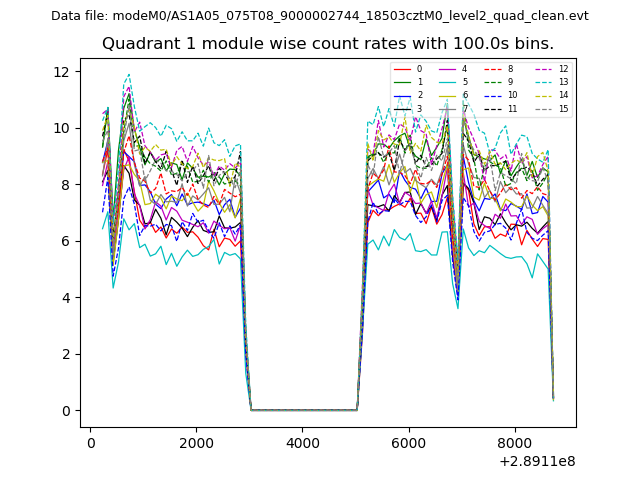
| Module-wise count rates for Quadrant A Data is divided into 100 sec bins |
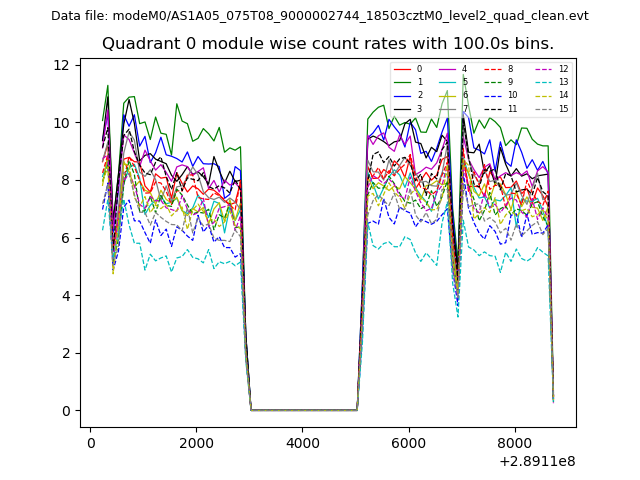 |
 |
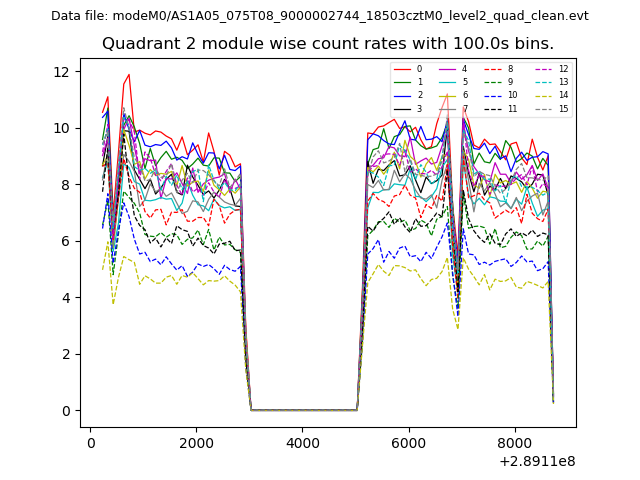
| Module-wise count rates for Quadrant B Data is divided into 100 sec bins |
 |
 |
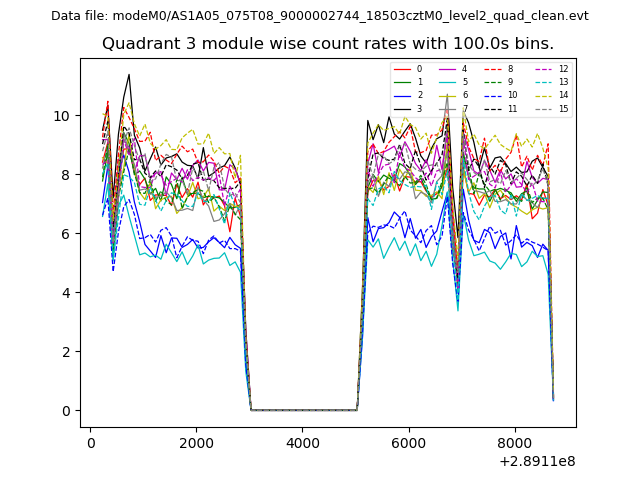
| Module-wise count rates for Quadrant C Data is divided into 100 sec bins |
 |
 |
| Module-wise count rates for Quadrant D Data is divided into 100 sec bins |
 |
 |
| Parameter | Plot |
|---|---|
| CZT HV Monitor | 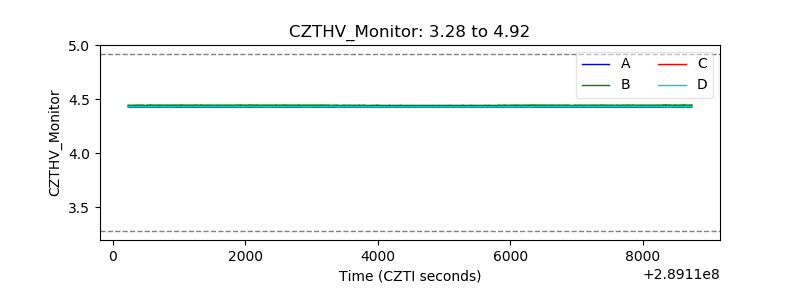 |
| D_VDD | 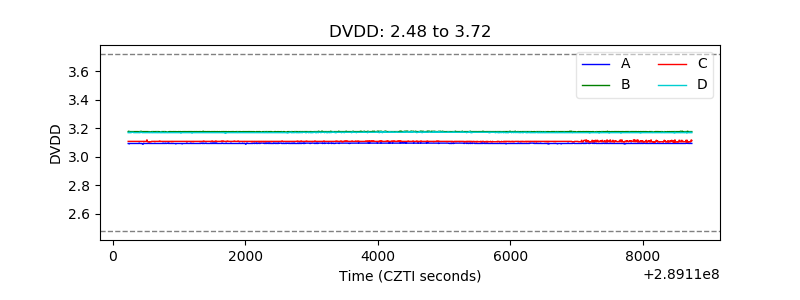 |
| Temperature 1 | 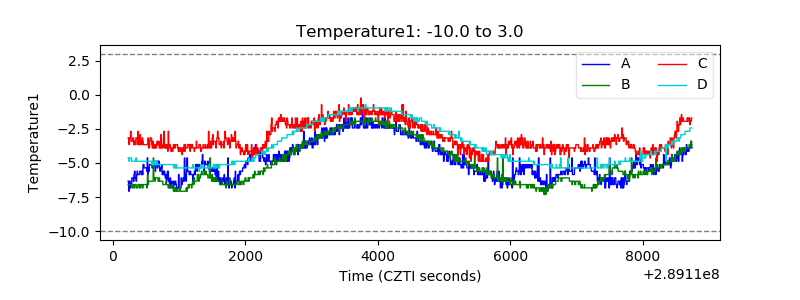 |
| Veto HV Monitor | 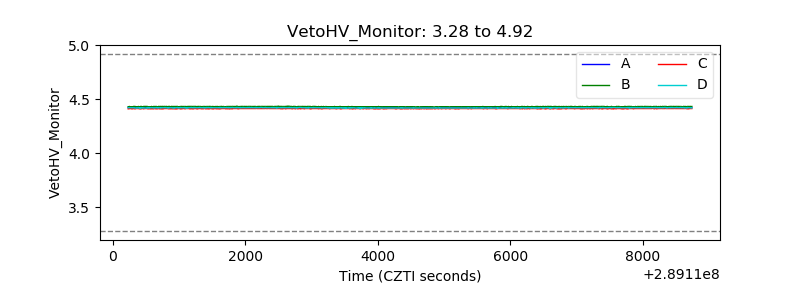 |
| Veto LLD | 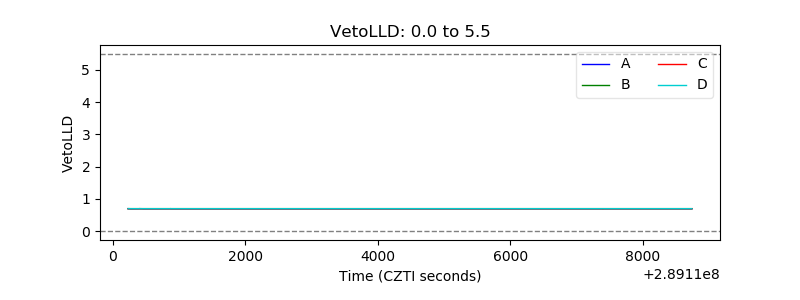 |
| Alpha Counter | 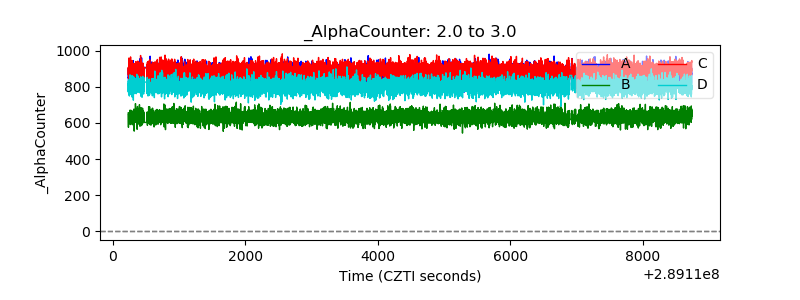 |
| _CPM_Rate | 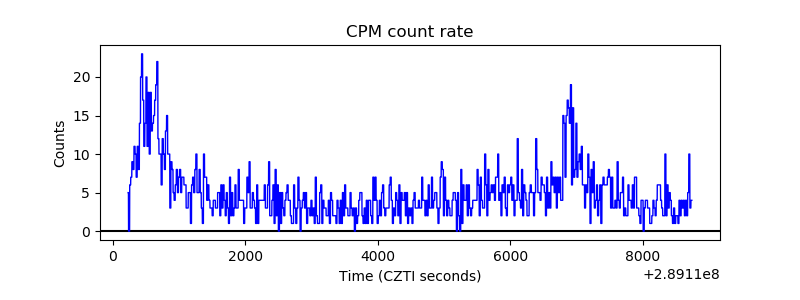 |
| CZT Counter | 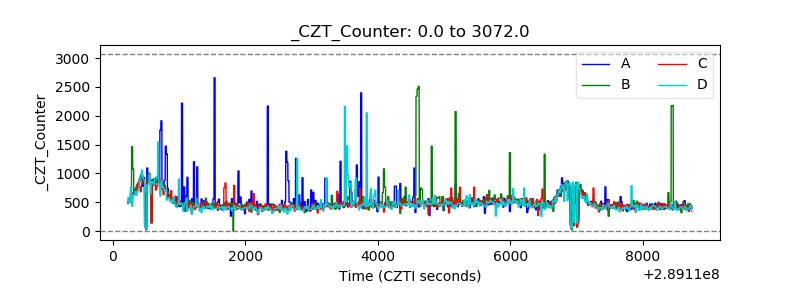 |
| +2.5 Volts monitor | 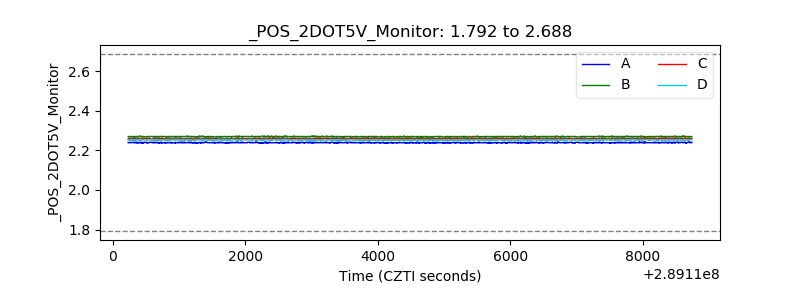 |
| +5 Volts monitor | 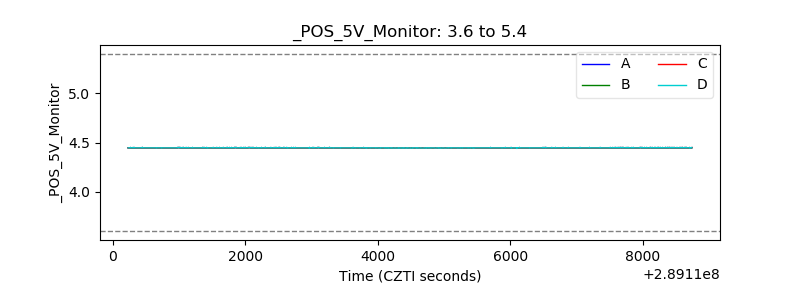 |
| _ROLL_ROT | 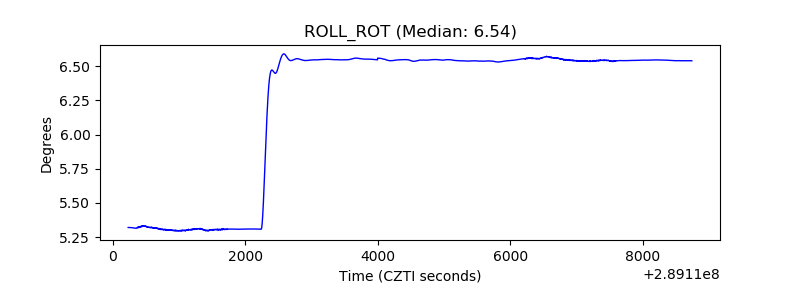 |
| _Roll_DEC | 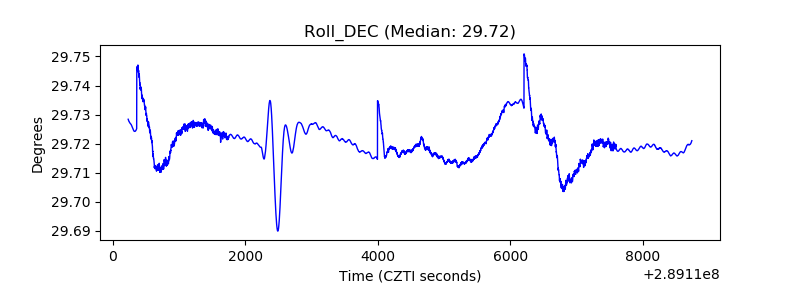 |
| _Roll_RA | 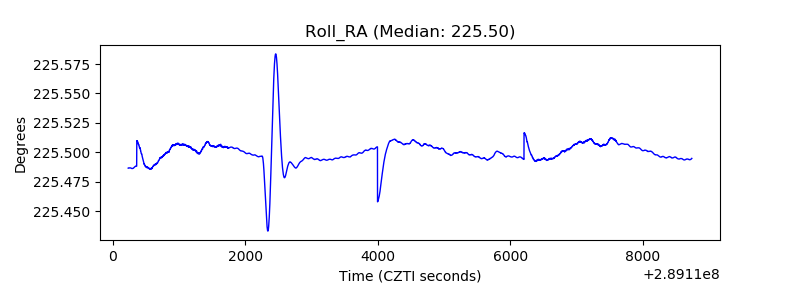 |
| Veto Counter | 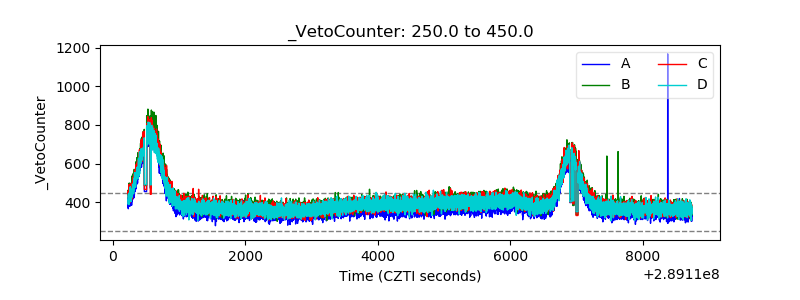 |