| Param | Original file | Final file |
|---|---|---|
| Filename | modeM0/AS1A05_075T08_9000002744_18504cztM0_level2.evt | modeM0/AS1A05_075T08_9000002744_18504cztM0_level2_quad_clean.evt |
| Size (bytes) | 443,514,240 | 83,672,640 |
| Size | 423.0 MB | 79.8 MB |
| Events in quadrant A | 3,223,445 | 515,418 |
| Events in quadrant B | 3,306,759 | 531,792 |
| Events in quadrant C | 3,108,961 | 517,134 |
| Events in quadrant D | 3,339,195 | 504,851 |
| Mode M0 | |||
|---|---|---|---|
| Quadrant | BADHDUFLAG | Total packets | Discarded packets |
| A | 0 | 13970 | 1 |
| B | 0 | 14103 | 1 |
| C | 0 | 13569 | 1 |
| D | 0 | 14661 | 1 |
| Mode SS | |||
|---|---|---|---|
| Quadrant | BADHDUFLAG | Total packets | Discarded packets |
| A | 0 | 136 | 0 |
| B | 0 | 136 | 0 |
| C | 0 | 136 | 0 |
| D | 0 | 136 | 0 |
| Mode M9 | |||
|---|---|---|---|
| Quadrant | BADHDUFLAG | Total packets | Discarded packets |
| A | 0 | 3 | 0 |
| B | 0 | 3 | 0 |
| C | 0 | 3 | 0 |
| D | 0 | 3 | 0 |
| Quadrant | Total seconds | Saturated seconds | Saturation percentage |
|---|---|---|---|
| A | 6662 | 129 | 1.936355% |
| B | 6663 | 159 | 2.386312% |
| C | 6662 | 126 | 1.891324% |
| D | 6662 | 169 | 2.536776% |
Noise dominated data is calculated using 1-second bins in cleaned event files. If a bin has >2000 counts, and if more than 50% of those come from <1% of pixels, then it is considered to be noise-dominated and hence unusable.
| Quadrant | # 1 sec bins | Bins with >0 counts | Bins with >2000 counts | High rate bins dominated by noise | Noise dominated (total time) | Noise dominated (detector-on time) | Marked lightcurve |
|---|---|---|---|---|---|---|---|
| A | 6952 | 6662 | 9 | 9 | 0.13% | 0.14% | 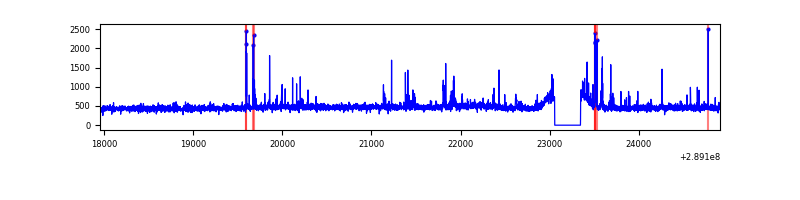 |
| B | 6953 | 6663 | 33 | 33 | 0.47% | 0.50% | 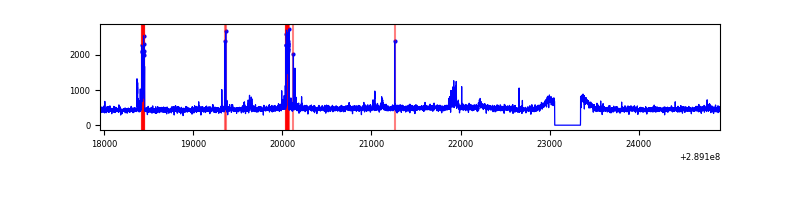 |
| C | 6952 | 6662 | 0 | 0 | 0.00% | 0.00% | 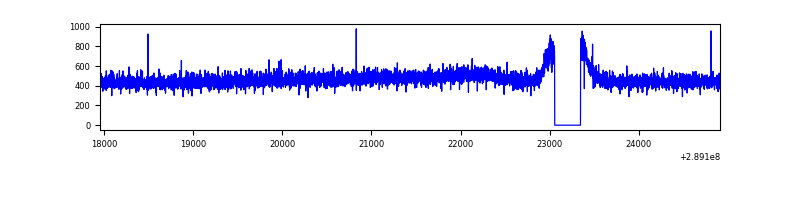 |
| D | 6952 | 6662 | 62 | 62 | 0.89% | 0.93% | 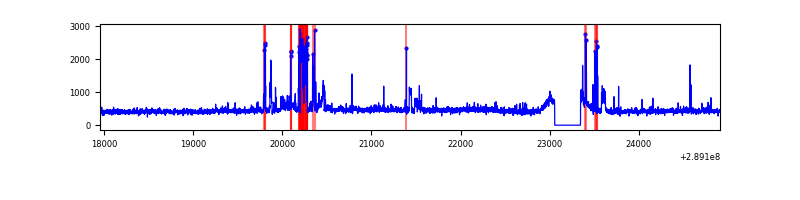 |
Top three noisy pixels from each quadrant. If the there are fewer than three noisy pixels in the level2.evt file, extra rows are filled as -1
| Pixel properties | Quadrant properties | ||||||
|---|---|---|---|---|---|---|---|
| Quadrant | DetID | PixID | Counts | Sigma | Mean | Median | Sigma |
| A | 0 | 13 | 133729 | 815.72 | 793 | 774 | 163.0 |
| A | 14 | 111 | 14165 | 82.16 | 793 | 774 | 163.0 |
| A | 15 | 192 | 9807 | 55.42 | 793 | 774 | 163.0 |
| B | 10 | 245 | 91215 | 583.45 | 791 | 770 | 155.0 |
| B | 7 | 220 | 72357 | 461.8 | 791 | 770 | 155.0 |
| B | 0 | 230 | 22876 | 142.6 | 791 | 770 | 155.0 |
| C | 14 | 238 | 117431 | 646.0 | 762 | 766 | 180.6 |
| C | 8 | 128 | 10568 | 54.28 | 762 | 766 | 180.6 |
| C | 13 | 61 | 5374 | 25.52 | 762 | 766 | 180.6 |
| D | 7 | 38 | 305205 | 1618.33 | 772 | 748 | 188.1 |
| D | 7 | 238 | 54049 | 283.32 | 772 | 748 | 188.1 |
| D | 13 | 168 | 33177 | 172.37 | 772 | 748 | 188.1 |
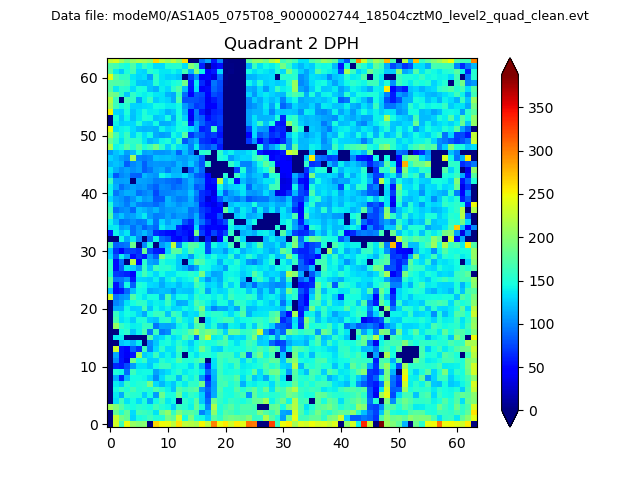
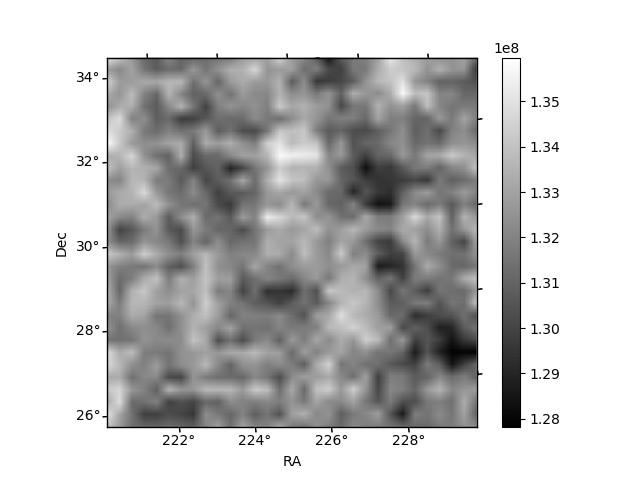
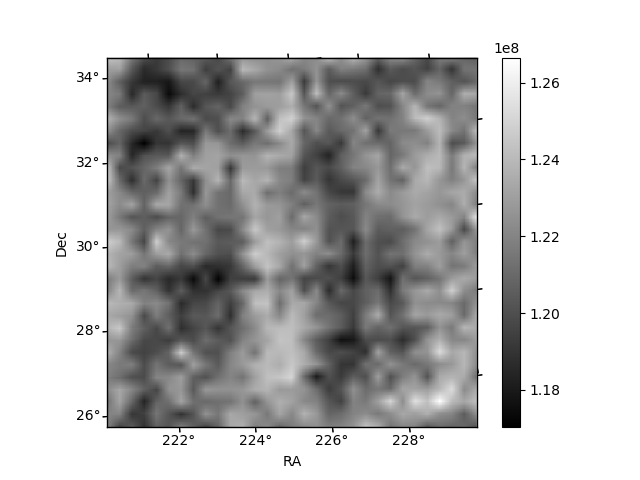
Histogram calculated using DETX and DETY for each event in the final _common_clean file
| Quadrant A | 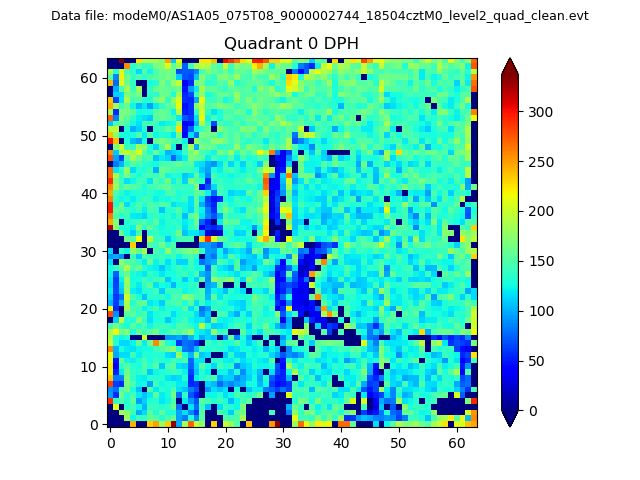 |
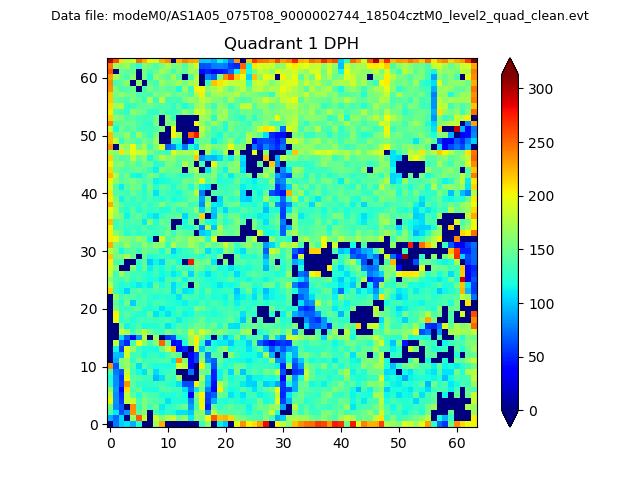 |
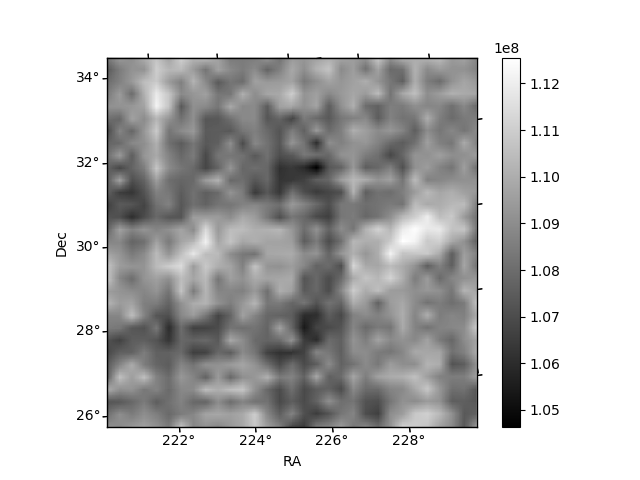
Quadrant B |
|---|---|---|---|
| Quadrant D | 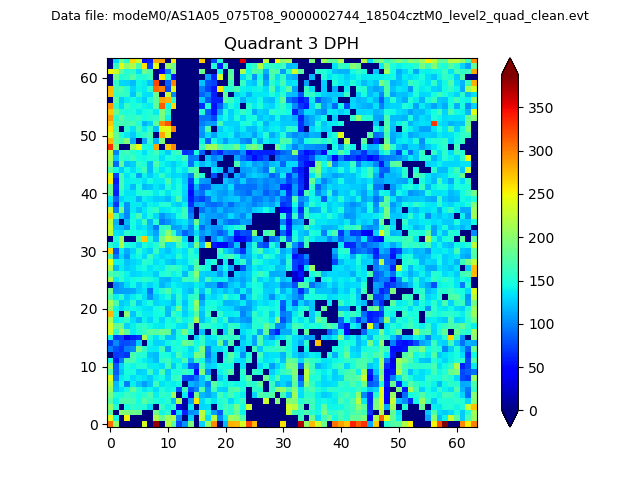 |
 |
Quadrant C |
| Plot type | Count rate plots | Images |
|---|---|---|
| Comparison with Poisson distribution Blue bars denote a histogram of data divided into 1 sec bins. Red curve is a Poisson curve with rate = median count rate of data. |
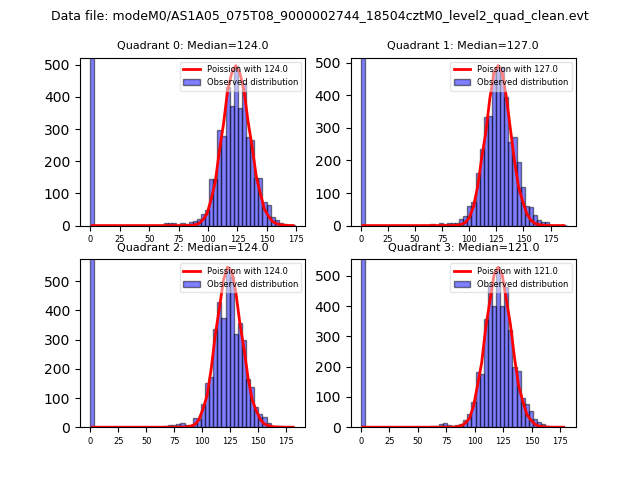 |
 |
| Quadrant-wise count rates Data is divided into 100 sec bins |
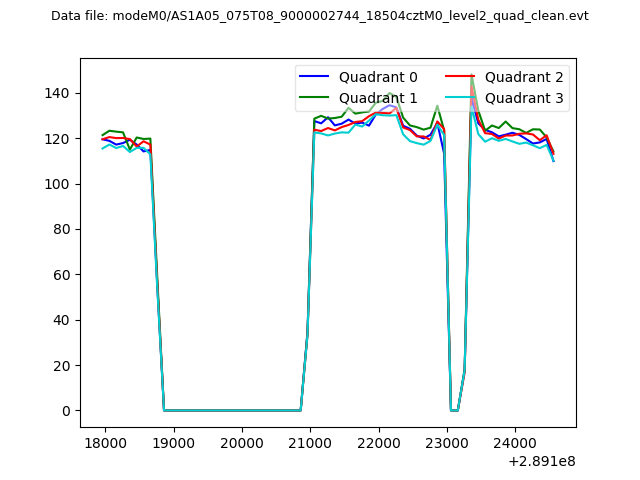 |
|
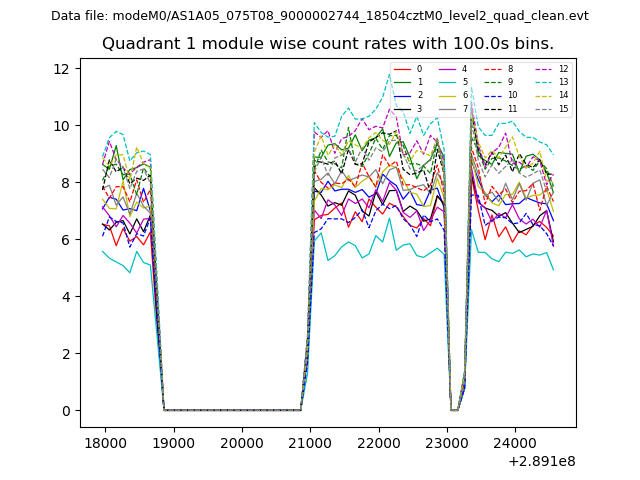
| Module-wise count rates for Quadrant A Data is divided into 100 sec bins |
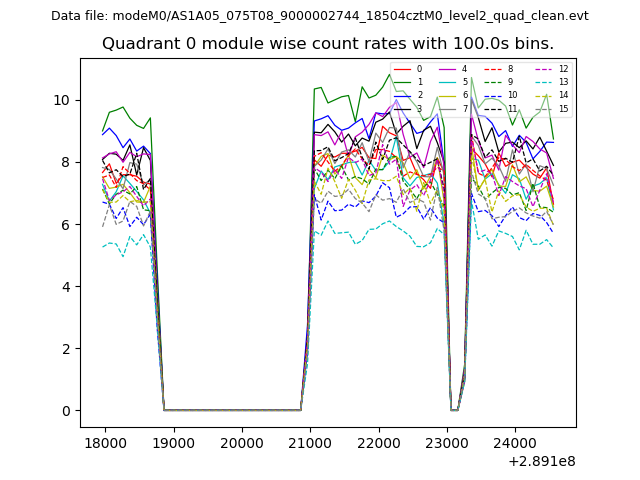 |
 |
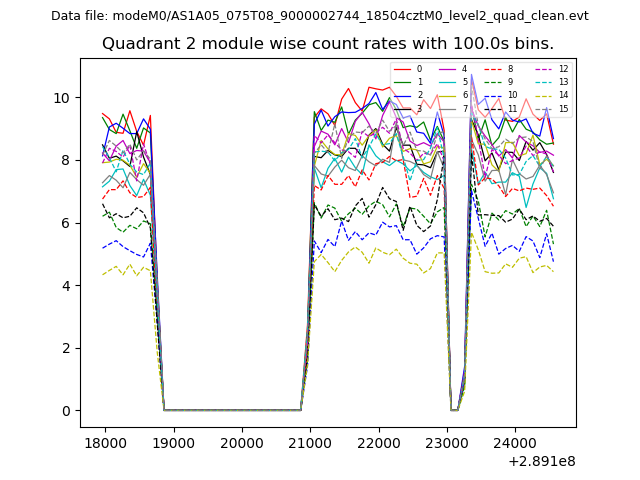
| Module-wise count rates for Quadrant B Data is divided into 100 sec bins |
 |
 |
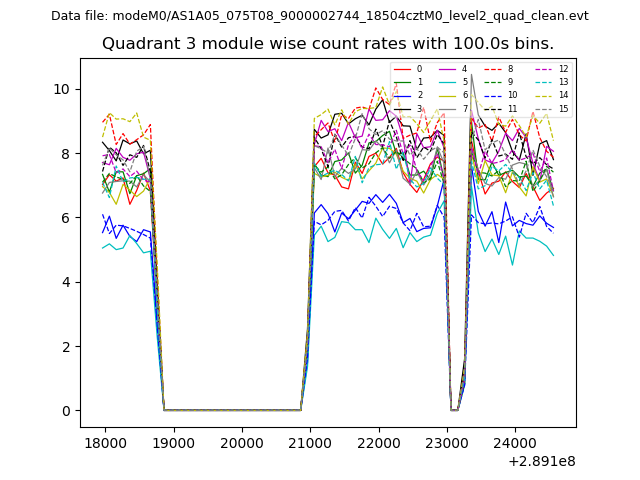
| Module-wise count rates for Quadrant C Data is divided into 100 sec bins |
 |
 |
| Module-wise count rates for Quadrant D Data is divided into 100 sec bins |
 |
 |
| Parameter | Plot |
|---|---|
| CZT HV Monitor | 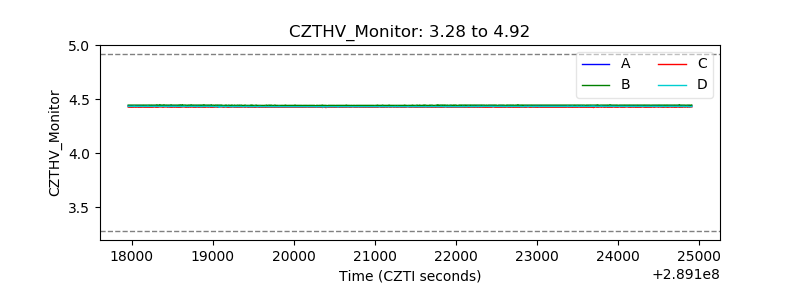 |
| D_VDD | 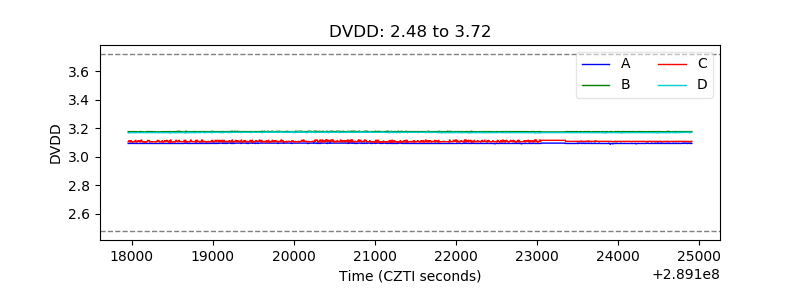 |
| Temperature 1 | 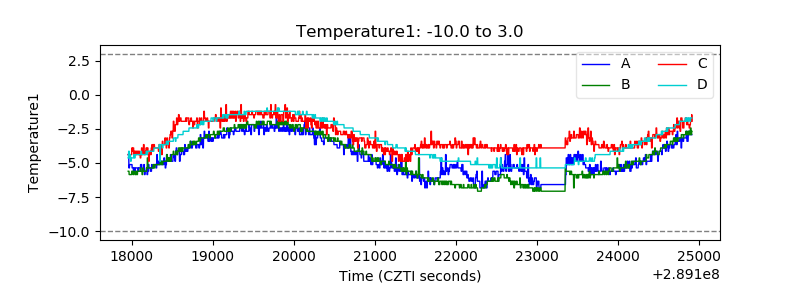 |
| Veto HV Monitor | 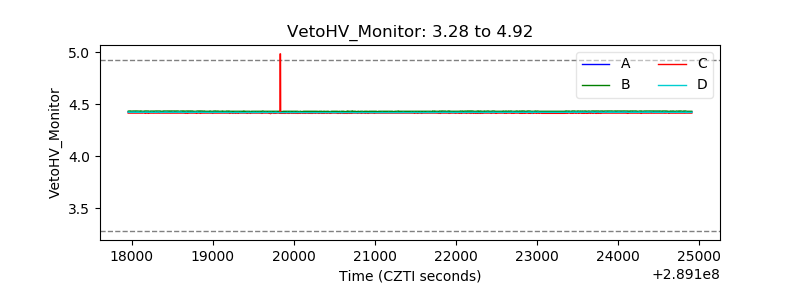 |
| Veto LLD | 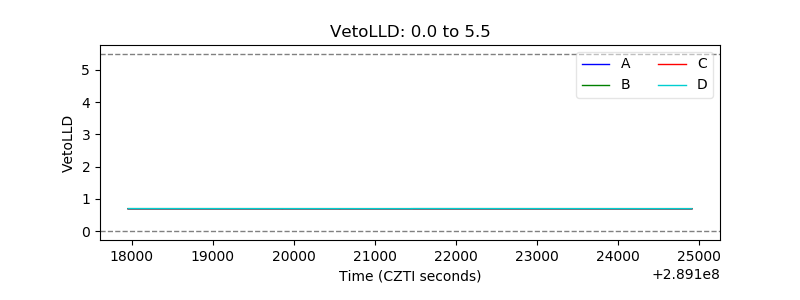 |
| Alpha Counter | 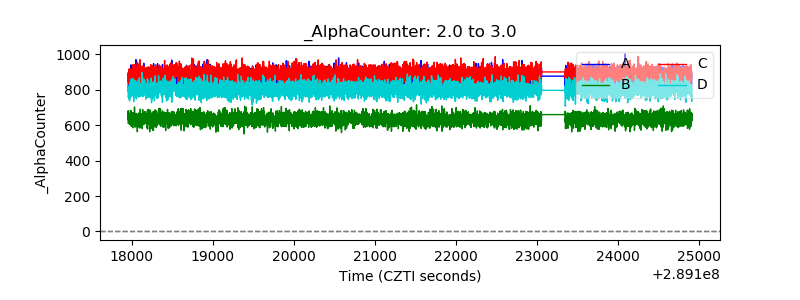 |
| _CPM_Rate | 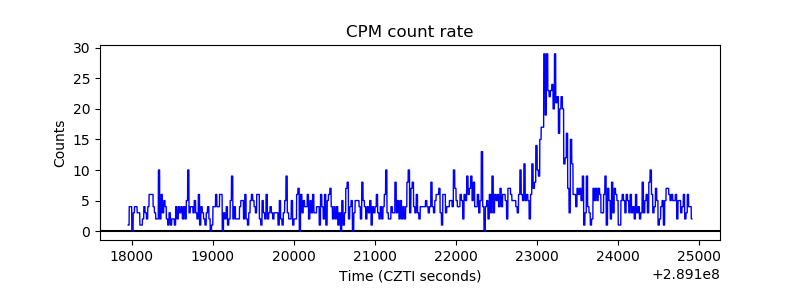 |
| CZT Counter | 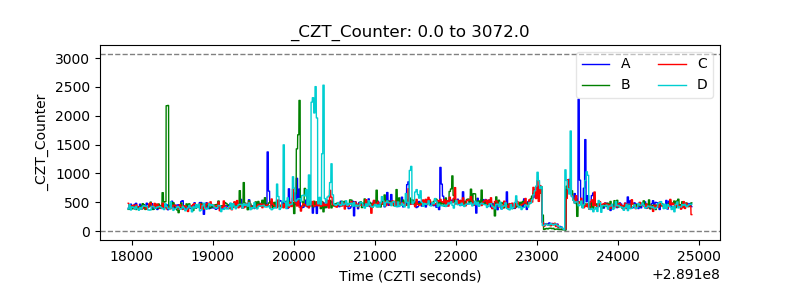 |
| +2.5 Volts monitor |  |
| +5 Volts monitor |  |
| _ROLL_ROT |  |
| _Roll_DEC | 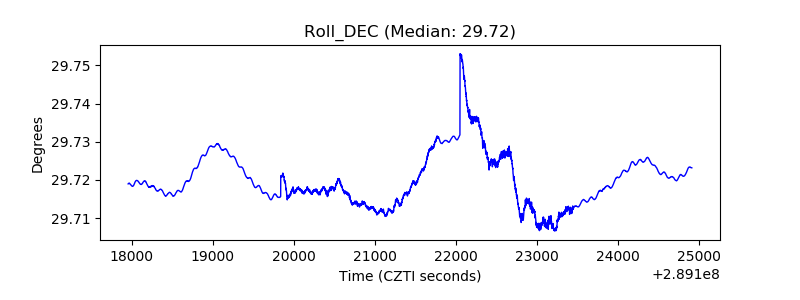 |
| _Roll_RA |  |
| Veto Counter | 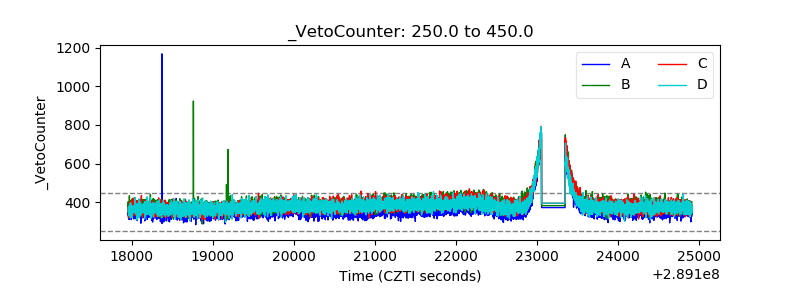 |