| Param | Original file | Final file |
|---|---|---|
| Filename | modeM0/AS1A05_075T08_9000002744_18506cztM0_level2.evt | modeM0/AS1A05_075T08_9000002744_18506cztM0_level2_quad_clean.evt |
| Size (bytes) | 176,063,040 | 27,720,000 |
| Size | 167.9 MB | 26.4 MB |
| Events in quadrant A | 1,319,808 | 160,333 |
| Events in quadrant B | 1,290,332 | 165,965 |
| Events in quadrant C | 1,236,757 | 161,494 |
| Events in quadrant D | 1,298,146 | 156,598 |
| Mode M0 | |||
|---|---|---|---|
| Quadrant | BADHDUFLAG | Total packets | Discarded packets |
| A | 0 | 5724 | 1 |
| B | 0 | 5598 | 1 |
| C | 0 | 5544 | 1 |
| D | 0 | 5789 | 1 |
| Mode SS | |||
|---|---|---|---|
| Quadrant | BADHDUFLAG | Total packets | Discarded packets |
| A | 0 | 54 | 0 |
| B | 0 | 54 | 0 |
| C | 0 | 54 | 0 |
| D | 0 | 54 | 0 |
| Mode M9 | |||
|---|---|---|---|
| Quadrant | BADHDUFLAG | Total packets | Discarded packets |
| A | 0 | 1 | 0 |
| B | 0 | 2 | 0 |
| C | 0 | 2 | 0 |
| D | 0 | 2 | 0 |
| Quadrant | Total seconds | Saturated seconds | Saturation percentage |
|---|---|---|---|
| A | 2716 | 43 | 1.583211% |
| B | 2716 | 39 | 1.435935% |
| C | 2716 | 44 | 1.620029% |
| D | 2716 | 42 | 1.546392% |
Noise dominated data is calculated using 1-second bins in cleaned event files. If a bin has >2000 counts, and if more than 50% of those come from <1% of pixels, then it is considered to be noise-dominated and hence unusable.
| Quadrant | # 1 sec bins | Bins with >0 counts | Bins with >2000 counts | High rate bins dominated by noise | Noise dominated (total time) | Noise dominated (detector-on time) | Marked lightcurve |
|---|---|---|---|---|---|---|---|
| A | 2716 | 2716 | 5 | 5 | 0.18% | 0.18% | 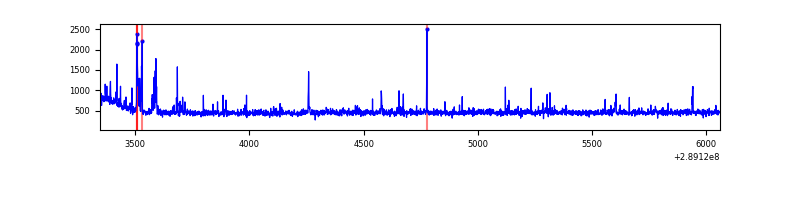 |
| B | 2716 | 2716 | 0 | 0 | 0.00% | 0.00% | 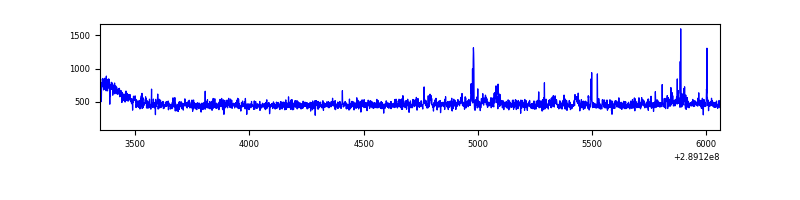 |
| C | 2716 | 2716 | 0 | 0 | 0.00% | 0.00% | 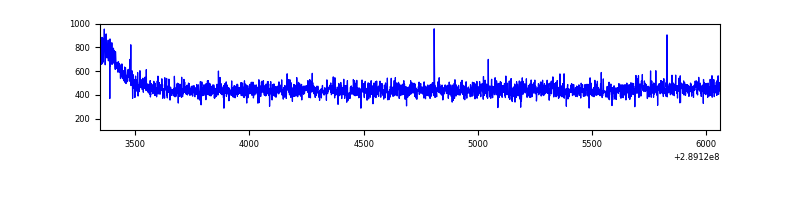 |
| D | 2716 | 2716 | 8 | 8 | 0.29% | 0.29% | 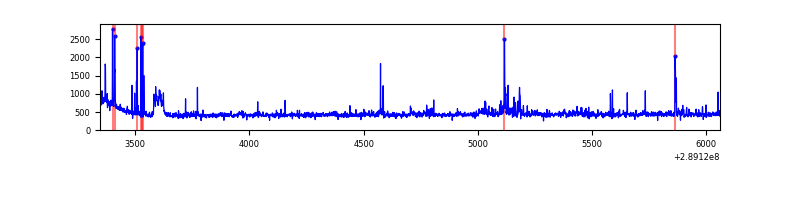 |
Top three noisy pixels from each quadrant. If the there are fewer than three noisy pixels in the level2.evt file, extra rows are filled as -1
| Pixel properties | Quadrant properties | ||||||
|---|---|---|---|---|---|---|---|
| Quadrant | DetID | PixID | Counts | Sigma | Mean | Median | Sigma |
| A | 0 | 13 | 74569 | 1104.7 | 322 | 314 | 67.2 |
| A | 13 | 254 | 3382 | 45.64 | 322 | 314 | 67.2 |
| A | 5 | 98 | 3094 | 41.36 | 322 | 314 | 67.2 |
| B | 10 | 245 | 22811 | 344.94 | 319 | 310 | 65.2 |
| B | 7 | 220 | 7912 | 116.54 | 319 | 310 | 65.2 |
| B | 12 | 111 | 7545 | 110.91 | 319 | 310 | 65.2 |
| C | 14 | 238 | 47483 | 645.84 | 304 | 305 | 73.0 |
| C | 13 | 61 | 2078 | 24.27 | 304 | 305 | 73.0 |
| C | 5 | 112 | 1353 | 14.35 | 304 | 305 | 73.0 |
| D | 7 | 238 | 81863 | 1052.33 | 312 | 302 | 77.5 |
| D | 7 | 38 | 12068 | 151.81 | 312 | 302 | 77.5 |
| D | 2 | 234 | 10784 | 135.24 | 312 | 302 | 77.5 |
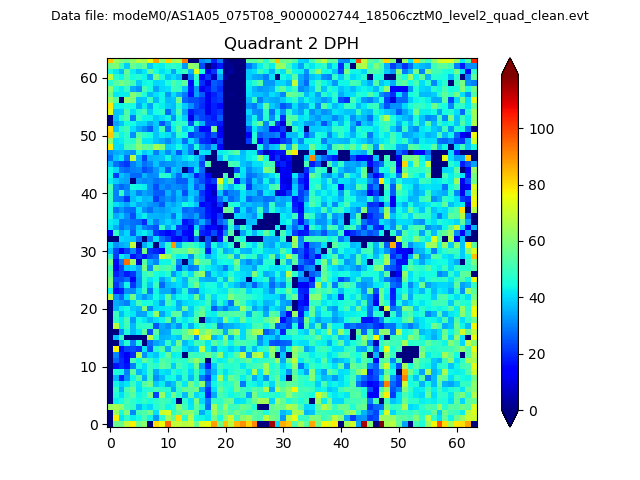
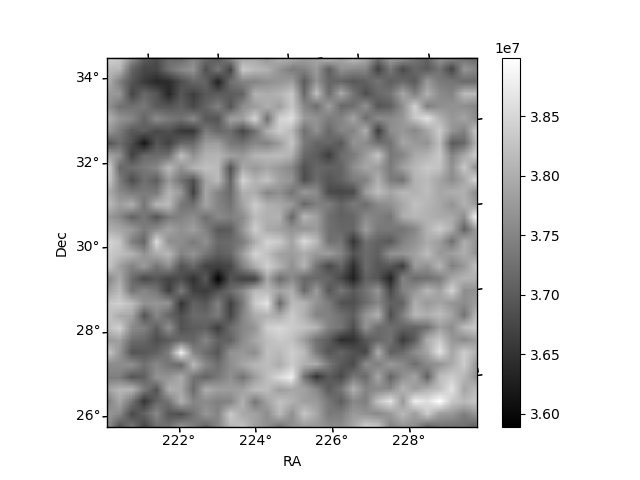
Histogram calculated using DETX and DETY for each event in the final _common_clean file
| Quadrant A | 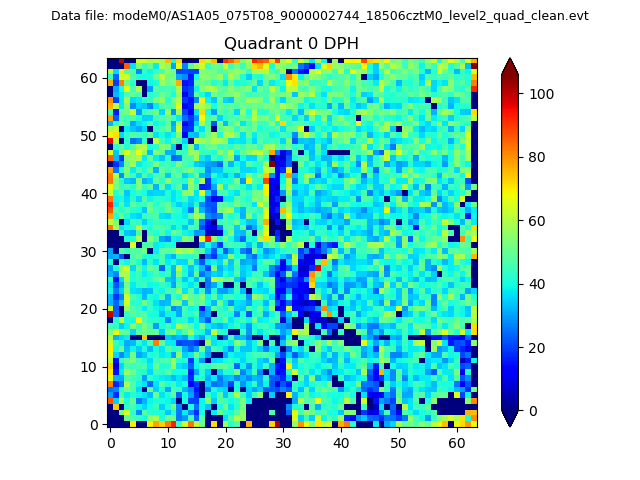 |
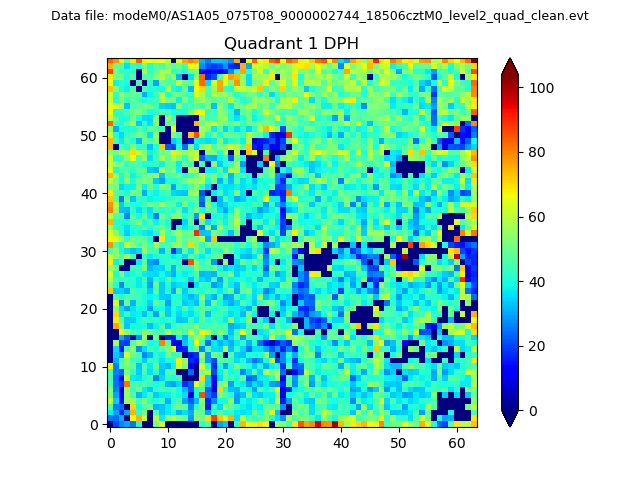 |
Quadrant B |
|---|---|---|---|
| Quadrant D | 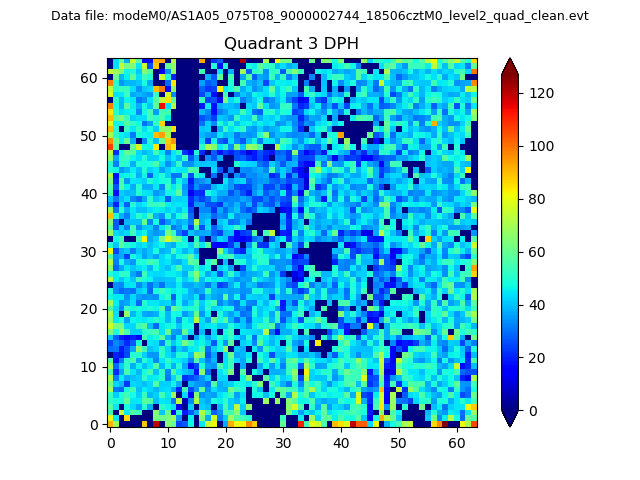 |
 |
Quadrant C |
| Plot type | Count rate plots | Images |
|---|---|---|
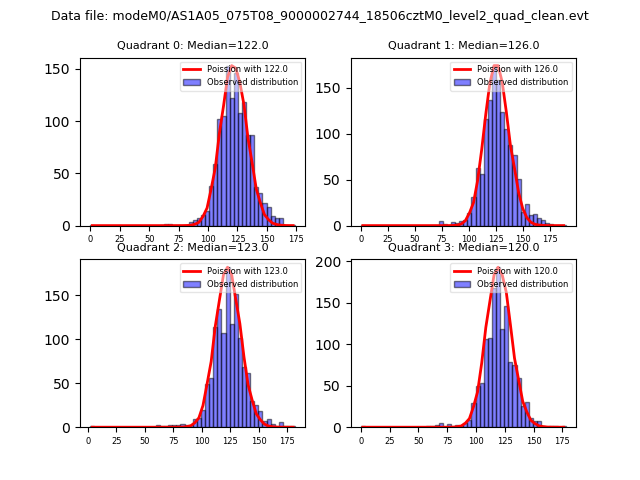
| Comparison with Poisson distribution Blue bars denote a histogram of data divided into 1 sec bins. Red curve is a Poisson curve with rate = median count rate of data. |
 |
 |
| Quadrant-wise count rates Data is divided into 100 sec bins |
 |
|
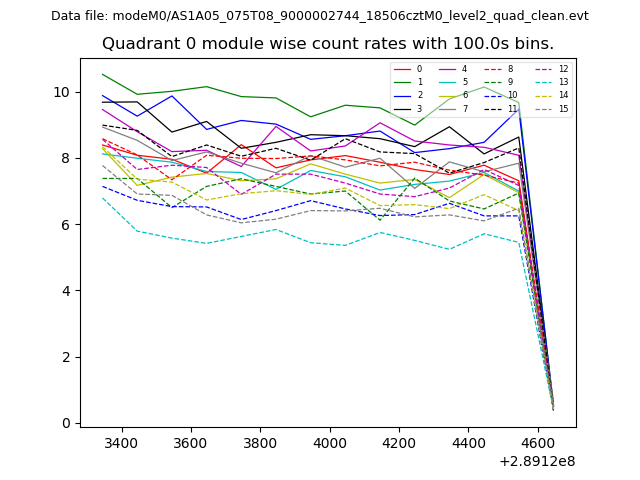
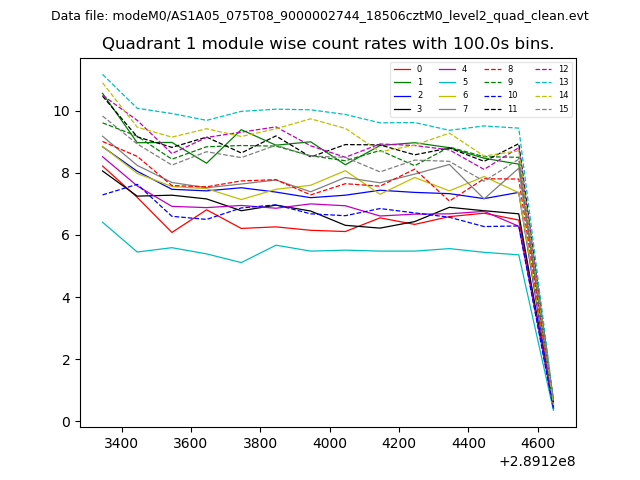
| Module-wise count rates for Quadrant A Data is divided into 100 sec bins |
 |
 |
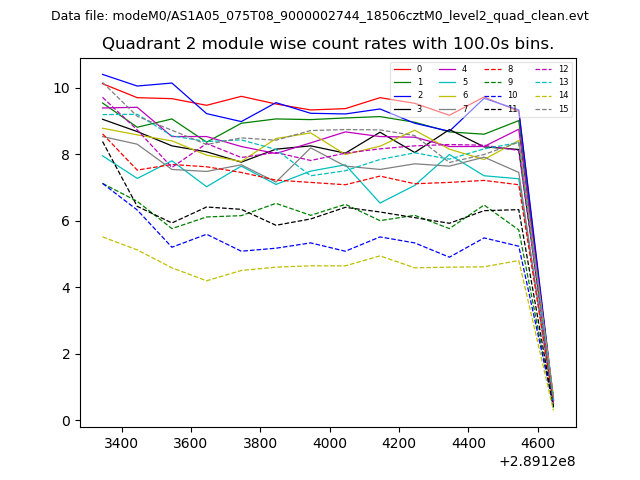
| Module-wise count rates for Quadrant B Data is divided into 100 sec bins |
 |
 |
| Module-wise count rates for Quadrant C Data is divided into 100 sec bins |
 |
 |
| Module-wise count rates for Quadrant D Data is divided into 100 sec bins |
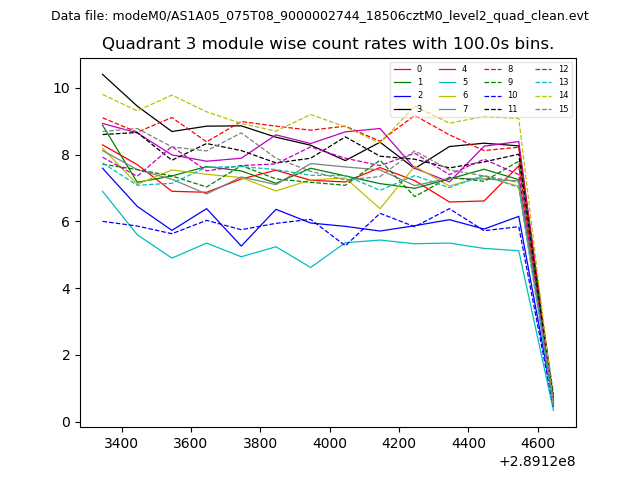 |
 |
| Parameter | Plot |
|---|---|
| CZT HV Monitor | 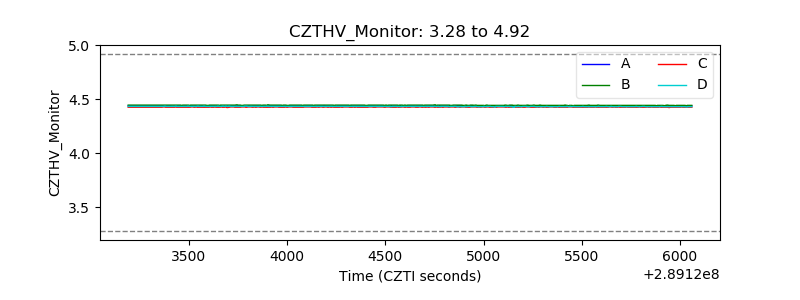 |
| D_VDD | 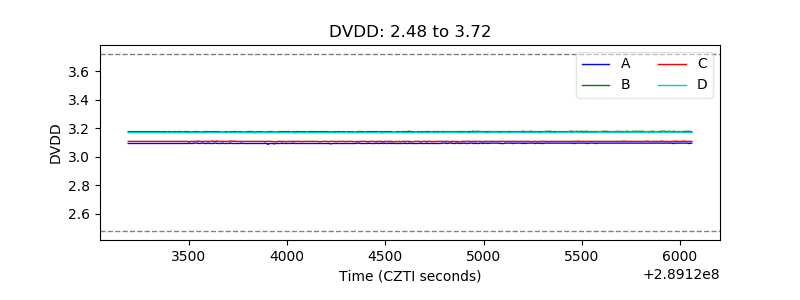 |
| Temperature 1 | 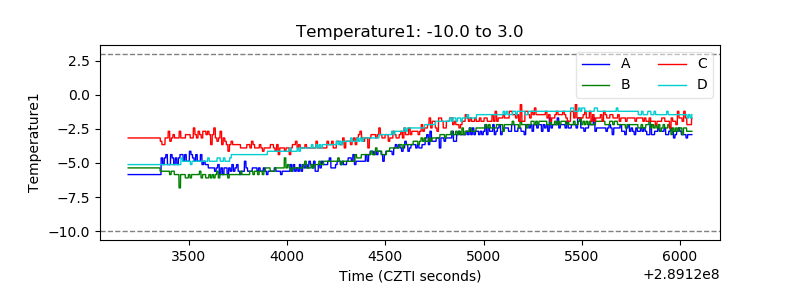 |
| Veto HV Monitor | 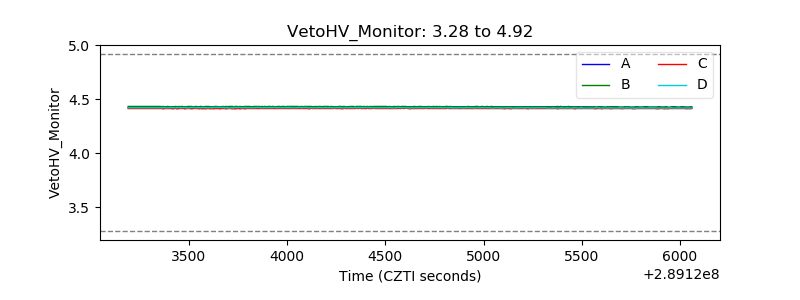 |
| Veto LLD | 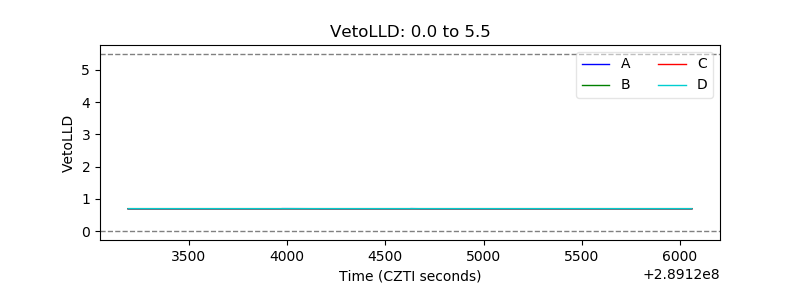 |
| Alpha Counter | 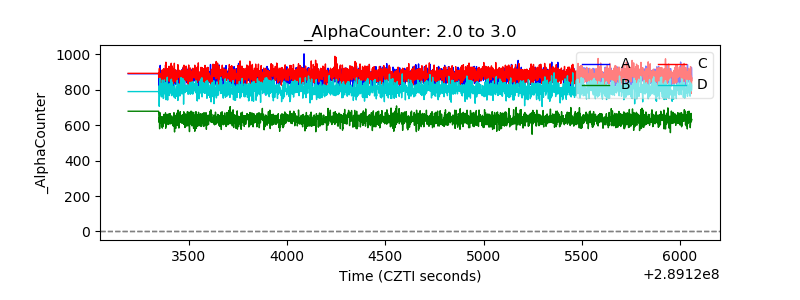 |
| _CPM_Rate | 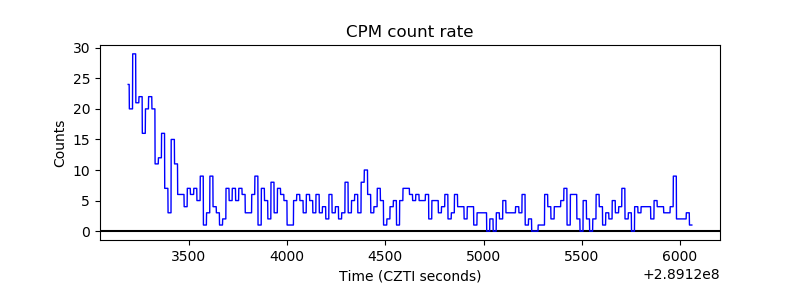 |
| CZT Counter | 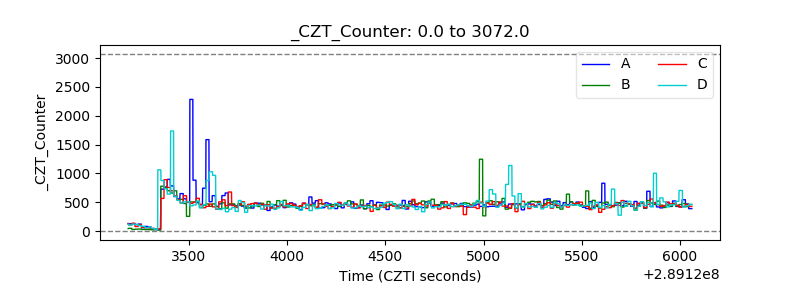 |
| +2.5 Volts monitor |  |
| +5 Volts monitor |  |
| _ROLL_ROT | 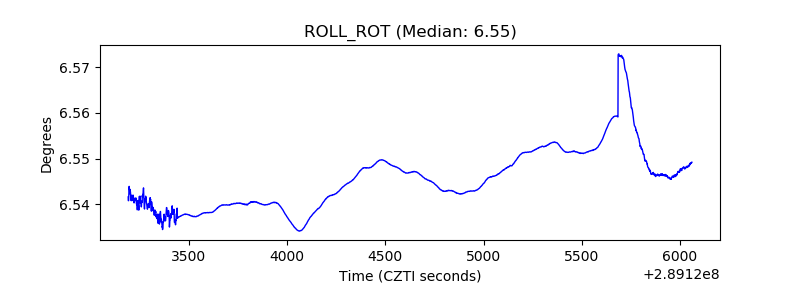 |
| _Roll_DEC | 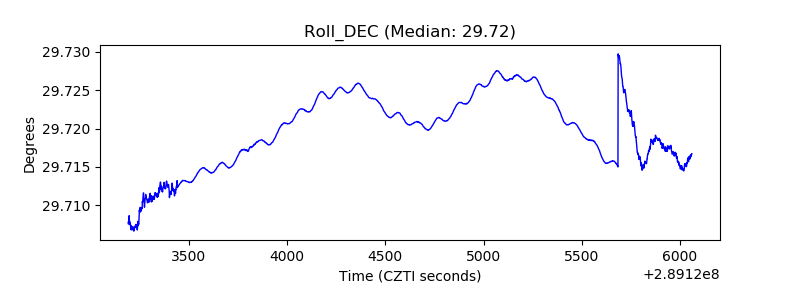 |
| _Roll_RA | 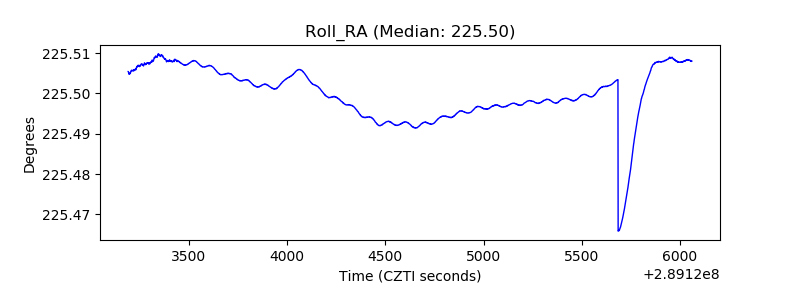 |
| Veto Counter | 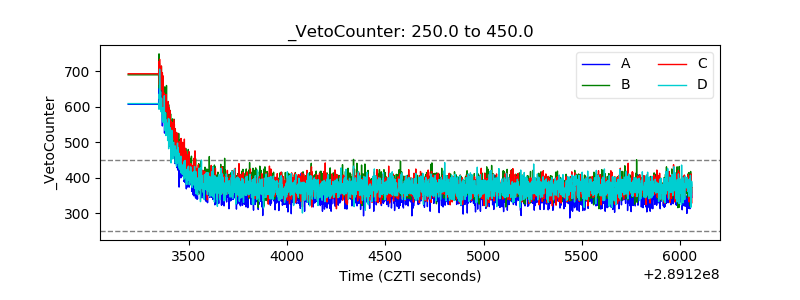 |