| Param | Original file | Final file |
|---|---|---|
| Filename | modeM0/AS1A05_075T08_9000002744_18507cztM0_level2.evt | modeM0/AS1A05_075T08_9000002744_18507cztM0_level2_quad_clean.evt |
| Size (bytes) | 566,280,000 | 96,030,720 |
| Size | 540.0 MB | 91.6 MB |
| Events in quadrant A | 4,312,187 | 576,912 |
| Events in quadrant B | 4,206,843 | 592,943 |
| Events in quadrant C | 4,012,629 | 574,360 |
| Events in quadrant D | 4,033,331 | 565,743 |
| Mode M0 | |||
|---|---|---|---|
| Quadrant | BADHDUFLAG | Total packets | Discarded packets |
| A | 0 | 18287 | 1 |
| B | 0 | 17935 | 1 |
| C | 0 | 17457 | 1 |
| D | 0 | 17962 | 1 |
| Mode SS | |||
|---|---|---|---|
| Quadrant | BADHDUFLAG | Total packets | Discarded packets |
| A | 0 | 174 | 0 |
| B | 0 | 174 | 0 |
| C | 0 | 174 | 0 |
| D | 0 | 174 | 0 |
| Mode M9 | |||
|---|---|---|---|
| Quadrant | BADHDUFLAG | Total packets | Discarded packets |
| A | 0 | 5 | 0 |
| B | 0 | 5 | 0 |
| C | 0 | 5 | 0 |
| D | 0 | 5 | 0 |
| Quadrant | Total seconds | Saturated seconds | Saturation percentage |
|---|---|---|---|
| A | 8613 | 156 | 1.811216% |
| B | 8614 | 114 | 1.323427% |
| C | 8614 | 126 | 1.462735% |
| D | 8614 | 87 | 1.009984% |
Noise dominated data is calculated using 1-second bins in cleaned event files. If a bin has >2000 counts, and if more than 50% of those come from <1% of pixels, then it is considered to be noise-dominated and hence unusable.
| Quadrant | # 1 sec bins | Bins with >0 counts | Bins with >2000 counts | High rate bins dominated by noise | Noise dominated (total time) | Noise dominated (detector-on time) | Marked lightcurve |
|---|---|---|---|---|---|---|---|
| A | 9103 | 8613 | 48 | 48 | 0.53% | 0.56% | 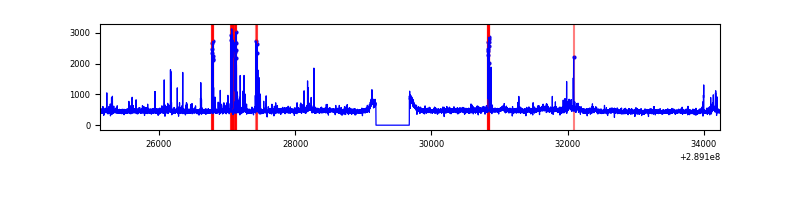 |
| B | 9104 | 8614 | 8 | 8 | 0.09% | 0.09% | 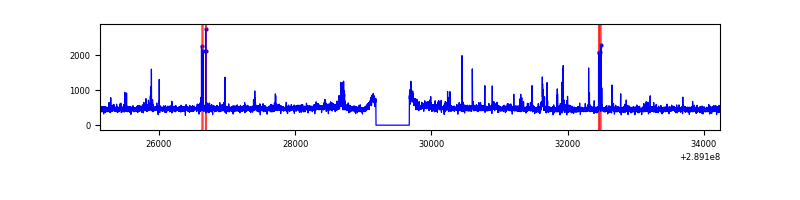 |
| C | 9104 | 8614 | 0 | 0 | 0.00% | 0.00% | 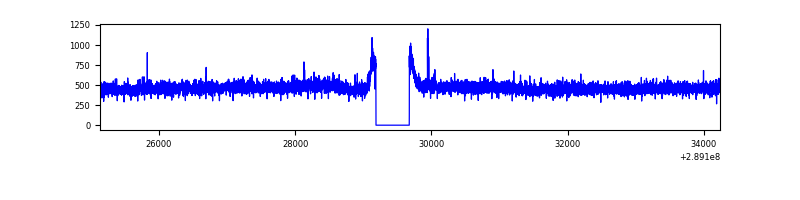 |
| D | 9104 | 8614 | 8 | 8 | 0.09% | 0.09% | 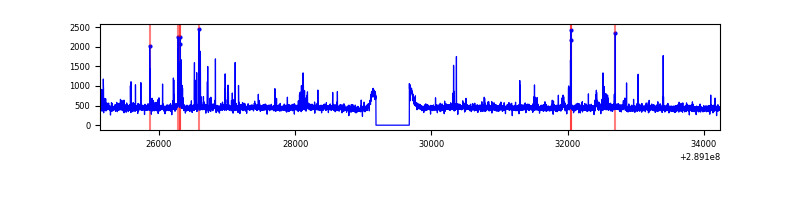 |
Top three noisy pixels from each quadrant. If the there are fewer than three noisy pixels in the level2.evt file, extra rows are filled as -1
| Pixel properties | Quadrant properties | ||||||
|---|---|---|---|---|---|---|---|
| Quadrant | DetID | PixID | Counts | Sigma | Mean | Median | Sigma |
| A | 0 | 13 | 281765 | 1354.79 | 1020 | 997 | 207.2 |
| A | 15 | 174 | 80142 | 381.9 | 1020 | 997 | 207.2 |
| A | 13 | 254 | 12810 | 57.0 | 1020 | 997 | 207.2 |
| B | 10 | 245 | 72264 | 359.97 | 1025 | 999 | 198.0 |
| B | 7 | 220 | 65424 | 325.42 | 1025 | 999 | 198.0 |
| B | 15 | 222 | 28933 | 141.1 | 1025 | 999 | 198.0 |
| C | 14 | 238 | 152859 | 652.33 | 985 | 991 | 232.8 |
| C | 9 | 54 | 11235 | 44.0 | 985 | 991 | 232.8 |
| C | 13 | 61 | 7038 | 25.97 | 985 | 991 | 232.8 |
| D | 13 | 168 | 73504 | 297.23 | 999 | 968 | 244.0 |
| D | 7 | 38 | 62067 | 250.36 | 999 | 968 | 244.0 |
| D | 7 | 238 | 58634 | 236.3 | 999 | 968 | 244.0 |
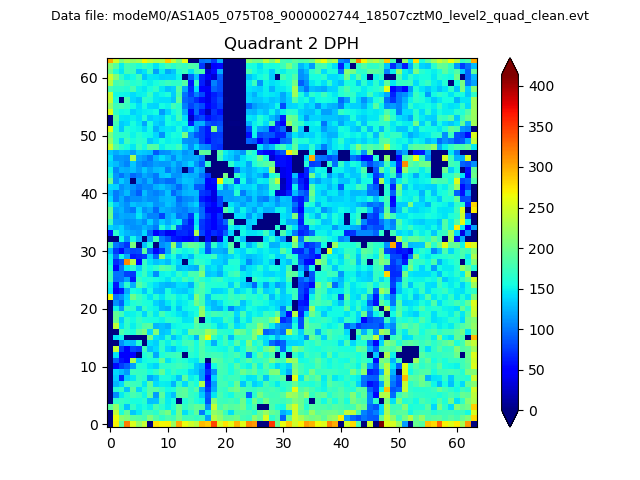
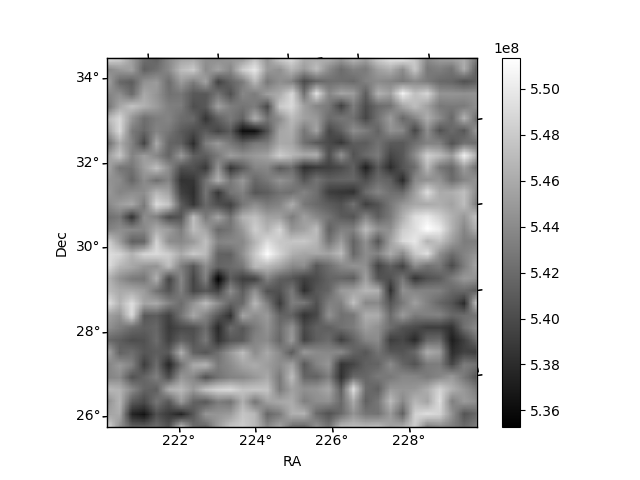
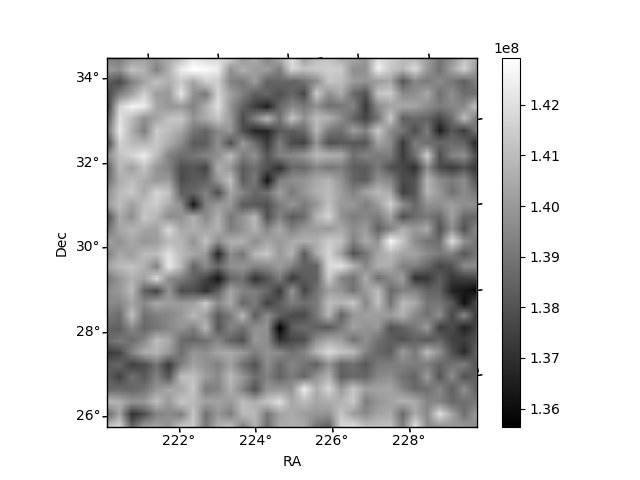
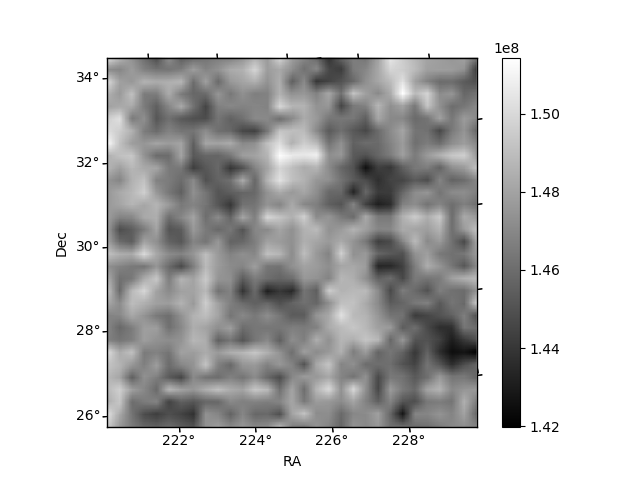
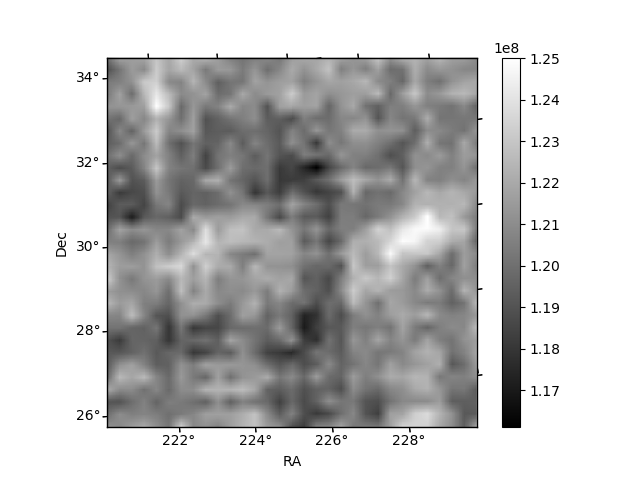
Histogram calculated using DETX and DETY for each event in the final _common_clean file
| Quadrant A | 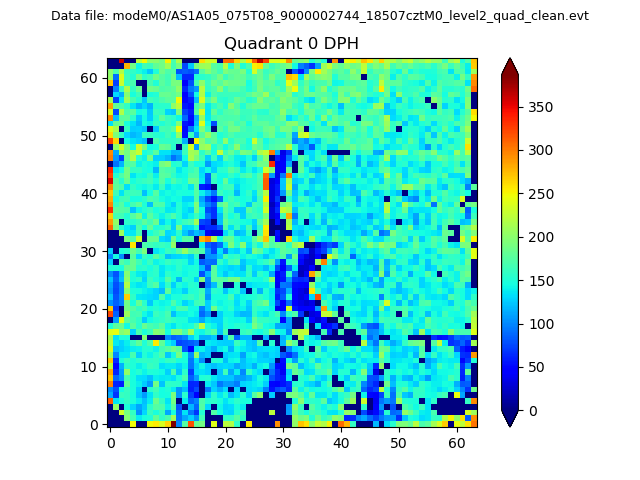 |
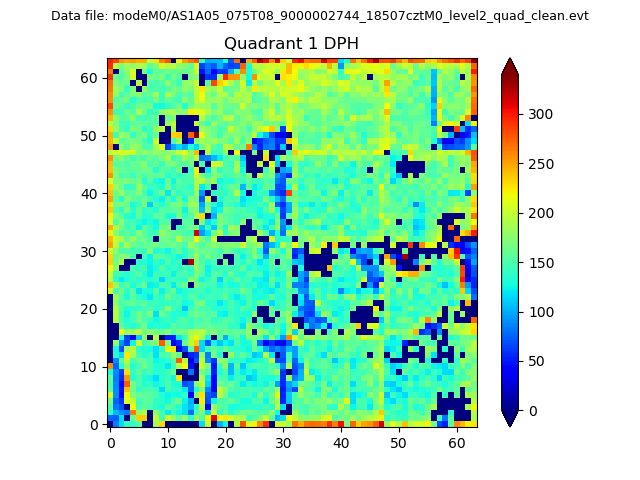 |
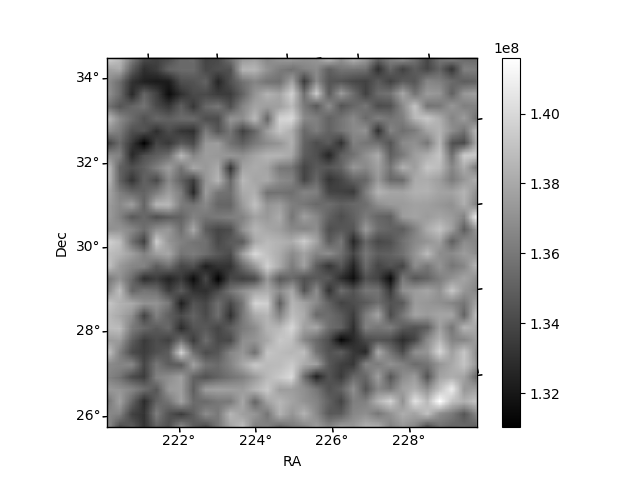
Quadrant B |
|---|---|---|---|
| Quadrant D | 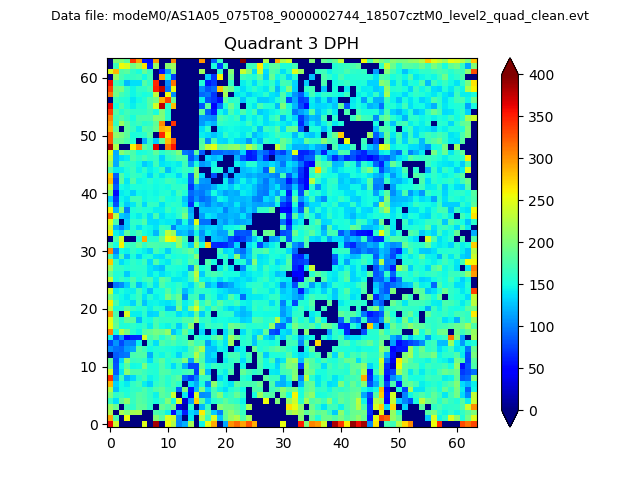 |
 |
Quadrant C |
| Plot type | Count rate plots | Images |
|---|---|---|
| Comparison with Poisson distribution Blue bars denote a histogram of data divided into 1 sec bins. Red curve is a Poisson curve with rate = median count rate of data. |
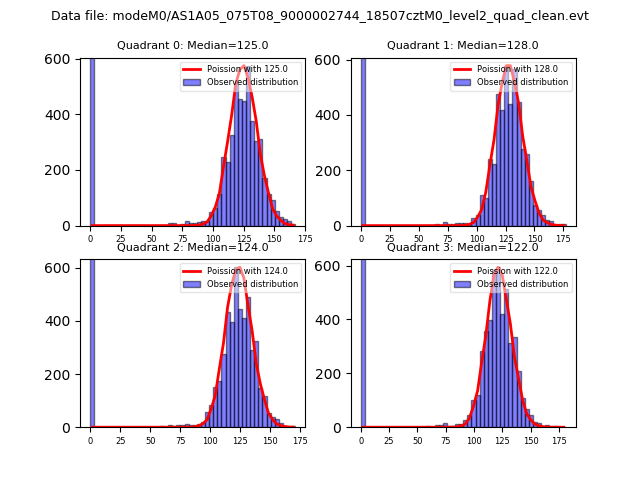 |
 |
| Quadrant-wise count rates Data is divided into 100 sec bins |
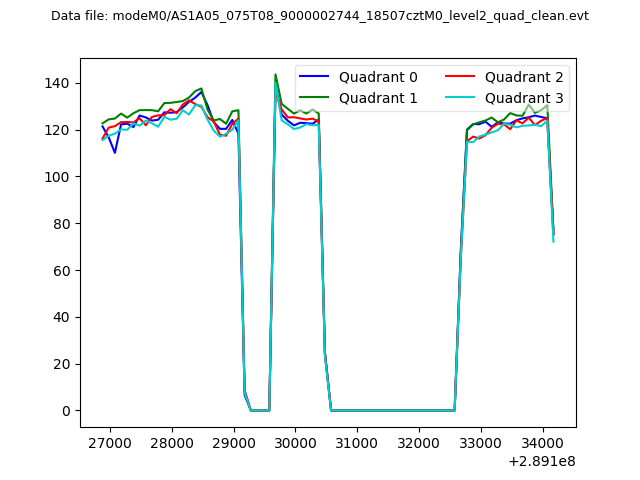 |
|
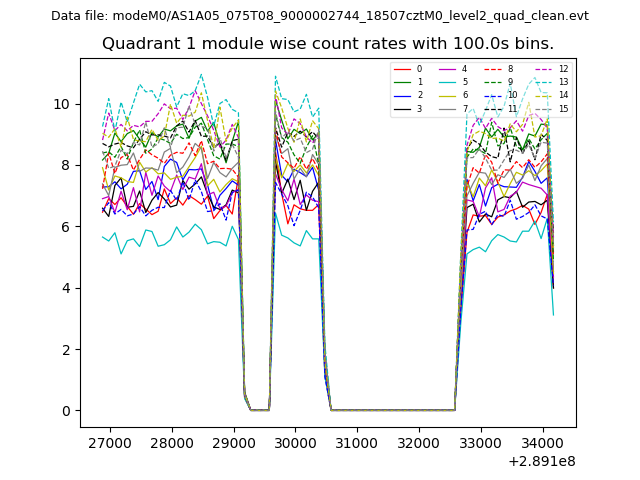
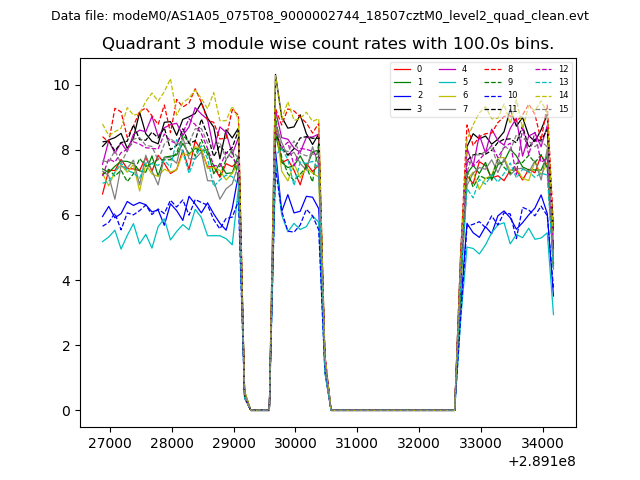
| Module-wise count rates for Quadrant A Data is divided into 100 sec bins |
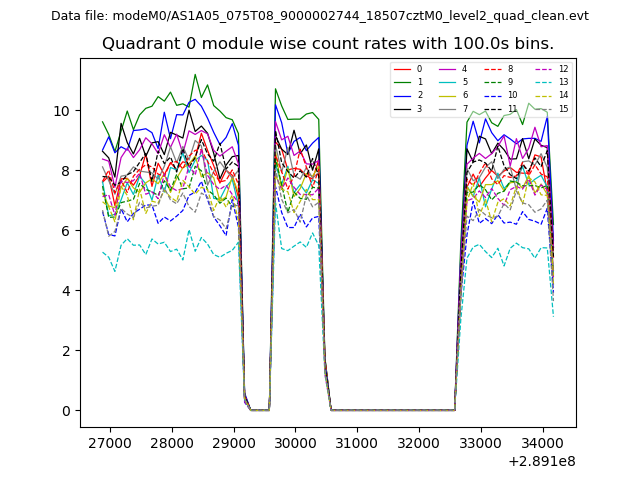 |
 |
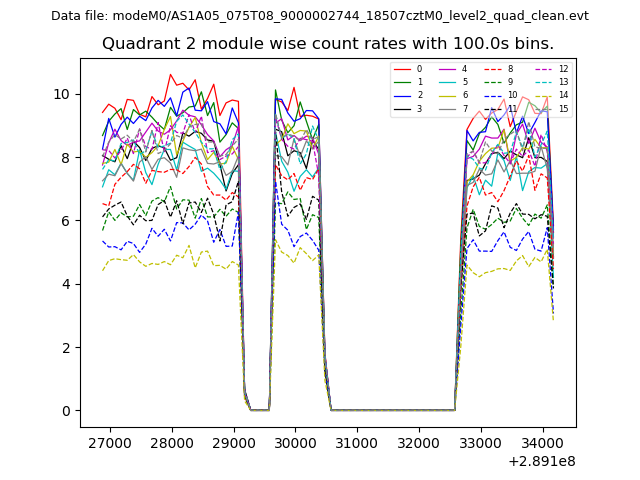
| Module-wise count rates for Quadrant B Data is divided into 100 sec bins |
 |
 |
| Module-wise count rates for Quadrant C Data is divided into 100 sec bins |
 |
 |
| Module-wise count rates for Quadrant D Data is divided into 100 sec bins |
 |
 |
| Parameter | Plot |
|---|---|
| CZT HV Monitor | 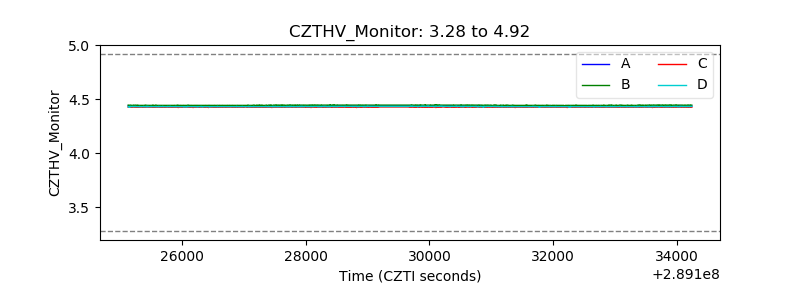 |
| D_VDD | 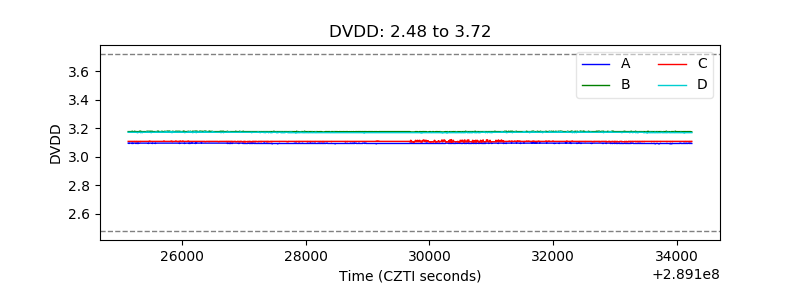 |
| Temperature 1 | 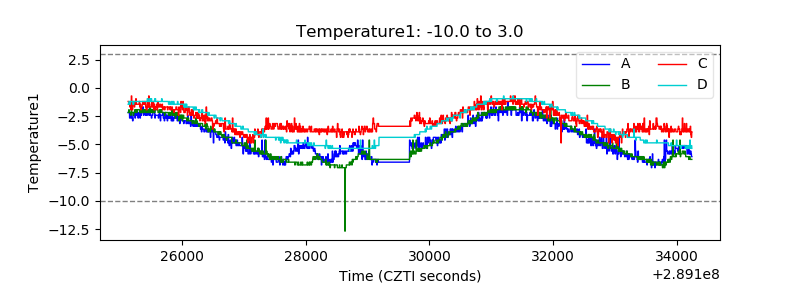 |
| Veto HV Monitor | 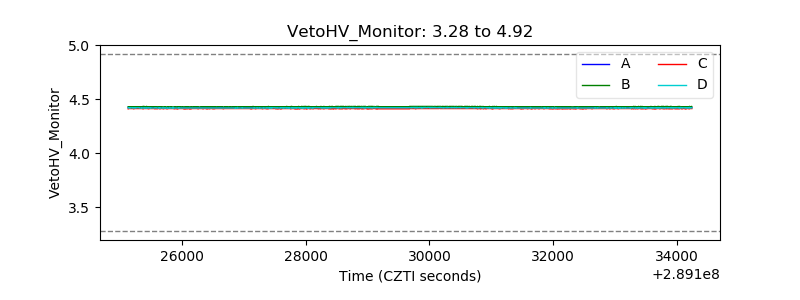 |
| Veto LLD | 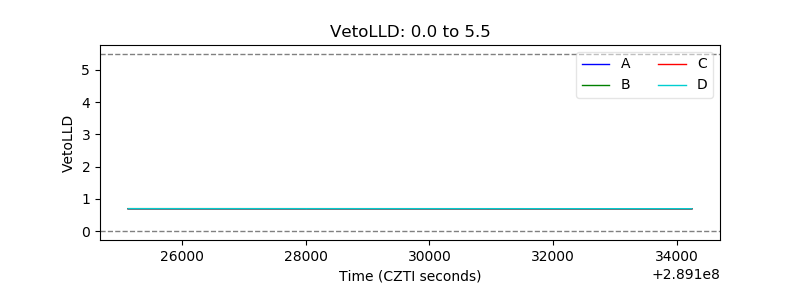 |
| Alpha Counter | 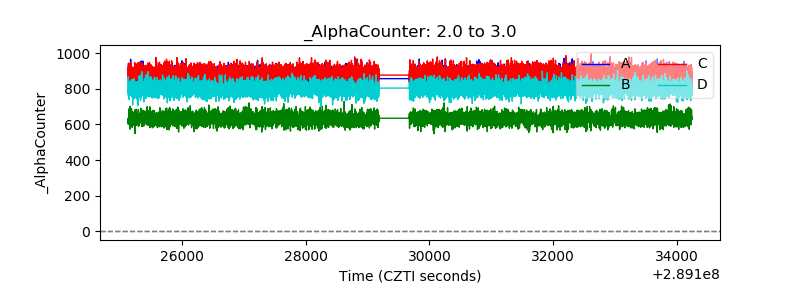 |
| _CPM_Rate | 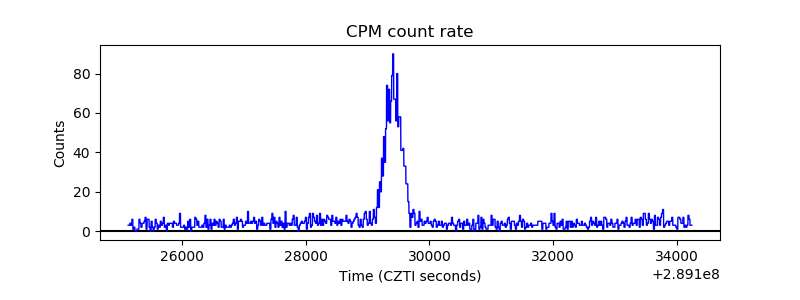 |
| CZT Counter | 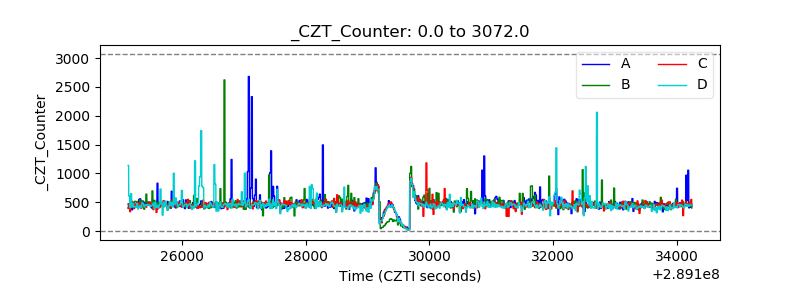 |
| +2.5 Volts monitor |  |
| +5 Volts monitor |  |
| _ROLL_ROT | 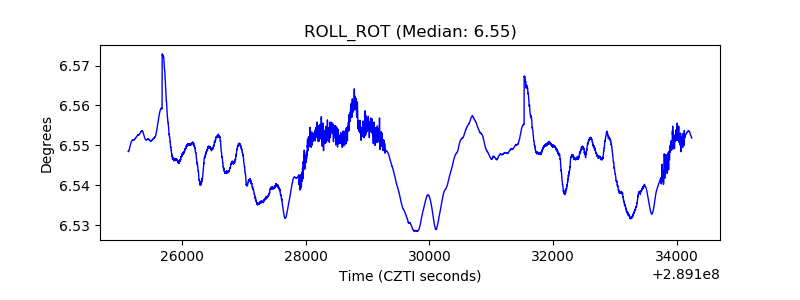 |
| _Roll_DEC | 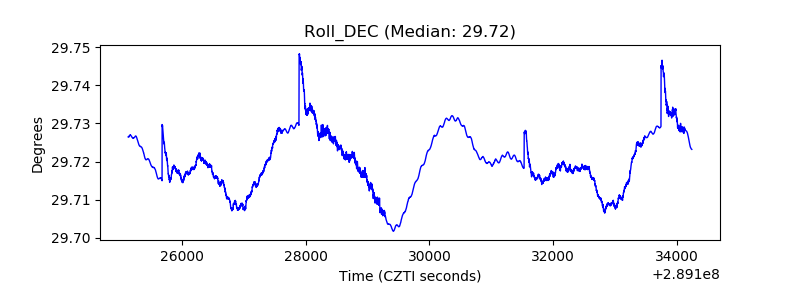 |
| _Roll_RA | 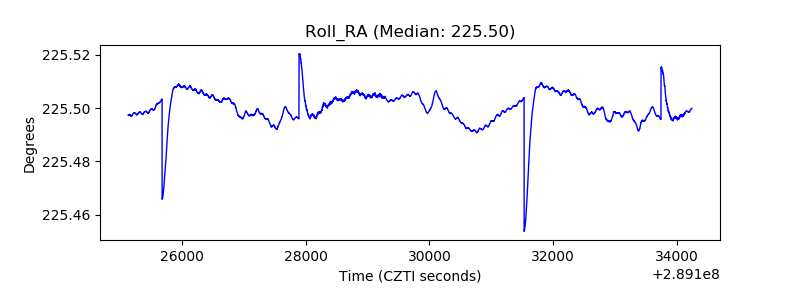 |
| Veto Counter | 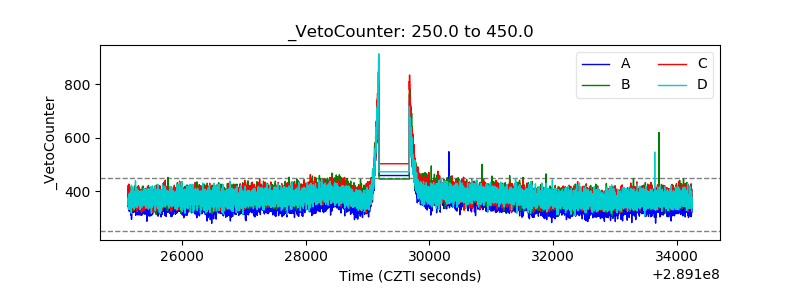 |