| Param | Original file | Final file |
|---|---|---|
| Filename | modeM0/AS1T03_083T01_9000002742cztM0_level2.fits | modeM0/AS1T03_083T01_9000002742cztM0_level2_quad_clean.evt |
| Size (bytes) | 279,000,000 | 324,581,760 |
| Size | 266.1 MB | 309.5 MB |
| Events in quadrant A | 1,704,380 | 2,060,073 |
| Events in quadrant B | 1,627,410 | 2,042,426 |
| Events in quadrant C | 1,665,462 | 1,948,317 |
| Events in quadrant D | 1,459,248 | 1,786,826 |
| Mode M9 | |||
|---|---|---|---|
| Quadrant | BADHDUFLAG | Total packets | Discarded packets |
| A | 0 | 48 | 0 |
| B | 0 | 48 | 0 |
| C | 0 | 48 | 0 |
| D | 0 | 48 | 0 |
| Mode M0 | |||
|---|---|---|---|
| Quadrant | BADHDUFLAG | Total packets | Discarded packets |
| A | 0 | 68030 | 0 |
| B | 0 | 70962 | 0 |
| C | 0 | 61675 | 0 |
| D | 0 | 63771 | 0 |
| Mode SS | |||
|---|---|---|---|
| Quadrant | BADHDUFLAG | Total packets | Discarded packets |
| A | 0 | 588 | 0 |
| B | 0 | 588 | 0 |
| C | 0 | 588 | 0 |
| D | 0 | 588 | 0 |
| Quadrant | Total seconds | Saturated seconds | Saturation percentage |
|---|---|---|---|
| A | 28991 | 784 | 2.704288% |
| B | 28991 | 1218 | 4.201304% |
| C | 28991 | 444 | 1.531510% |
| D | 28991 | 349 | 1.203822% |
Noise dominated data is calculated using 1-second bins in cleaned event files. If a bin has >2000 counts, and if more than 50% of those come from <1% of pixels, then it is considered to be noise-dominated and hence unusable.
| Quadrant | # 1 sec bins | Bins with >0 counts | Bins with >2000 counts | High rate bins dominated by noise | Noise dominated (total time) | Noise dominated (detector-on time) | Marked lightcurve |
|---|---|---|---|---|---|---|---|
| A | 33701 | 28986 | 0 | 0 | 0.00% | 0.00% |  |
| B | 33701 | 28984 | 0 | 0 | 0.00% | 0.00% |  |
| C | 33701 | 28986 | 0 | 0 | 0.00% | 0.00% |  |
| D | 33701 | 28985 | 0 | 0 | 0.00% | 0.00% |  |
Top three noisy pixels from each quadrant. If the there are fewer than three noisy pixels in the level2.evt file, extra rows are filled as -1
| Pixel properties | Quadrant properties | ||||||
|---|---|---|---|---|---|---|---|
| Quadrant | DetID | PixID | Counts | Sigma | Mean | Median | Sigma |
| A | 7 | 110 | 1441 | 9.16 | 443 | 417 | 111.8 |
| A | 0 | 29 | 1420 | 8.97 | 443 | 417 | 111.8 |
| A | 9 | 19 | 1337 | 8.23 | 443 | 417 | 111.8 |
| B | 2 | 9 | 1332 | 10.71 | 430 | 411 | 86.0 |
| B | 2 | 8 | 1099 | 8.0 | 430 | 411 | 86.0 |
| B | 14 | 254 | 1083 | 7.81 | 430 | 411 | 86.0 |
| C | 2 | 191 | 1168 | 6.67 | 439 | 412 | 113.3 |
| C | 3 | 158 | 1139 | 6.42 | 439 | 412 | 113.3 |
| C | 9 | 233 | 1123 | 6.28 | 439 | 412 | 113.3 |
| D | 4 | 246 | 1141 | 6.79 | 415 | 377 | 112.6 |
| D | 10 | 190 | 1084 | 6.28 | 415 | 377 | 112.6 |
| D | 3 | 14 | 1067 | 6.13 | 415 | 377 | 112.6 |
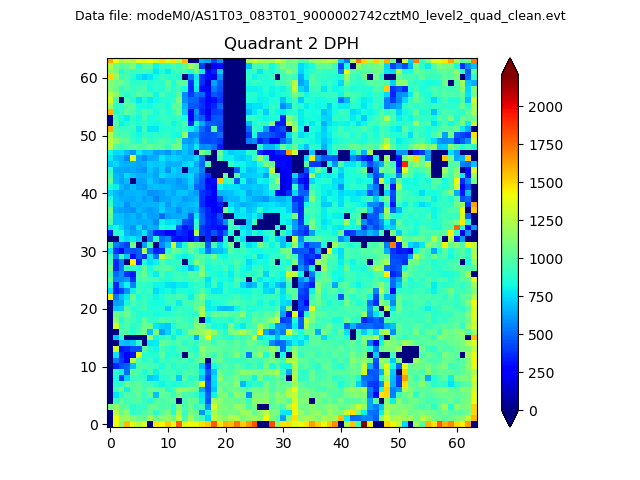
Histogram calculated using DETX and DETY for each event in the final _common_clean file
| Quadrant A |  |
 |
Quadrant B |
|---|---|---|---|
| Quadrant D | 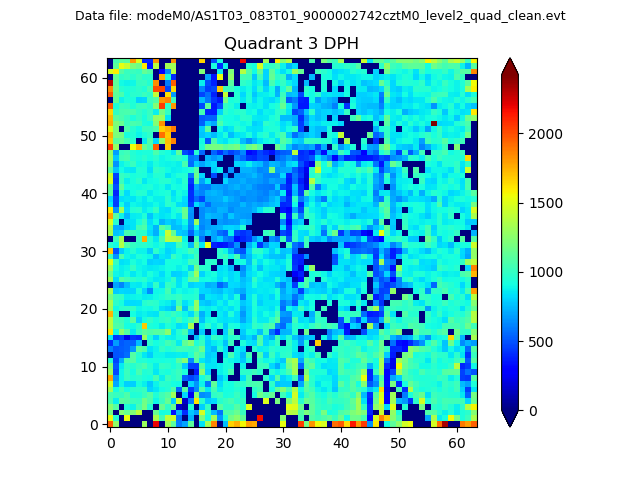 |
 |
Quadrant C |
| Plot type | Count rate plots | Images |
|---|---|---|
| Comparison with Poisson distribution Blue bars denote a histogram of data divided into 1 sec bins. Red curve is a Poisson curve with rate = median count rate of data. |
 |
 |
| Quadrant-wise count rates Data is divided into 100 sec bins |
 |
|
| Module-wise count rates for Quadrant A Data is divided into 100 sec bins |
 |
 |
| Module-wise count rates for Quadrant B Data is divided into 100 sec bins |
 |
 |
| Module-wise count rates for Quadrant C Data is divided into 100 sec bins |
 |
 |
| Module-wise count rates for Quadrant D Data is divided into 100 sec bins |
 |
 |
| Parameter | Plot |
|---|---|
| CZT HV Monitor |  |
| D_VDD |  |
| Temperature 1 |  |
| Veto HV Monitor |  |
| Veto LLD |  |
| Alpha Counter |  |
| _CPM_Rate |  |
| CZT Counter |  |
| +2.5 Volts monitor |  |
| +5 Volts monitor |  |
| _ROLL_ROT |  |
| _Roll_DEC |  |
| _Roll_RA |  |
| Veto Counter |  |