| Param | Original file | Final file |
|---|---|---|
| Filename | modeM0/AS1T03_083T01_9000002742_18493cztM0_level2.evt | modeM0/AS1T03_083T01_9000002742_18493cztM0_level2_quad_clean.evt |
| Size (bytes) | 1,332,204,480 | 303,600,960 |
| Size | 1.2 GB | 289.5 MB |
| Events in quadrant A | 10,282,677 | 2,017,744 |
| Events in quadrant B | 10,550,408 | 2,029,185 |
| Events in quadrant C | 9,209,038 | 1,971,058 |
| Events in quadrant D | 9,083,029 | 1,932,743 |
| Mode M9 | |||
|---|---|---|---|
| Quadrant | BADHDUFLAG | Total packets | Discarded packets |
| A | 0 | 25 | 0 |
| B | 0 | 25 | 0 |
| C | 0 | 25 | 0 |
| D | 0 | 25 | 0 |
| Mode M0 | |||
|---|---|---|---|
| Quadrant | BADHDUFLAG | Total packets | Discarded packets |
| A | 0 | 42471 | 4 |
| B | 0 | 42945 | 4 |
| C | 0 | 38810 | 4 |
| D | 0 | 39322 | 4 |
| Mode SS | |||
|---|---|---|---|
| Quadrant | BADHDUFLAG | Total packets | Discarded packets |
| A | 0 | 366 | 0 |
| B | 0 | 366 | 0 |
| C | 0 | 366 | 0 |
| D | 0 | 366 | 0 |
| Quadrant | Total seconds | Saturated seconds | Saturation percentage |
|---|---|---|---|
| A | 18072 | 511 | 2.827579% |
| B | 18072 | 608 | 3.364320% |
| C | 18072 | 318 | 1.759628% |
| D | 18072 | 226 | 1.250553% |
Noise dominated data is calculated using 1-second bins in cleaned event files. If a bin has >2000 counts, and if more than 50% of those come from <1% of pixels, then it is considered to be noise-dominated and hence unusable.
| Quadrant | # 1 sec bins | Bins with >0 counts | Bins with >2000 counts | High rate bins dominated by noise | Noise dominated (total time) | Noise dominated (detector-on time) | Marked lightcurve |
|---|---|---|---|---|---|---|---|
| A | 20442 | 18072 | 244 | 244 | 1.19% | 1.35% | 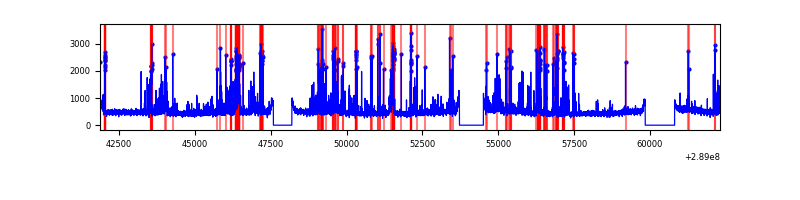 |
| B | 20442 | 18072 | 274 | 274 | 1.34% | 1.52% | 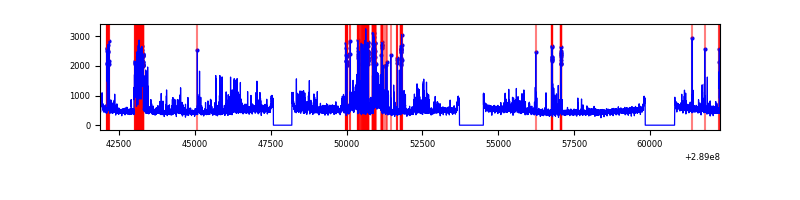 |
| C | 20442 | 18072 | 15 | 15 | 0.07% | 0.08% | 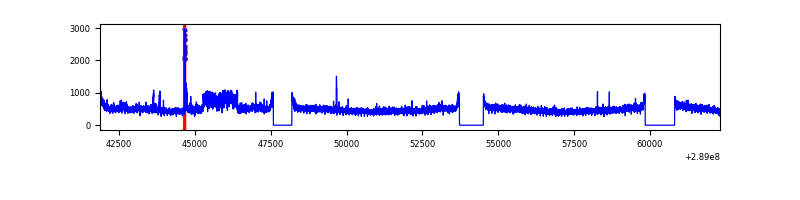 |
| D | 20442 | 18072 | 54 | 54 | 0.26% | 0.30% | 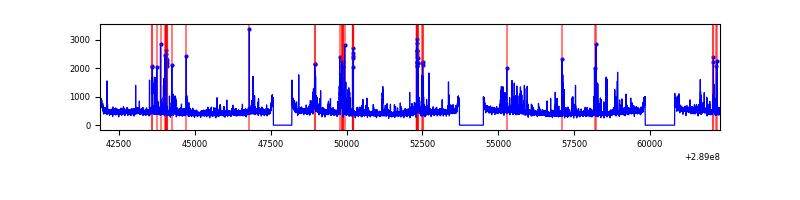 |
Top three noisy pixels from each quadrant. If the there are fewer than three noisy pixels in the level2.evt file, extra rows are filled as -1
| Pixel properties | Quadrant properties | ||||||
|---|---|---|---|---|---|---|---|
| Quadrant | DetID | PixID | Counts | Sigma | Mean | Median | Sigma |
| A | 0 | 13 | 1419837 | 3245.67 | 2171 | 2128 | 436.8 |
| A | 4 | 2 | 311395 | 708.03 | 2171 | 2128 | 436.8 |
| A | 15 | 174 | 196099 | 444.07 | 2171 | 2128 | 436.8 |
| B | 10 | 245 | 1819423 | 4452.9 | 2165 | 2111 | 408.1 |
| B | 7 | 220 | 94765 | 227.03 | 2165 | 2111 | 408.1 |
| B | 12 | 111 | 48124 | 112.74 | 2165 | 2111 | 408.1 |
| C | 3 | 233 | 655988 | 1345.35 | 2093 | 2108 | 486.0 |
| C | 14 | 238 | 323822 | 661.92 | 2093 | 2108 | 486.0 |
| C | 7 | 247 | 52181 | 103.02 | 2093 | 2108 | 486.0 |
| D | 1 | 52 | 441266 | 861.13 | 2121 | 2062 | 510.0 |
| D | 7 | 238 | 379374 | 739.78 | 2121 | 2062 | 510.0 |
| D | 7 | 38 | 203745 | 395.43 | 2121 | 2062 | 510.0 |
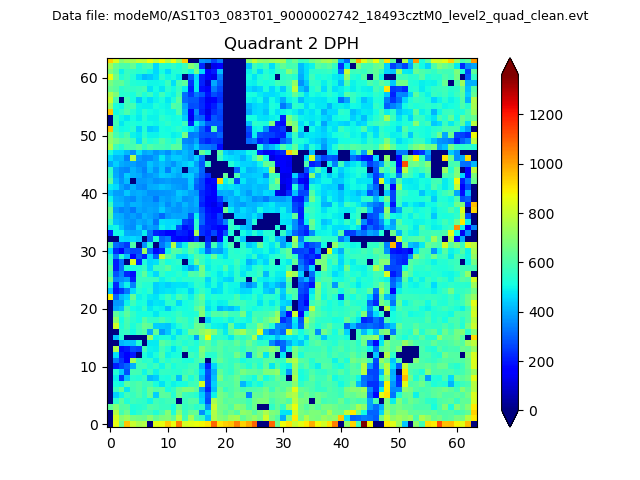
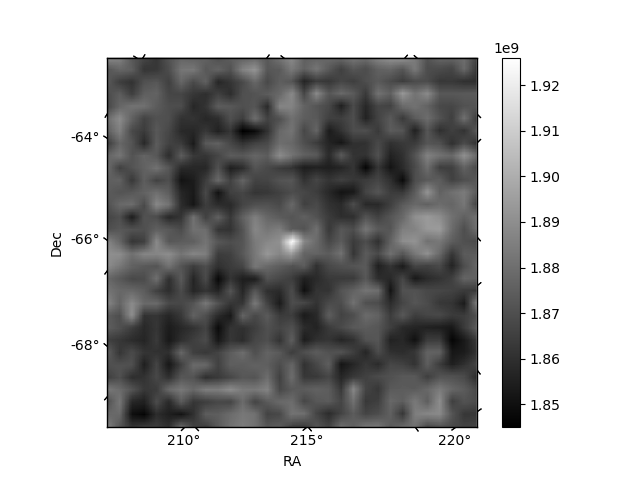
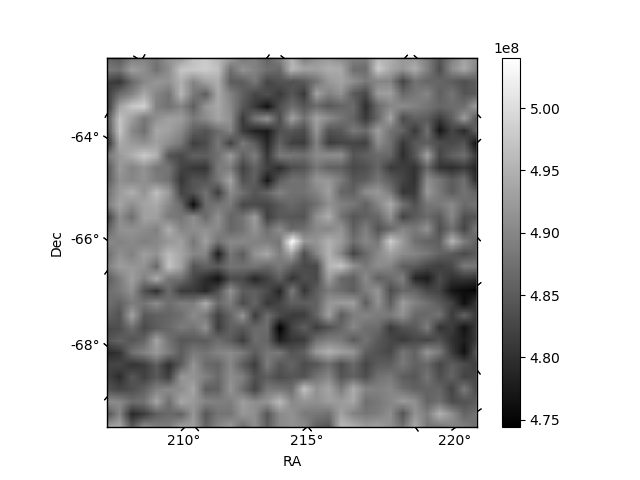
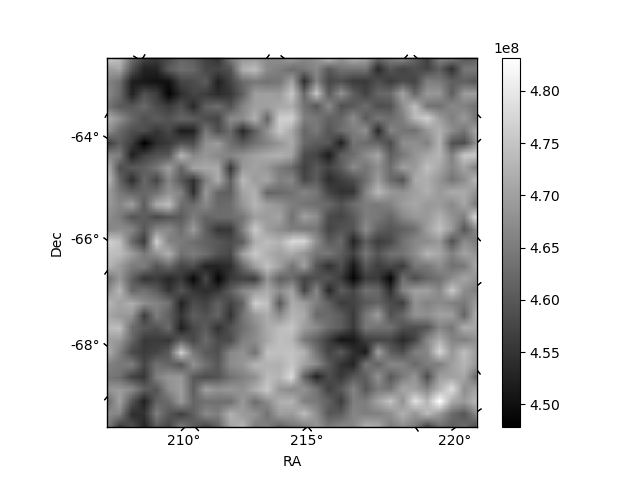
Histogram calculated using DETX and DETY for each event in the final _common_clean file
| Quadrant A | 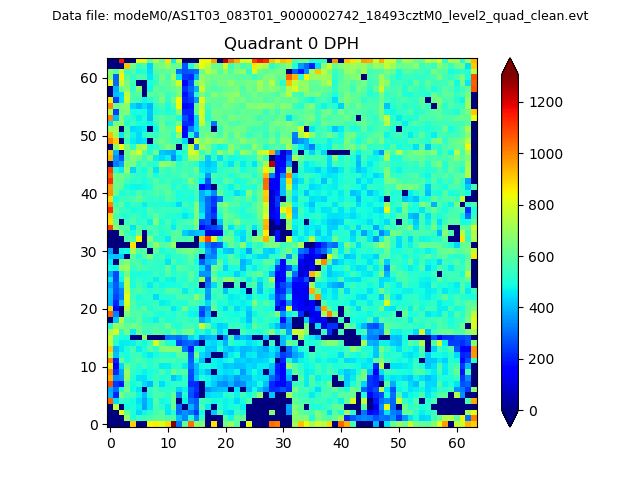 |
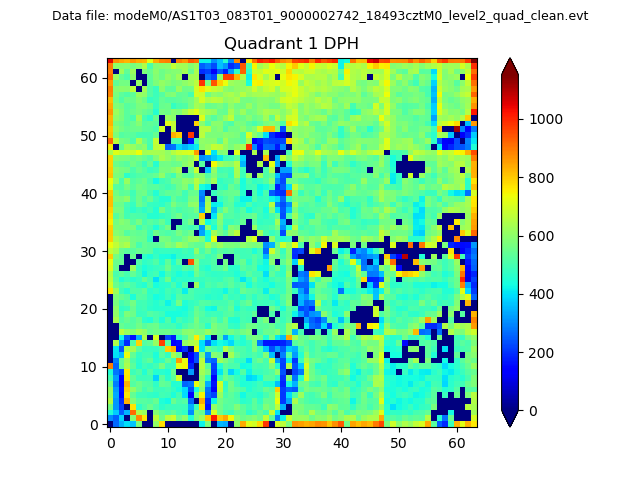 |
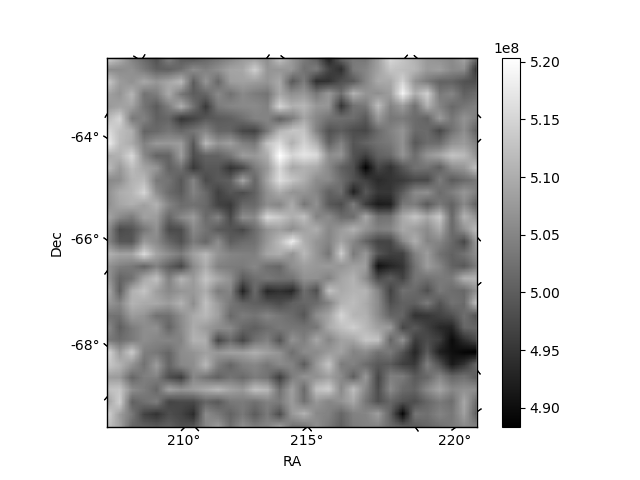
Quadrant B |
|---|---|---|---|
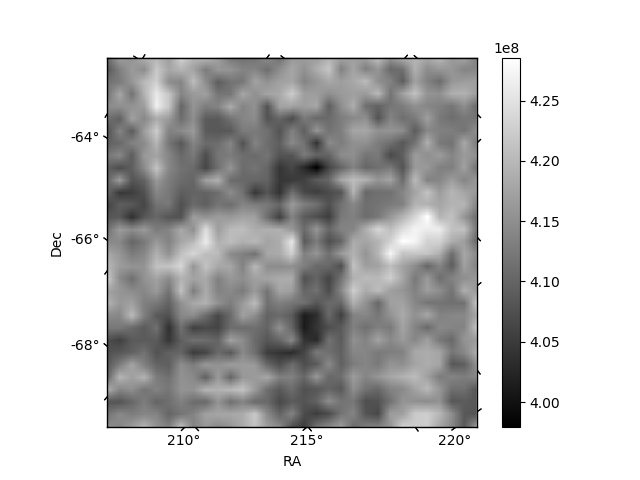
| Quadrant D | 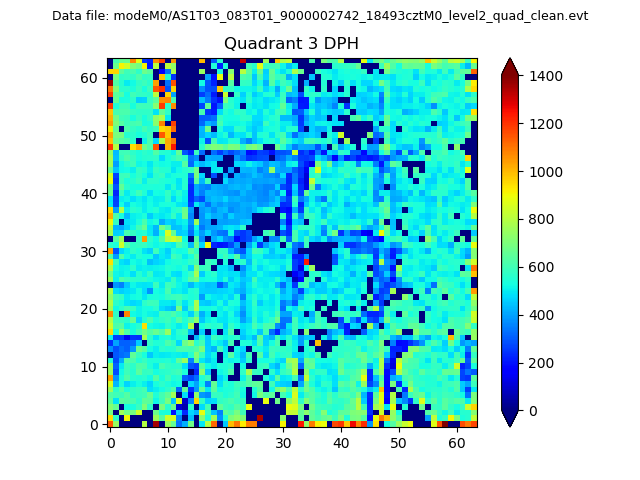 |
 |
Quadrant C |
| Plot type | Count rate plots | Images |
|---|---|---|
| Comparison with Poisson distribution Blue bars denote a histogram of data divided into 1 sec bins. Red curve is a Poisson curve with rate = median count rate of data. |
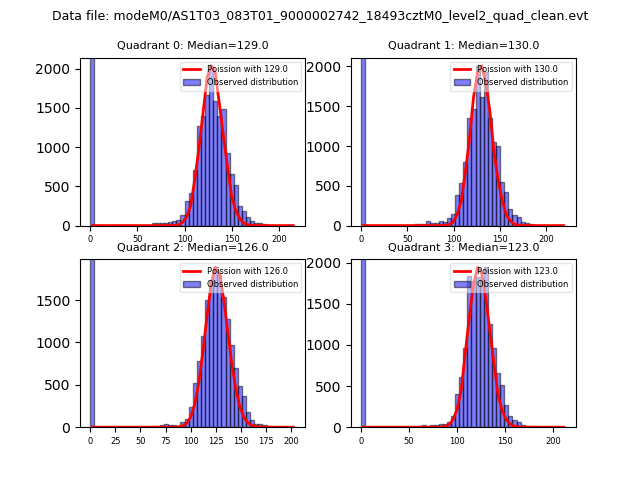 |
 |
| Quadrant-wise count rates Data is divided into 100 sec bins |
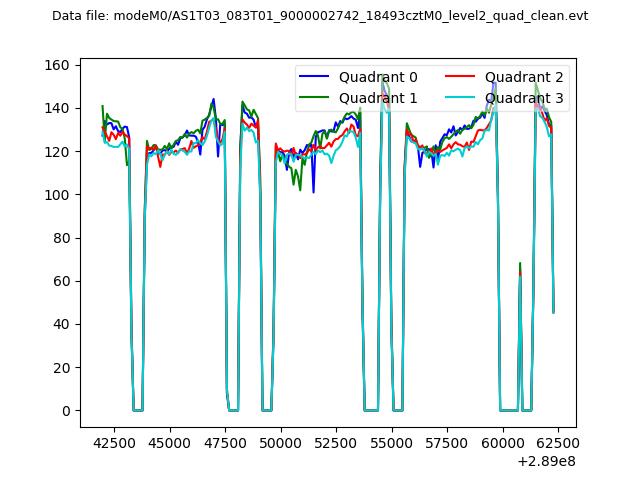 |
|
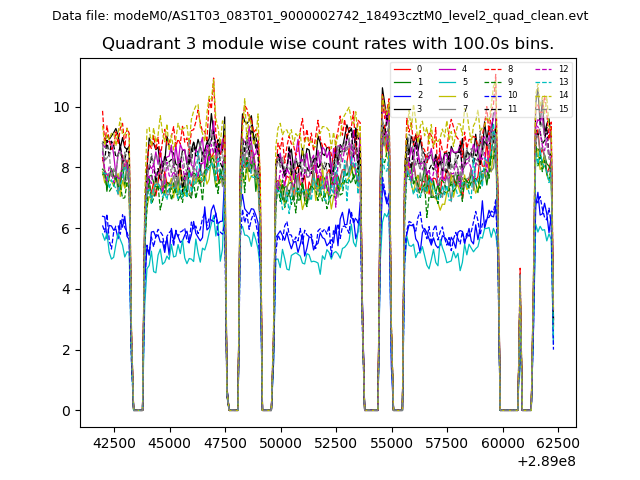
| Module-wise count rates for Quadrant A Data is divided into 100 sec bins |
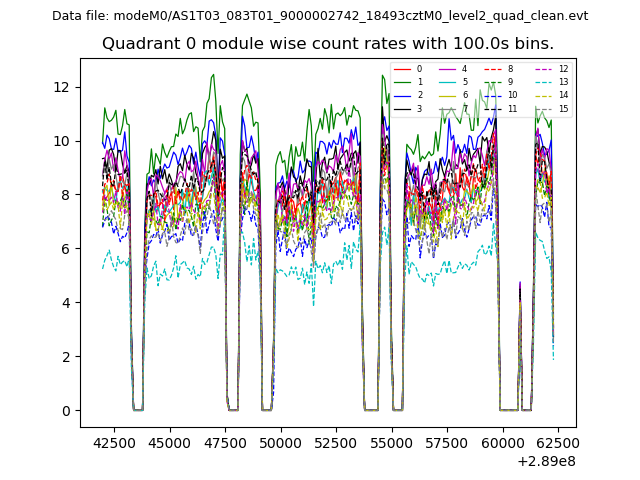 |
 |
| Module-wise count rates for Quadrant B Data is divided into 100 sec bins |
 |
 |
| Module-wise count rates for Quadrant C Data is divided into 100 sec bins |
 |
 |
| Module-wise count rates for Quadrant D Data is divided into 100 sec bins |
 |
 |
| Parameter | Plot |
|---|---|
| CZT HV Monitor |  |
| D_VDD | 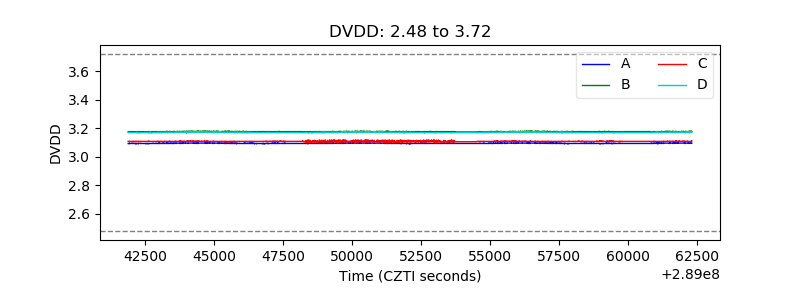 |
| Temperature 1 | 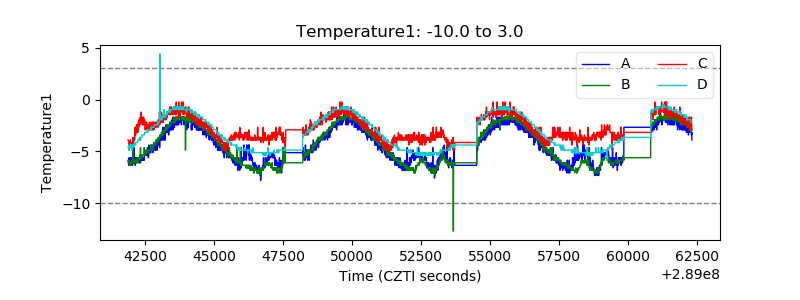 |
| Veto HV Monitor |  |
| Veto LLD | 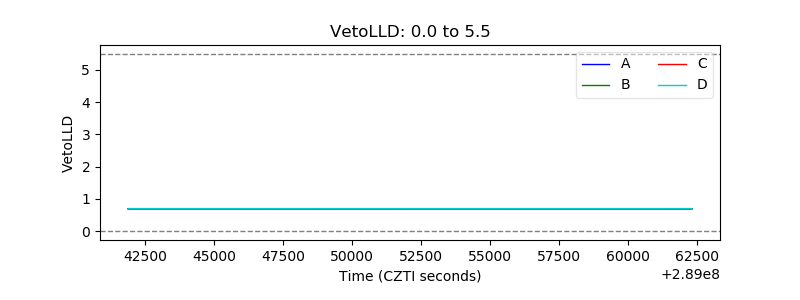 |
| Alpha Counter | 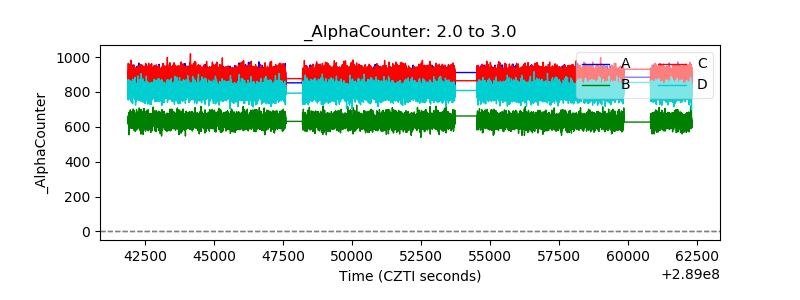 |
| _CPM_Rate | 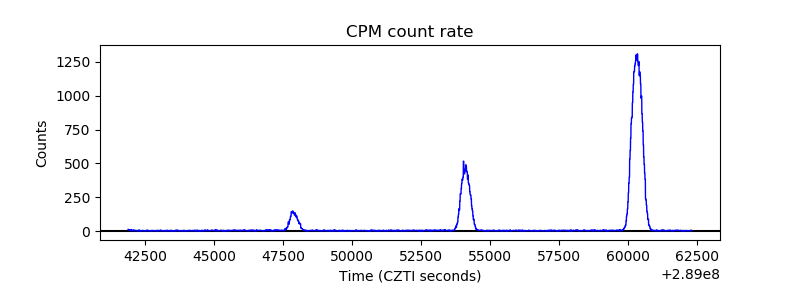 |
| CZT Counter | 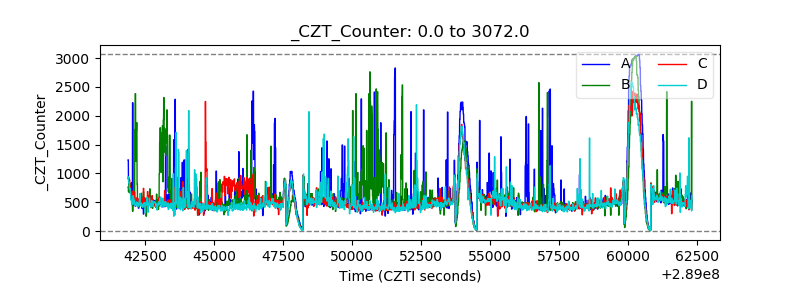 |
| +2.5 Volts monitor | 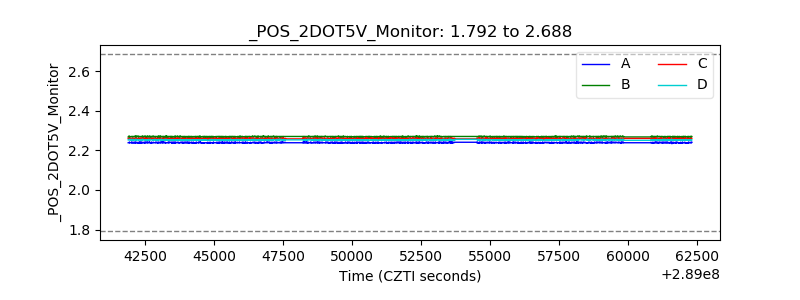 |
| +5 Volts monitor |  |
| _ROLL_ROT |  |
| _Roll_DEC | 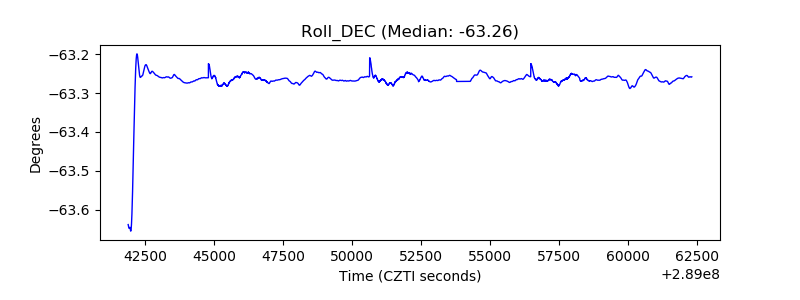 |
| _Roll_RA | 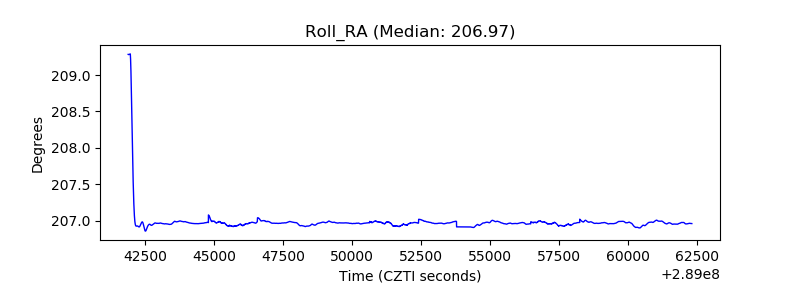 |
| Veto Counter |  |