| Param | Original file | Final file |
|---|---|---|
| Filename | modeM0/AS1T03_083T01_9000002742_18496cztM0_level2.evt | modeM0/AS1T03_083T01_9000002742_18496cztM0_level2_quad_clean.evt |
| Size (bytes) | 509,201,280 | 131,319,360 |
| Size | 485.6 MB | 125.2 MB |
| Events in quadrant A | 3,730,651 | 909,415 |
| Events in quadrant B | 4,685,915 | 899,597 |
| Events in quadrant C | 3,130,236 | 879,510 |
| Events in quadrant D | 3,450,205 | 852,507 |
| Mode M9 | |||
|---|---|---|---|
| Quadrant | BADHDUFLAG | Total packets | Discarded packets |
| A | 0 | 12 | 0 |
| B | 0 | 12 | 0 |
| C | 0 | 12 | 0 |
| D | 0 | 12 | 0 |
| Mode M0 | |||
|---|---|---|---|
| Quadrant | BADHDUFLAG | Total packets | Discarded packets |
| A | 0 | 15202 | 1 |
| B | 0 | 18038 | 1 |
| C | 0 | 13339 | 1 |
| D | 0 | 14473 | 1 |
| Mode SS | |||
|---|---|---|---|
| Quadrant | BADHDUFLAG | Total packets | Discarded packets |
| A | 0 | 126 | 0 |
| B | 0 | 126 | 0 |
| C | 0 | 126 | 0 |
| D | 0 | 126 | 0 |
| Quadrant | Total seconds | Saturated seconds | Saturation percentage |
|---|---|---|---|
| A | 6254 | 182 | 2.910138% |
| B | 6255 | 552 | 8.824940% |
| C | 6255 | 70 | 1.119105% |
| D | 6255 | 79 | 1.262990% |
Noise dominated data is calculated using 1-second bins in cleaned event files. If a bin has >2000 counts, and if more than 50% of those come from <1% of pixels, then it is considered to be noise-dominated and hence unusable.
| Quadrant | # 1 sec bins | Bins with >0 counts | Bins with >2000 counts | High rate bins dominated by noise | Noise dominated (total time) | Noise dominated (detector-on time) | Marked lightcurve |
|---|---|---|---|---|---|---|---|
| A | 7479 | 6254 | 106 | 106 | 1.42% | 1.69% | 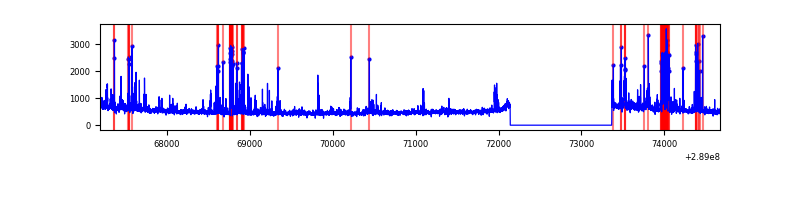 |
| B | 7479 | 6254 | 389 | 389 | 5.20% | 6.22% | 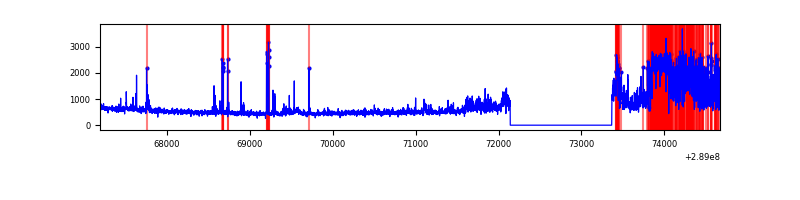 |
| C | 7480 | 6255 | 0 | 0 | 0.00% | 0.00% | 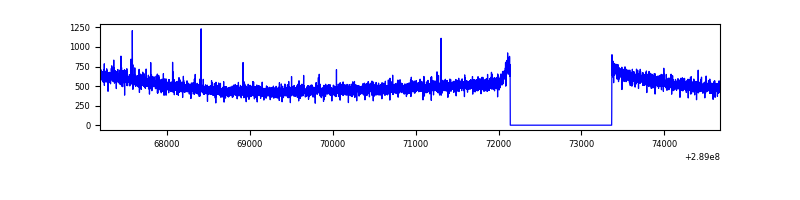 |
| D | 7480 | 6255 | 62 | 62 | 0.83% | 0.99% | 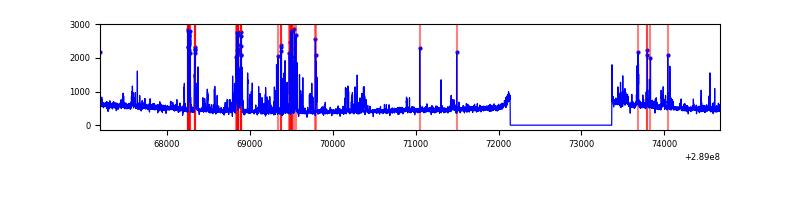 |
Top three noisy pixels from each quadrant. If the there are fewer than three noisy pixels in the level2.evt file, extra rows are filled as -1
| Pixel properties | Quadrant properties | ||||||
|---|---|---|---|---|---|---|---|
| Quadrant | DetID | PixID | Counts | Sigma | Mean | Median | Sigma |
| A | 0 | 13 | 587326 | 3666.86 | 803 | 788 | 160.0 |
| A | 15 | 192 | 52228 | 321.59 | 803 | 788 | 160.0 |
| A | 13 | 254 | 9194 | 52.55 | 803 | 788 | 160.0 |
| B | 10 | 245 | 1486347 | 10066.18 | 786 | 771 | 147.6 |
| B | 7 | 220 | 40195 | 267.13 | 786 | 771 | 147.6 |
| B | 4 | 216 | 27762 | 182.89 | 786 | 771 | 147.6 |
| C | 14 | 238 | 120831 | 680.46 | 765 | 772 | 176.4 |
| C | 3 | 233 | 19263 | 104.8 | 765 | 772 | 176.4 |
| C | 7 | 247 | 8921 | 46.19 | 765 | 772 | 176.4 |
| D | 12 | 110 | 314751 | 1688.62 | 768 | 745 | 186.0 |
| D | 7 | 238 | 97449 | 520.04 | 768 | 745 | 186.0 |
| D | 1 | 52 | 84600 | 450.94 | 768 | 745 | 186.0 |
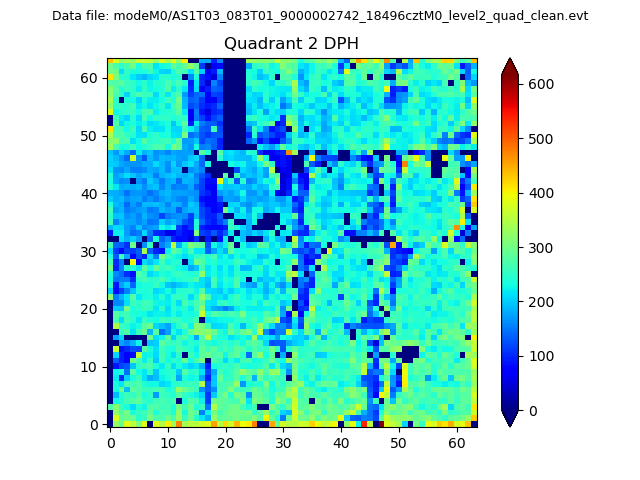
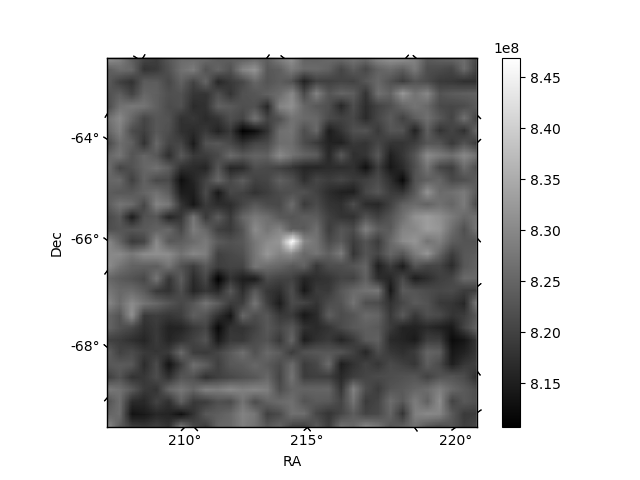
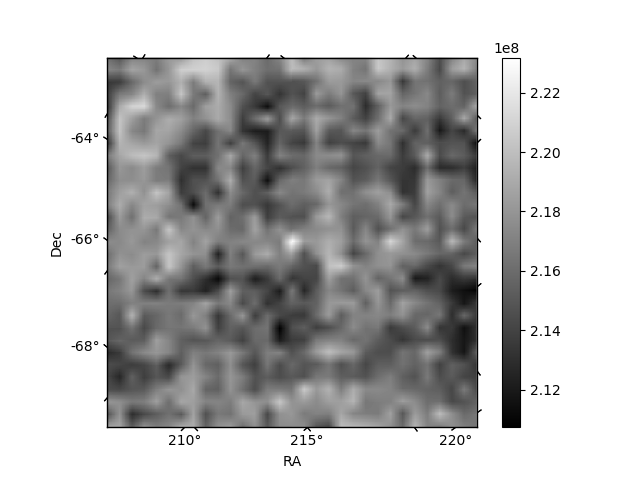
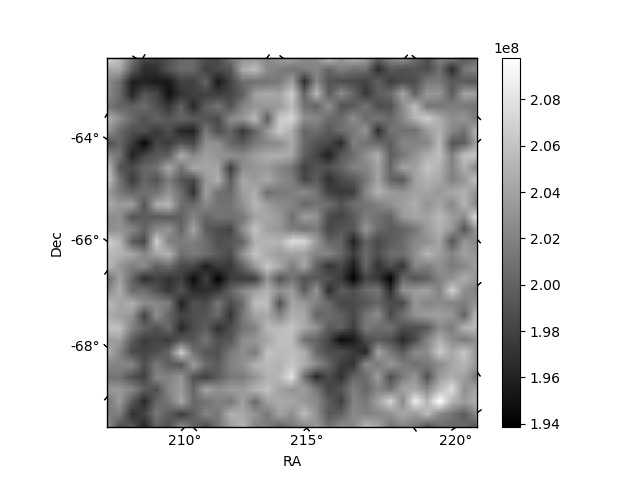
Histogram calculated using DETX and DETY for each event in the final _common_clean file
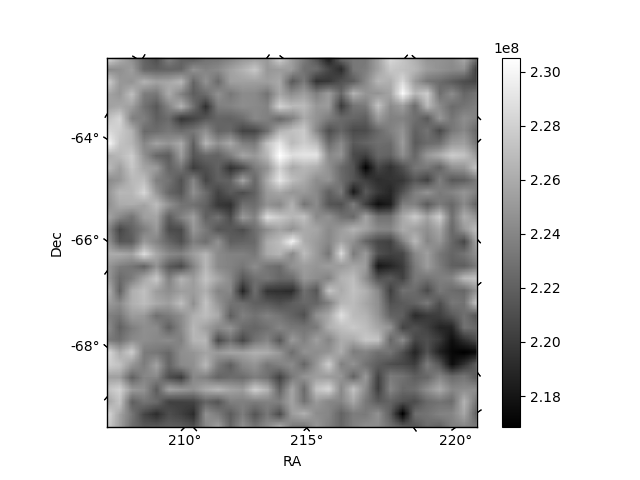
| Quadrant A | 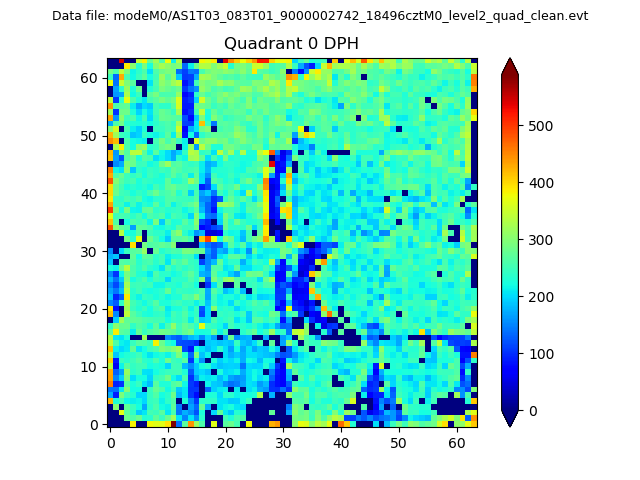 |
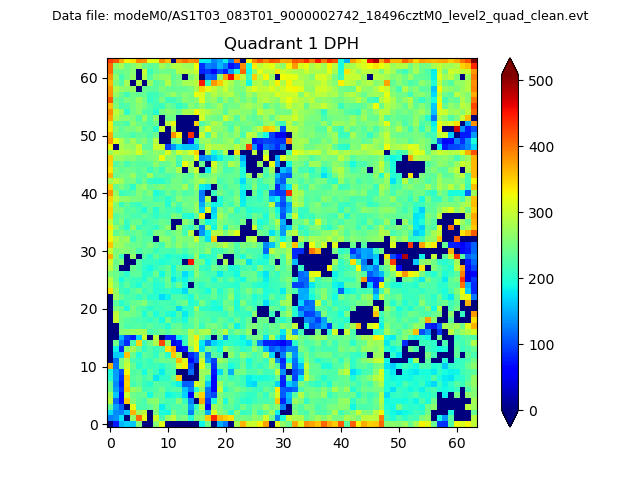 |
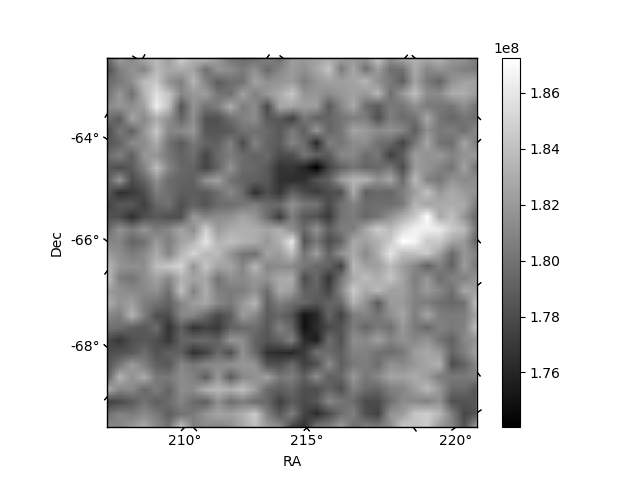
Quadrant B |
|---|---|---|---|
| Quadrant D | 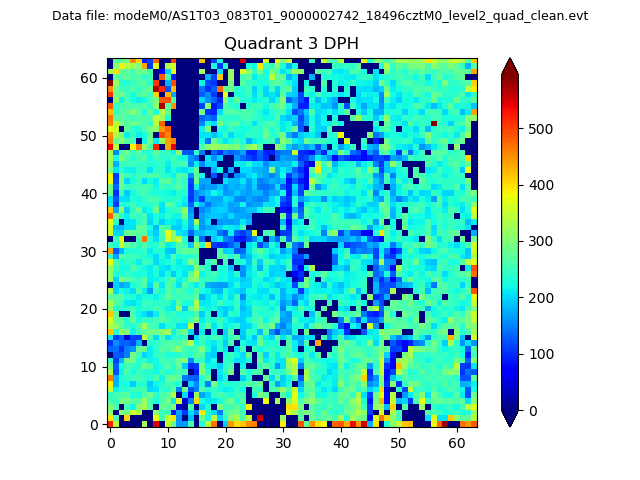 |
 |
Quadrant C |
| Plot type | Count rate plots | Images |
|---|---|---|
| Comparison with Poisson distribution Blue bars denote a histogram of data divided into 1 sec bins. Red curve is a Poisson curve with rate = median count rate of data. |
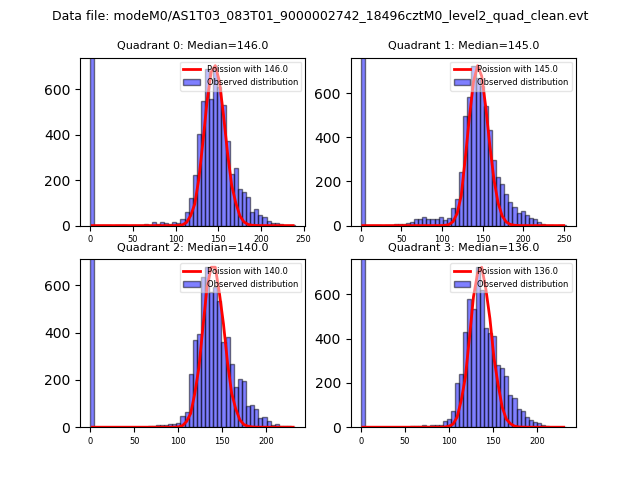 |
 |
| Quadrant-wise count rates Data is divided into 100 sec bins |
 |
|
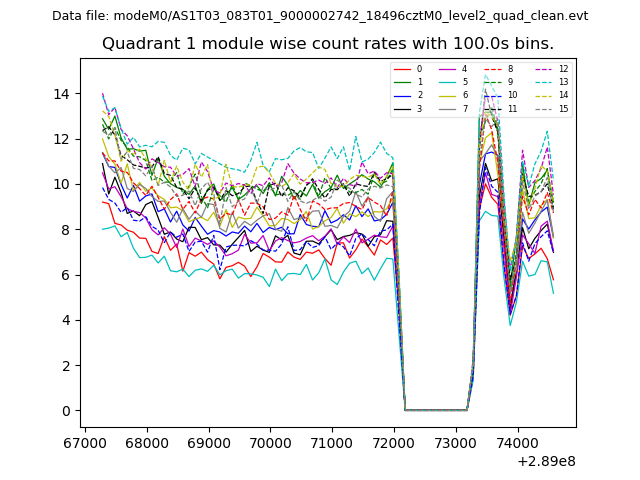
| Module-wise count rates for Quadrant A Data is divided into 100 sec bins |
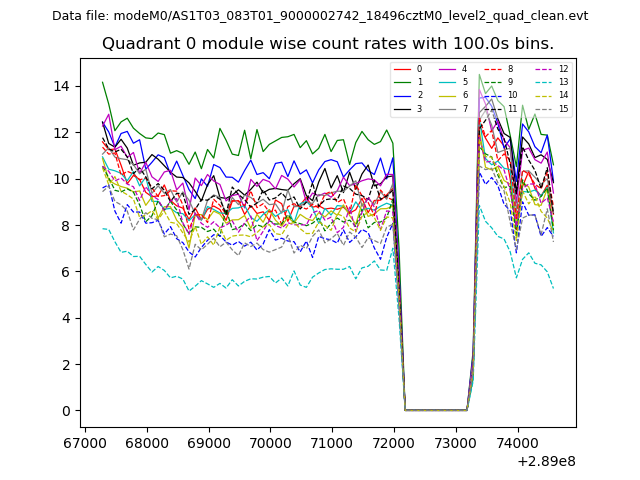 |
 |
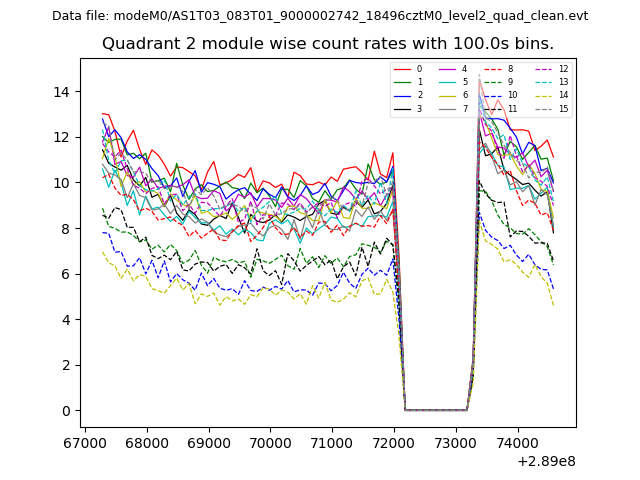
| Module-wise count rates for Quadrant B Data is divided into 100 sec bins |
 |
 |
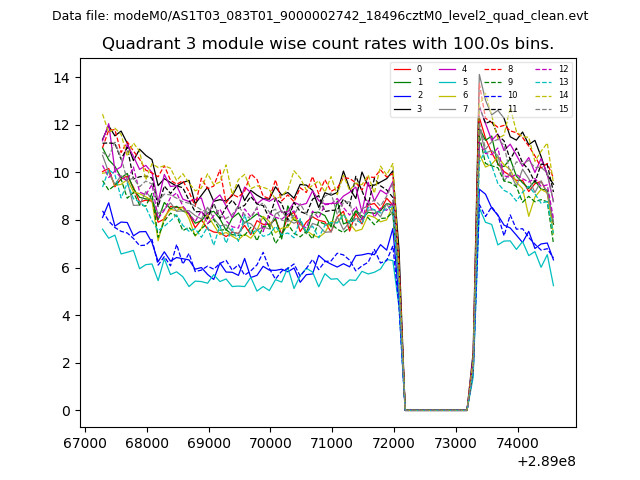
| Module-wise count rates for Quadrant C Data is divided into 100 sec bins |
 |
 |
| Module-wise count rates for Quadrant D Data is divided into 100 sec bins |
 |
 |
| Parameter | Plot |
|---|---|
| CZT HV Monitor | 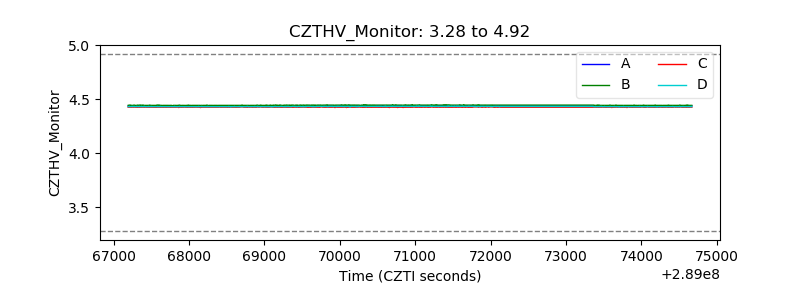 |
| D_VDD | 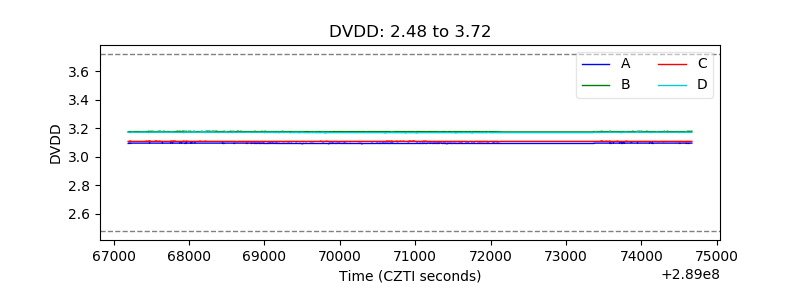 |
| Temperature 1 | 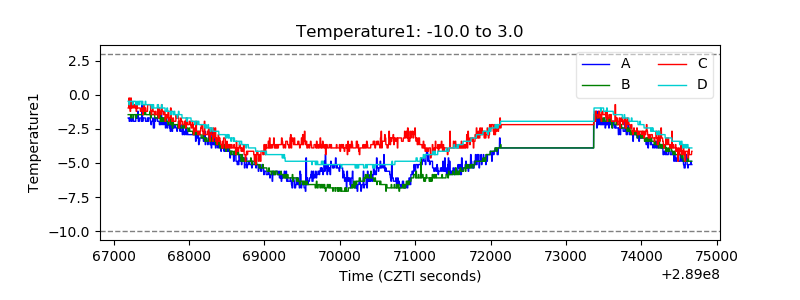 |
| Veto HV Monitor |  |
| Veto LLD | 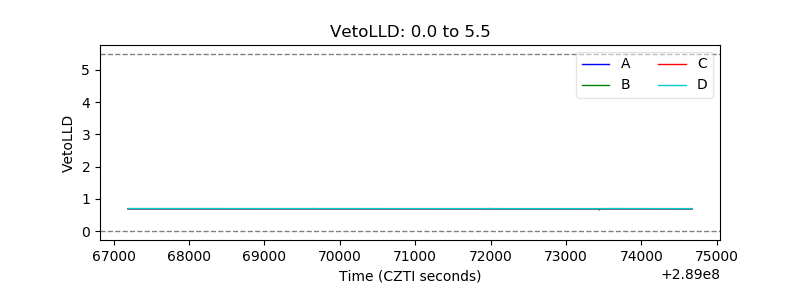 |
| Alpha Counter | 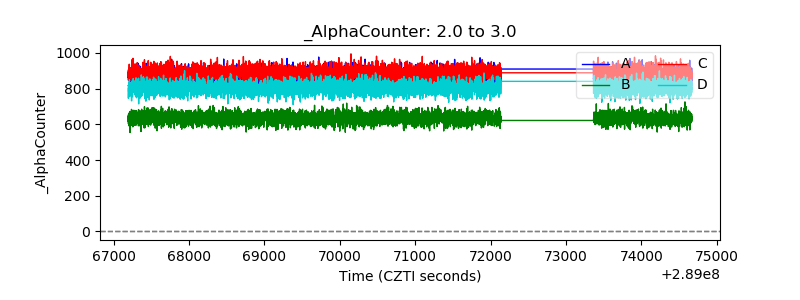 |
| _CPM_Rate | 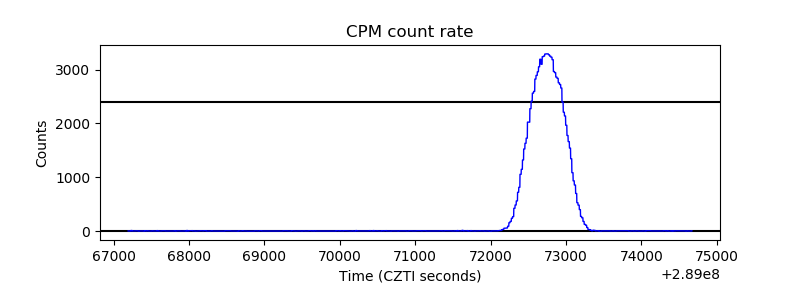 |
| CZT Counter | 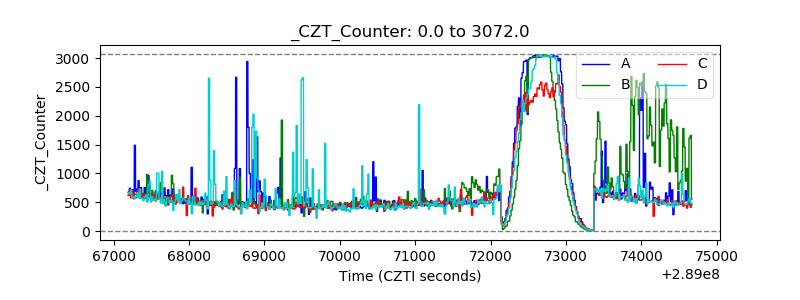 |
| +2.5 Volts monitor | 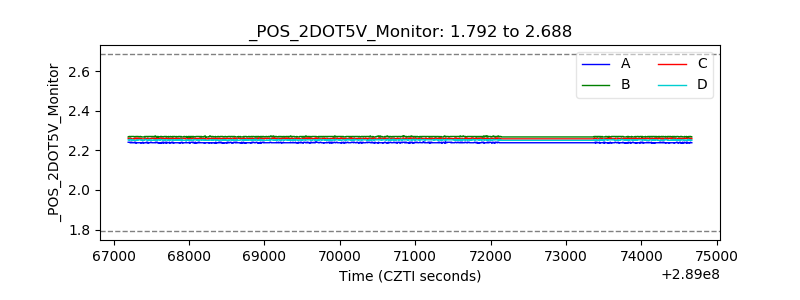 |
| +5 Volts monitor |  |
| _ROLL_ROT | 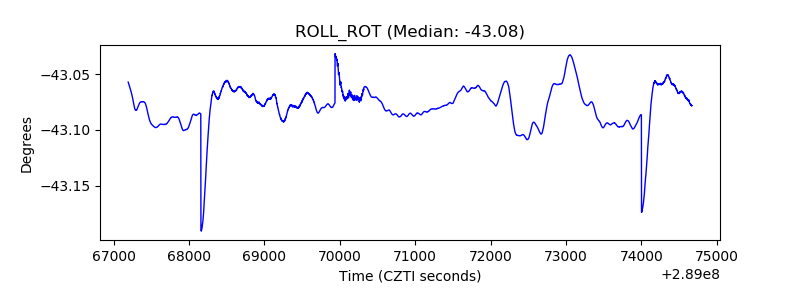 |
| _Roll_DEC | 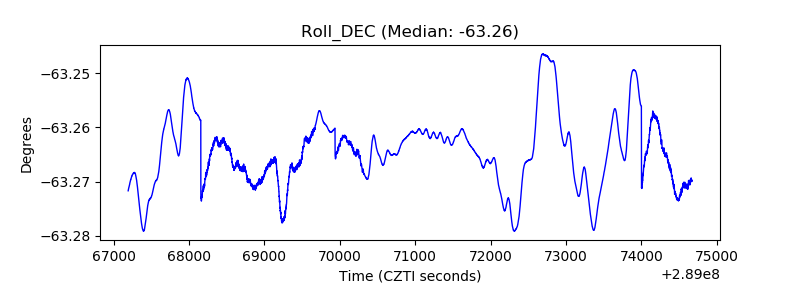 |
| _Roll_RA | 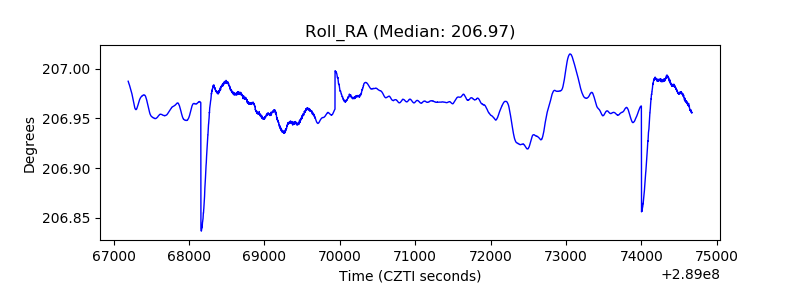 |
| Veto Counter | 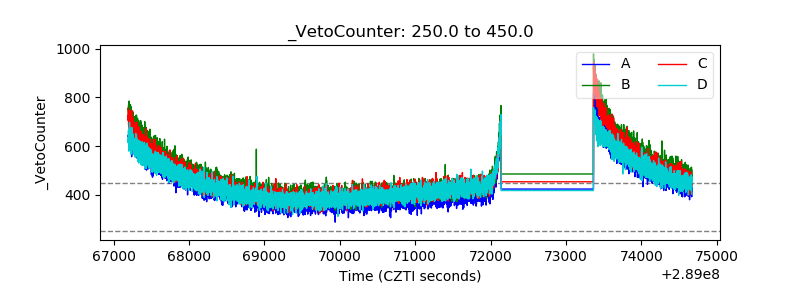 |