| Param | Original file | Final file |
|---|---|---|
| Filename | modeM0/AS1T03_083T01_9000002742_18497cztM0_level2.evt | modeM0/AS1T03_083T01_9000002742_18497cztM0_level2_quad_clean.evt |
| Size (bytes) | 213,436,800 | 49,354,560 |
| Size | 203.5 MB | 47.1 MB |
| Events in quadrant A | 1,417,558 | 346,484 |
| Events in quadrant B | 2,526,485 | 323,851 |
| Events in quadrant C | 1,118,613 | 337,848 |
| Events in quadrant D | 1,249,562 | 326,644 |
| Mode M9 | |||
|---|---|---|---|
| Quadrant | BADHDUFLAG | Total packets | Discarded packets |
| A | 0 | 1 | 0 |
| B | 0 | 2 | 0 |
| C | 0 | 2 | 0 |
| D | 0 | 2 | 0 |
| Mode M0 | |||
|---|---|---|---|
| Quadrant | BADHDUFLAG | Total packets | Discarded packets |
| A | 0 | 5713 | 1 |
| B | 0 | 9003 | 1 |
| C | 0 | 4805 | 1 |
| D | 0 | 5145 | 1 |
| Mode SS | |||
|---|---|---|---|
| Quadrant | BADHDUFLAG | Total packets | Discarded packets |
| A | 0 | 44 | 0 |
| B | 0 | 44 | 0 |
| C | 0 | 44 | 0 |
| D | 0 | 44 | 0 |
| Quadrant | Total seconds | Saturated seconds | Saturation percentage |
|---|---|---|---|
| A | 2206 | 79 | 3.581142% |
| B | 2206 | 497 | 22.529465% |
| C | 2206 | 10 | 0.453309% |
| D | 2206 | 7 | 0.317316% |
Noise dominated data is calculated using 1-second bins in cleaned event files. If a bin has >2000 counts, and if more than 50% of those come from <1% of pixels, then it is considered to be noise-dominated and hence unusable.
| Quadrant | # 1 sec bins | Bins with >0 counts | Bins with >2000 counts | High rate bins dominated by noise | Noise dominated (total time) | Noise dominated (detector-on time) | Marked lightcurve |
|---|---|---|---|---|---|---|---|
| A | 2206 | 2206 | 61 | 61 | 2.77% | 2.77% | 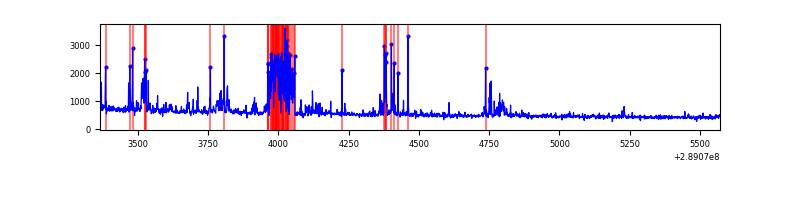 |
| B | 2206 | 2206 | 390 | 390 | 17.68% | 17.68% | 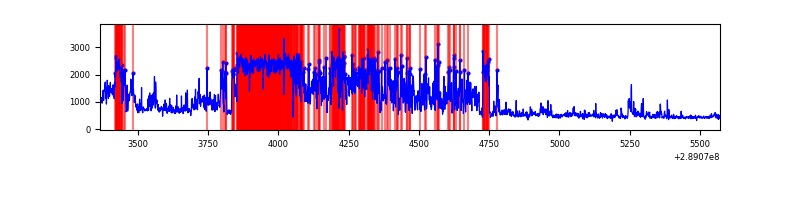 |
| C | 2206 | 2206 | 0 | 0 | 0.00% | 0.00% | 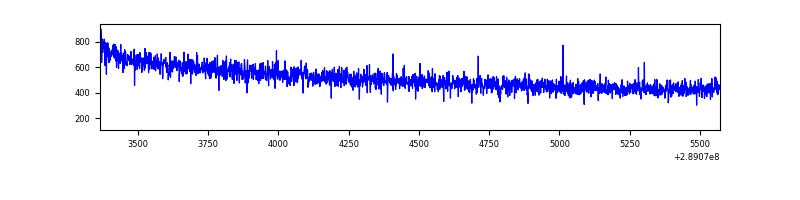 |
| D | 2206 | 2206 | 5 | 5 | 0.23% | 0.23% | 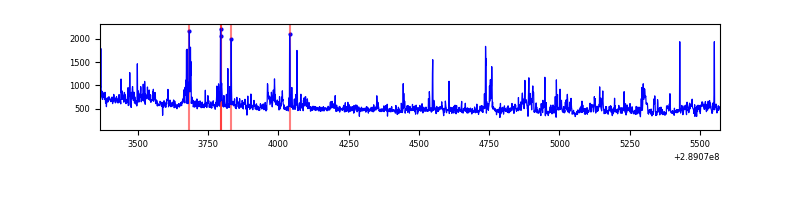 |
Top three noisy pixels from each quadrant. If the there are fewer than three noisy pixels in the level2.evt file, extra rows are filled as -1
| Pixel properties | Quadrant properties | ||||||
|---|---|---|---|---|---|---|---|
| Quadrant | DetID | PixID | Counts | Sigma | Mean | Median | Sigma |
| A | 0 | 13 | 283578 | 4741.42 | 291 | 287 | 59.7 |
| A | 15 | 192 | 10164 | 165.31 | 291 | 287 | 59.7 |
| A | 13 | 254 | 3379 | 51.75 | 291 | 287 | 59.7 |
| B | 10 | 245 | 1396614 | 26340.7 | 274 | 269 | 53.0 |
| B | 4 | 216 | 23948 | 446.68 | 274 | 269 | 53.0 |
| B | 0 | 228 | 20125 | 374.56 | 274 | 269 | 53.0 |
| C | 14 | 238 | 43891 | 679.29 | 274 | 276 | 64.2 |
| C | 3 | 233 | 4801 | 70.48 | 274 | 276 | 64.2 |
| C | 13 | 61 | 1927 | 25.71 | 274 | 276 | 64.2 |
| D | 7 | 238 | 79151 | 1148.67 | 276 | 267 | 68.7 |
| D | 7 | 223 | 49280 | 713.71 | 276 | 267 | 68.7 |
| D | 1 | 52 | 42236 | 611.13 | 276 | 267 | 68.7 |
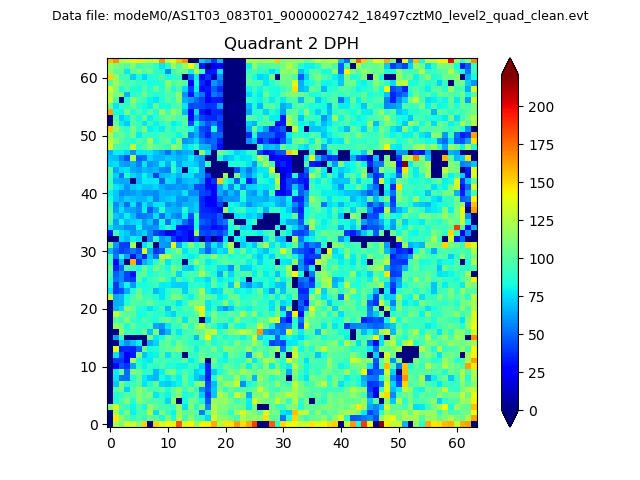
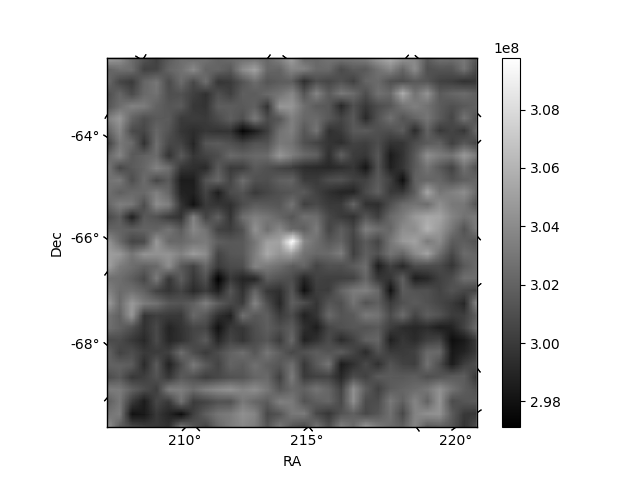
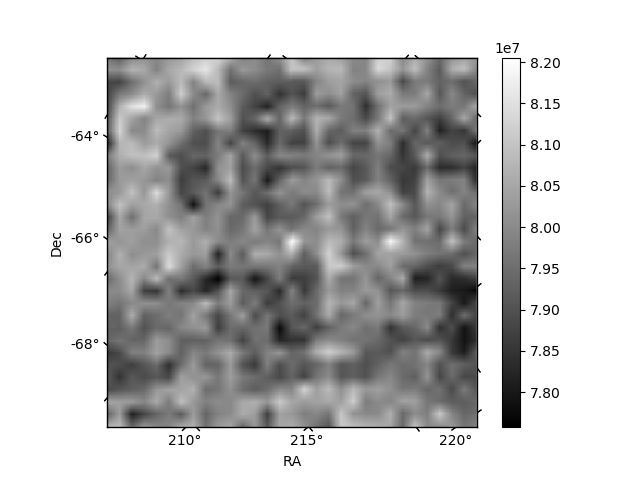
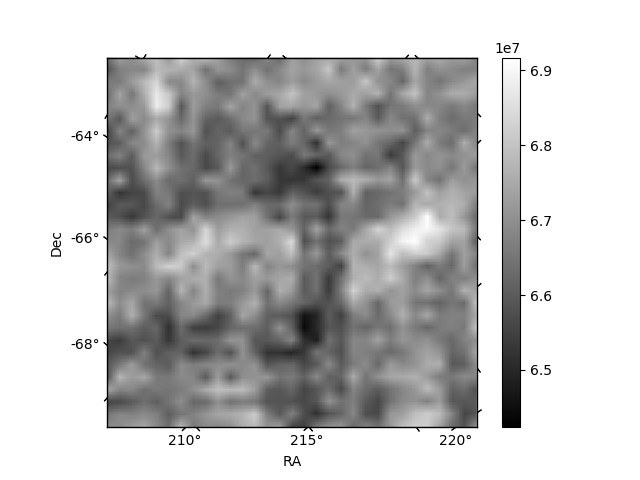
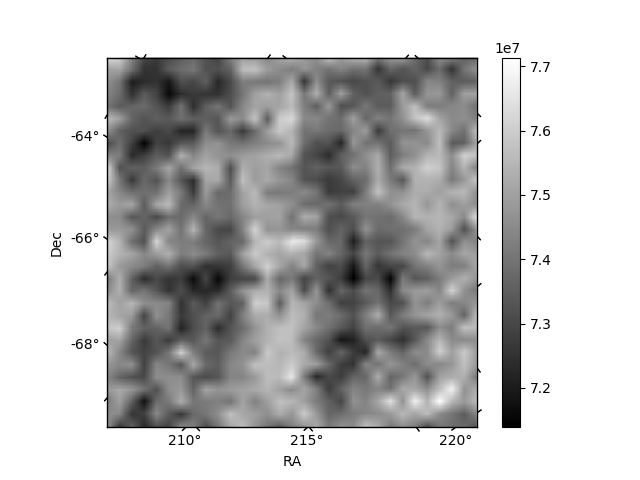
Histogram calculated using DETX and DETY for each event in the final _common_clean file
| Quadrant A | 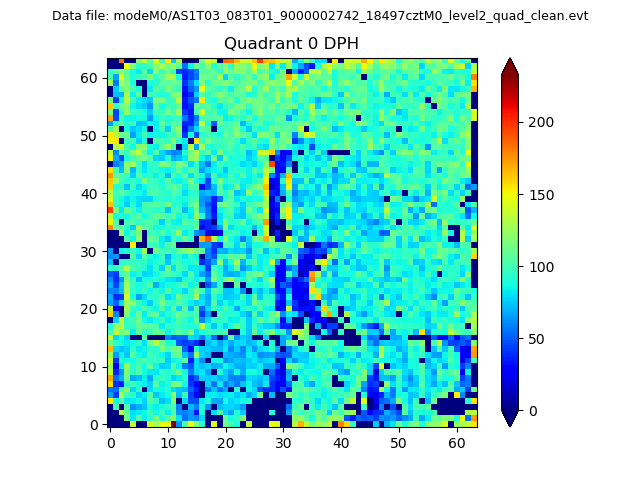 |
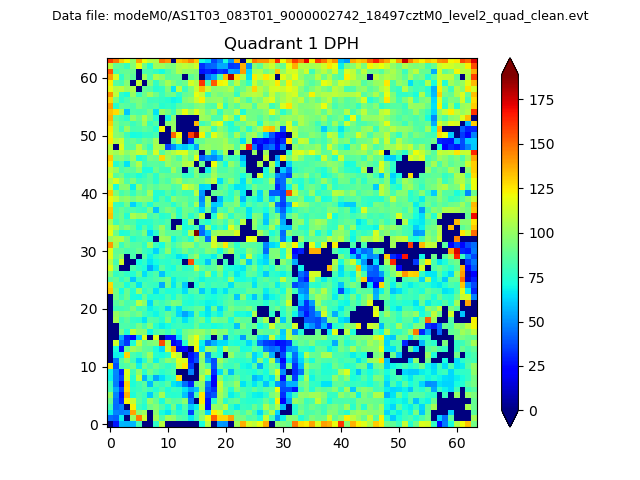 |
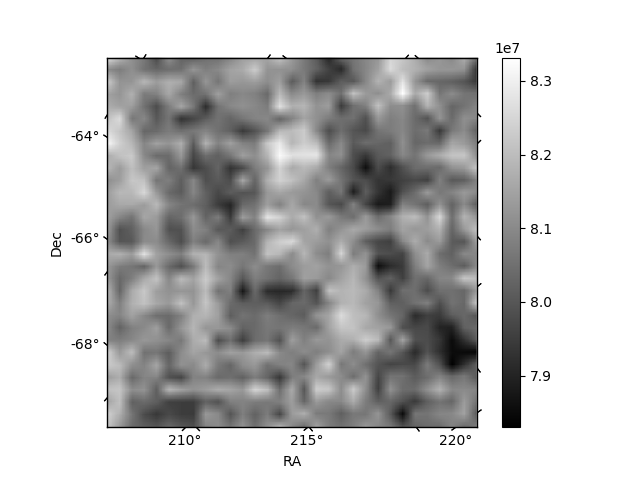
Quadrant B |
|---|---|---|---|
| Quadrant D | 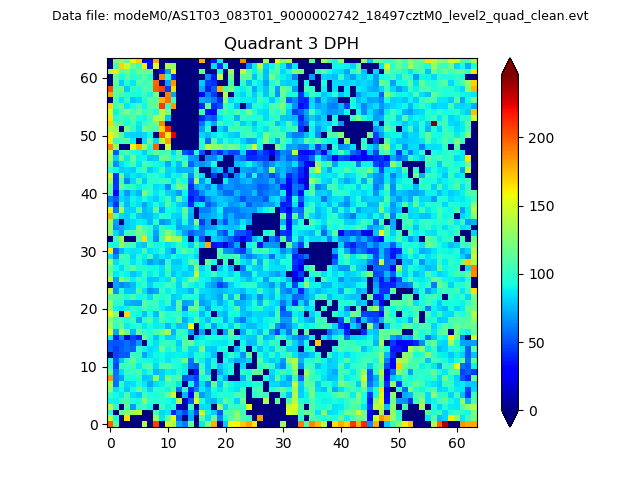 |
 |
Quadrant C |
| Plot type | Count rate plots | Images |
|---|---|---|
| Comparison with Poisson distribution Blue bars denote a histogram of data divided into 1 sec bins. Red curve is a Poisson curve with rate = median count rate of data. |
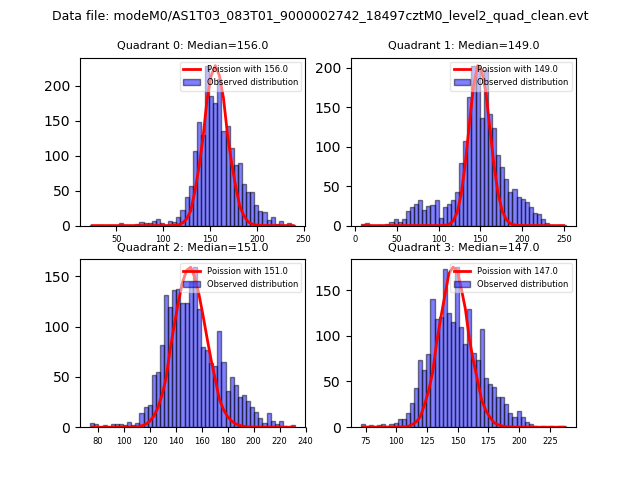 |
 |
| Quadrant-wise count rates Data is divided into 100 sec bins |
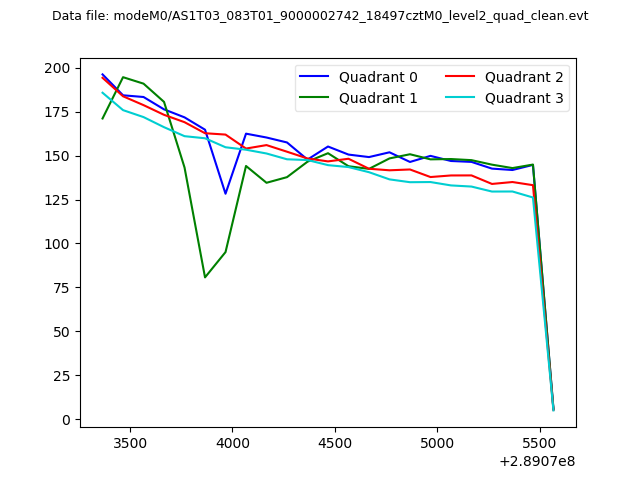 |
|
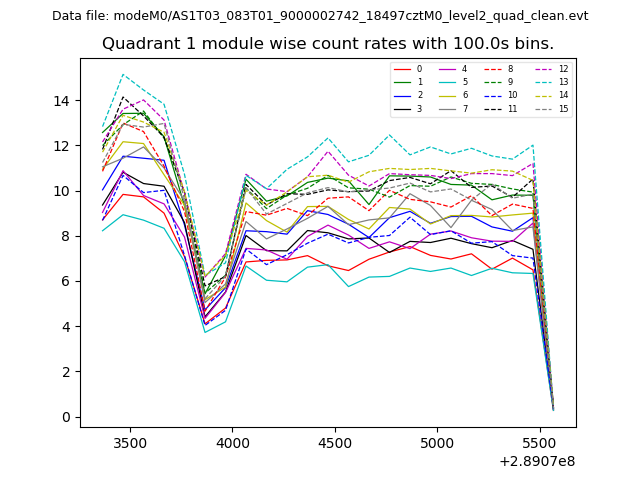
| Module-wise count rates for Quadrant A Data is divided into 100 sec bins |
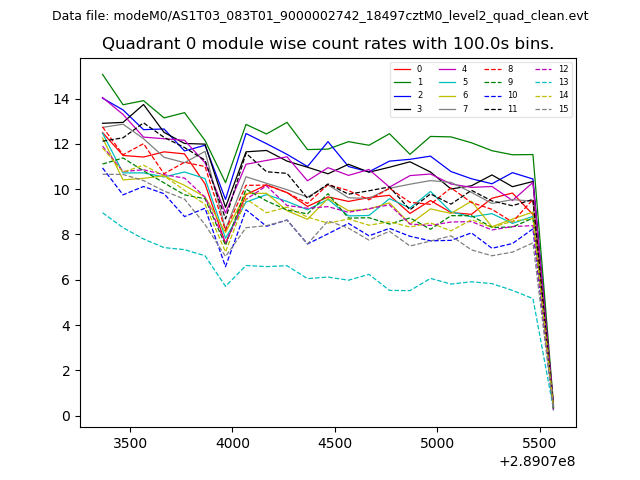 |
 |
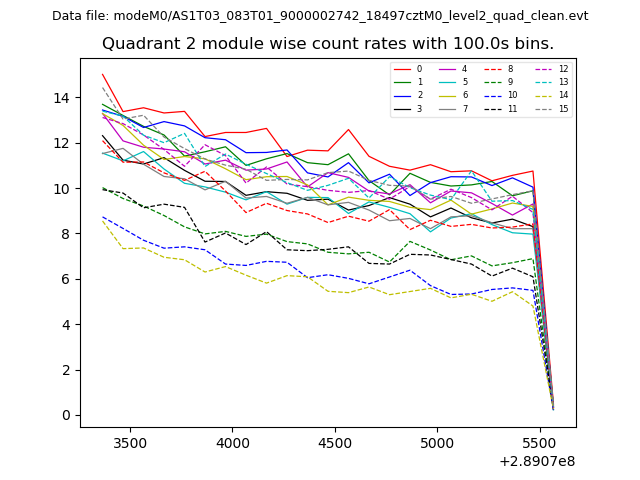
| Module-wise count rates for Quadrant B Data is divided into 100 sec bins |
 |
 |
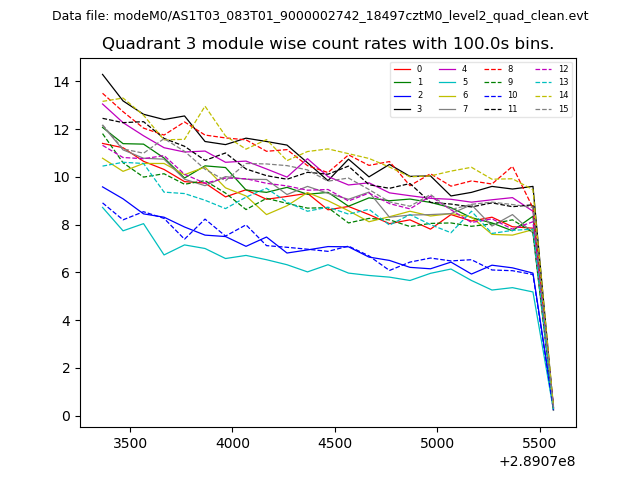
| Module-wise count rates for Quadrant C Data is divided into 100 sec bins |
 |
 |
| Module-wise count rates for Quadrant D Data is divided into 100 sec bins |
 |
 |
| Parameter | Plot |
|---|---|
| CZT HV Monitor | 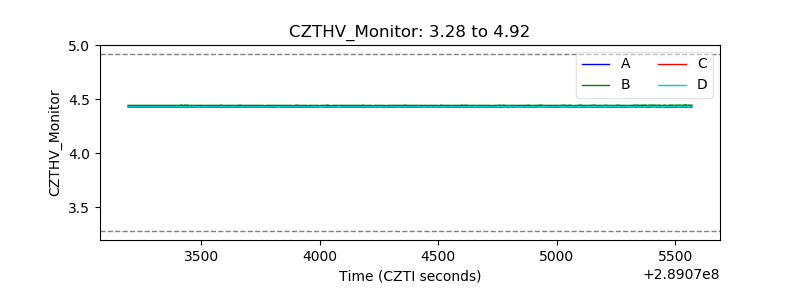 |
| D_VDD | 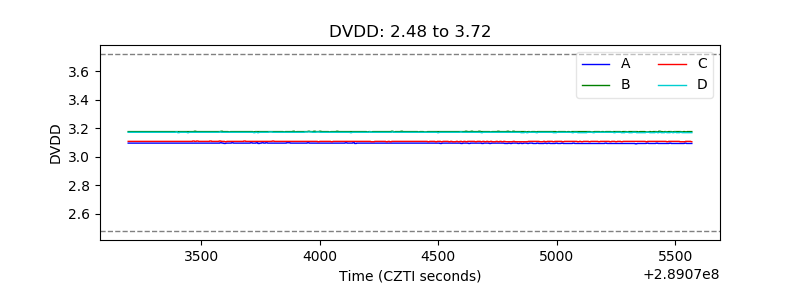 |
| Temperature 1 | 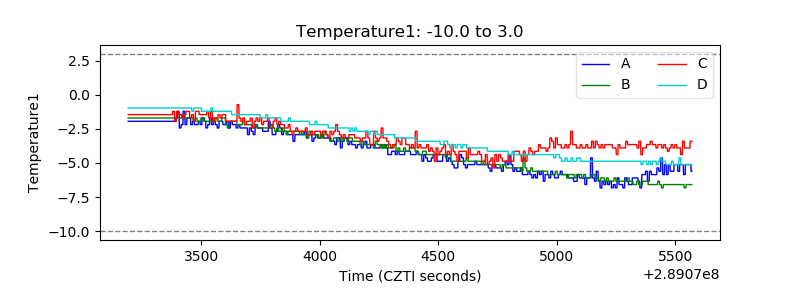 |
| Veto HV Monitor | 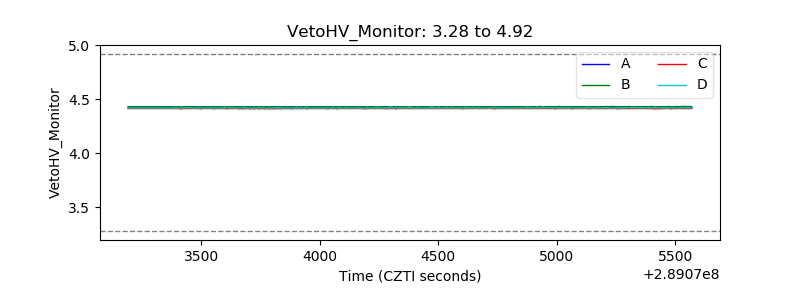 |
| Veto LLD | 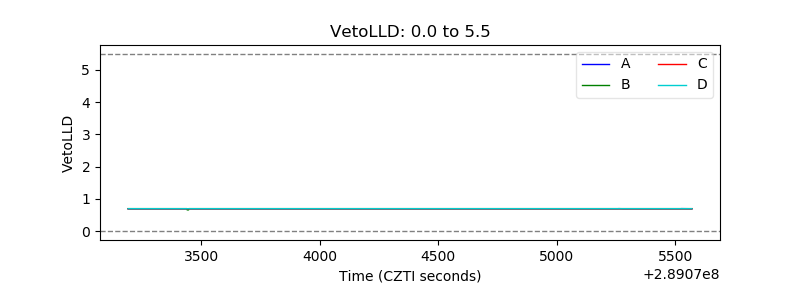 |
| Alpha Counter |  |
| _CPM_Rate | 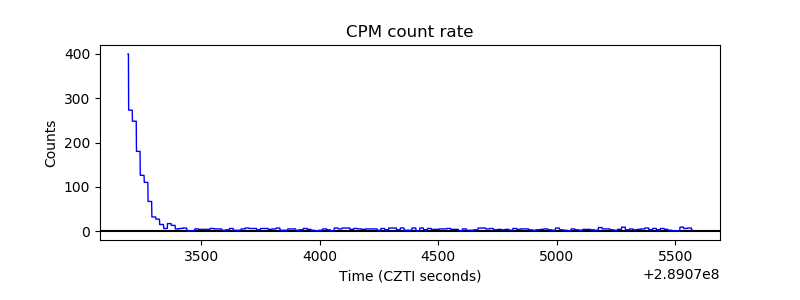 |
| CZT Counter | 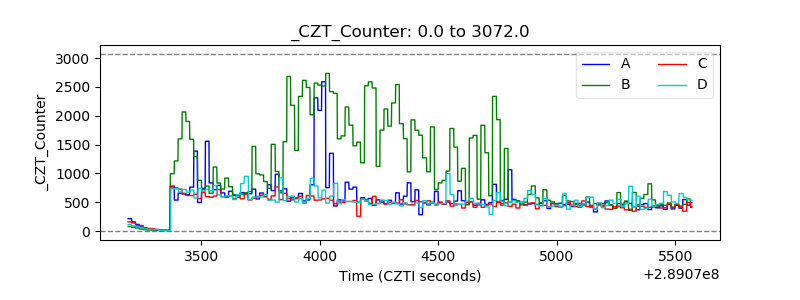 |
| +2.5 Volts monitor |  |
| +5 Volts monitor |  |
| _ROLL_ROT | 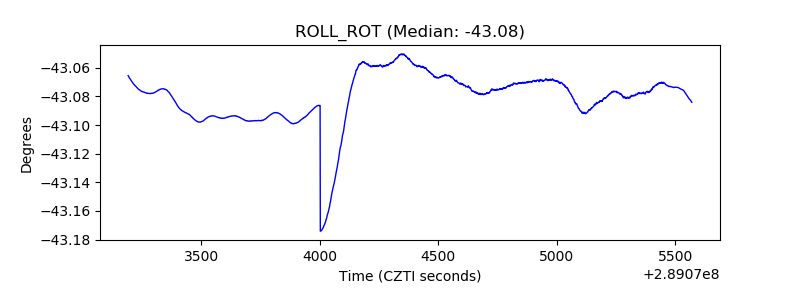 |
| _Roll_DEC | 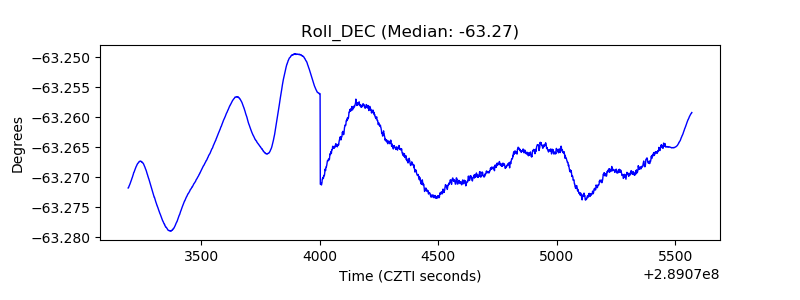 |
| _Roll_RA | 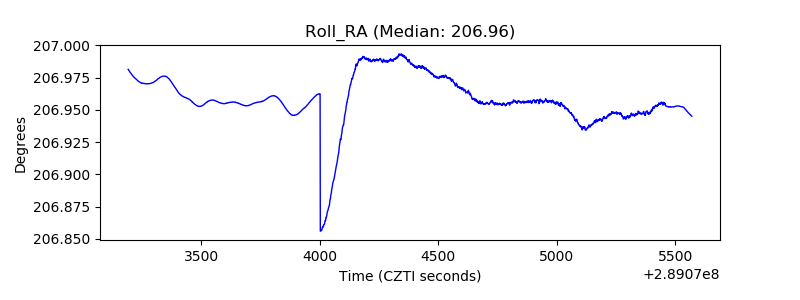 |
| Veto Counter | 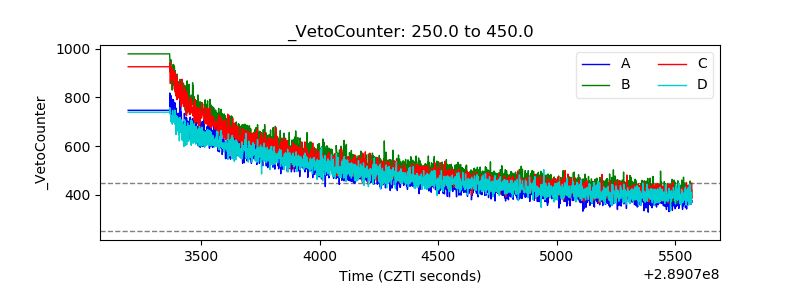 |