| Param | Original file | Final file |
|---|---|---|
| Filename | modeM0/AS1A05_187T03_9000002748cztM0_level2.fits | modeM0/AS1A05_187T03_9000002748cztM0_level2_quad_clean.evt |
| Size (bytes) | 1,087,070,400 | 845,101,440 |
| Size | 1.0 GB | 806.0 MB |
| Events in quadrant A | 6,673,646 | 4,753,935 |
| Events in quadrant B | 6,545,066 | 4,847,354 |
| Events in quadrant C | 6,598,028 | 4,565,524 |
| Events in quadrant D | 5,376,070 | 3,702,276 |
| Mode M0 | |||
|---|---|---|---|
| Quadrant | BADHDUFLAG | Total packets | Discarded packets |
| A | 0 | 264189 | 0 |
| B | 0 | 242340 | 0 |
| C | 0 | 247903 | 0 |
| D | 0 | 373623 | 0 |
| Mode SS | |||
|---|---|---|---|
| Quadrant | BADHDUFLAG | Total packets | Discarded packets |
| A | 0 | 2298 | 0 |
| B | 0 | 2298 | 0 |
| C | 0 | 2298 | 0 |
| D | 0 | 2298 | 0 |
| Mode M9 | |||
|---|---|---|---|
| Quadrant | BADHDUFLAG | Total packets | Discarded packets |
| A | 0 | 185 | 0 |
| B | 0 | 185 | 0 |
| C | 0 | 185 | 0 |
| D | 0 | 185 | 0 |
| Quadrant | Total seconds | Saturated seconds | Saturation percentage |
|---|---|---|---|
| A | 112672 | 4502 | 3.995669% |
| B | 112672 | 1921 | 1.704949% |
| C | 112672 | 2010 | 1.783939% |
| D | 112672 | 14089 | 12.504438% |
Noise dominated data is calculated using 1-second bins in cleaned event files. If a bin has >2000 counts, and if more than 50% of those come from <1% of pixels, then it is considered to be noise-dominated and hence unusable.
| Quadrant | # 1 sec bins | Bins with >0 counts | Bins with >2000 counts | High rate bins dominated by noise | Noise dominated (total time) | Noise dominated (detector-on time) | Marked lightcurve |
|---|---|---|---|---|---|---|---|
| A | 131192 | 112629 | 0 | 0 | 0.00% | 0.00% |  |
| B | 131192 | 112649 | 0 | 0 | 0.00% | 0.00% | 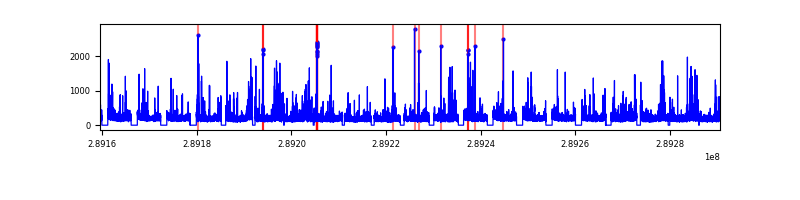 |
| C | 131192 | 112657 | 0 | 0 | 0.00% | 0.00% |  |
| D | 131192 | 111658 | 0 | 0 | 0.00% | 0.00% | 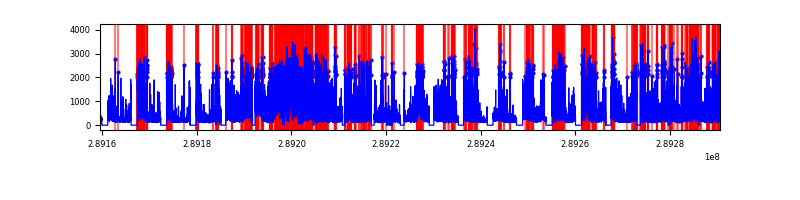 |
Top three noisy pixels from each quadrant. If the there are fewer than three noisy pixels in the level2.evt file, extra rows are filled as -1
| Pixel properties | Quadrant properties | ||||||
|---|---|---|---|---|---|---|---|
| Quadrant | DetID | PixID | Counts | Sigma | Mean | Median | Sigma |
| A | 0 | 29 | 5624 | 9.28 | 1742 | 1632 | 430.3 |
| A | 7 | 110 | 5407 | 8.77 | 1742 | 1632 | 430.3 |
| A | 9 | 19 | 5035 | 7.91 | 1742 | 1632 | 430.3 |
| B | 2 | 9 | 5234 | 10.68 | 1728 | 1649 | 335.7 |
| B | 2 | 8 | 4423 | 8.26 | 1728 | 1649 | 335.7 |
| B | 3 | 17 | 4325 | 7.97 | 1728 | 1649 | 335.7 |
| C | 1 | 81 | 4950 | 7.39 | 1741 | 1620 | 450.4 |
| C | 1 | 80 | 4903 | 7.29 | 1741 | 1620 | 450.4 |
| C | 12 | 241 | 4666 | 6.76 | 1741 | 1620 | 450.4 |
| D | 10 | 190 | 4014 | 6.4 | 1535 | 1395 | 409.2 |
| D | 3 | 14 | 3844 | 5.99 | 1535 | 1395 | 409.2 |
| D | 6 | 67 | 3710 | 5.66 | 1535 | 1395 | 409.2 |
Histogram calculated using DETX and DETY for each event in the final _common_clean file
| Quadrant A | 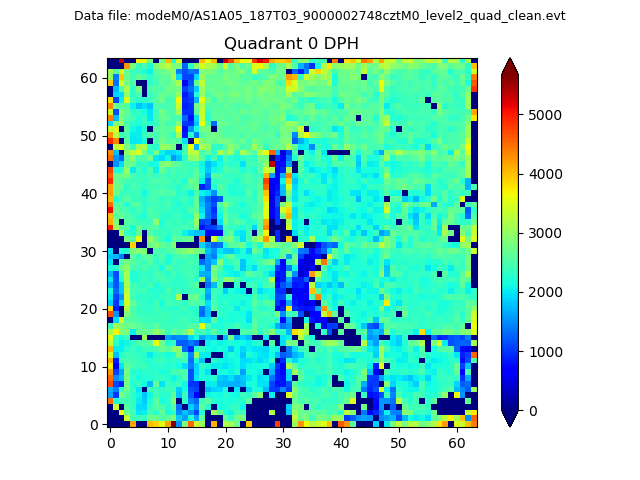 |
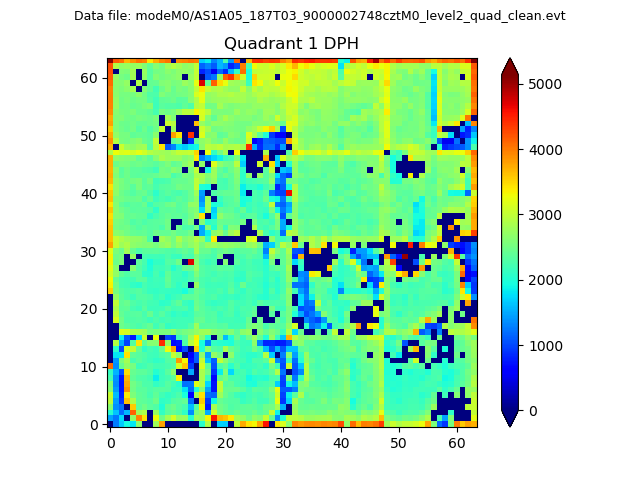 |
Quadrant B |
|---|---|---|---|
| Quadrant D |  |
 |
Quadrant C |
| Plot type | Count rate plots | Images |
|---|---|---|
| Comparison with Poisson distribution Blue bars denote a histogram of data divided into 1 sec bins. Red curve is a Poisson curve with rate = median count rate of data. |
 |
 |
| Quadrant-wise count rates Data is divided into 100 sec bins |
 |
|
| Module-wise count rates for Quadrant A Data is divided into 100 sec bins |
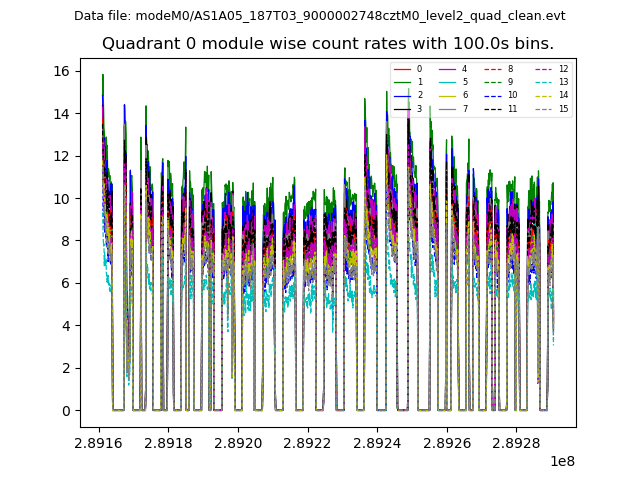 |
 |
| Module-wise count rates for Quadrant B Data is divided into 100 sec bins |
 |
 |
| Module-wise count rates for Quadrant C Data is divided into 100 sec bins |
 |
 |
| Module-wise count rates for Quadrant D Data is divided into 100 sec bins |
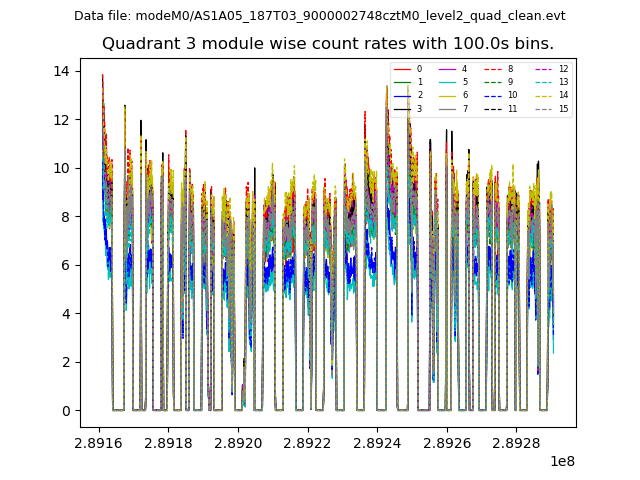 |
 |
| Parameter | Plot |
|---|---|
| CZT HV Monitor |  |
| D_VDD | 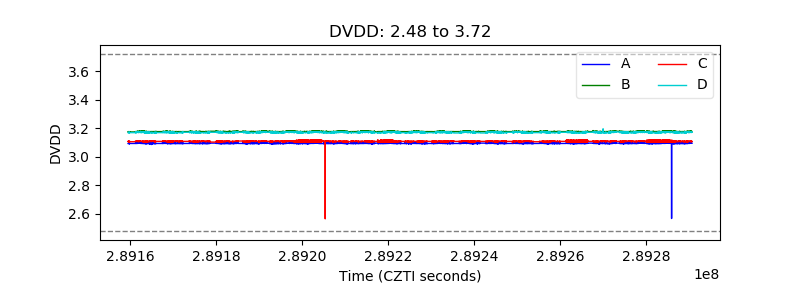 |
| Temperature 1 |  |
| Veto HV Monitor |  |
| Veto LLD |  |
| Alpha Counter |  |
| _CPM_Rate |  |
| CZT Counter |  |
| +2.5 Volts monitor |  |
| +5 Volts monitor | 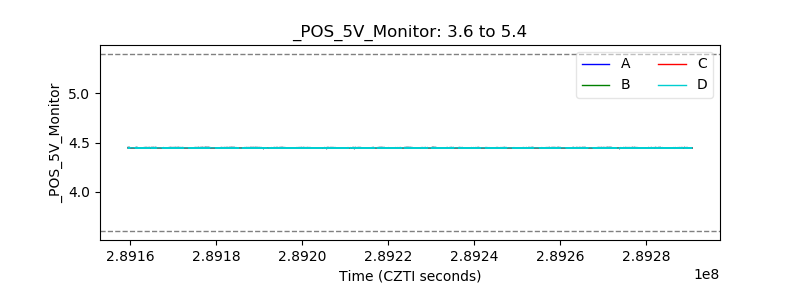 |
| _ROLL_ROT |  |
| _Roll_DEC |  |
| _Roll_RA | 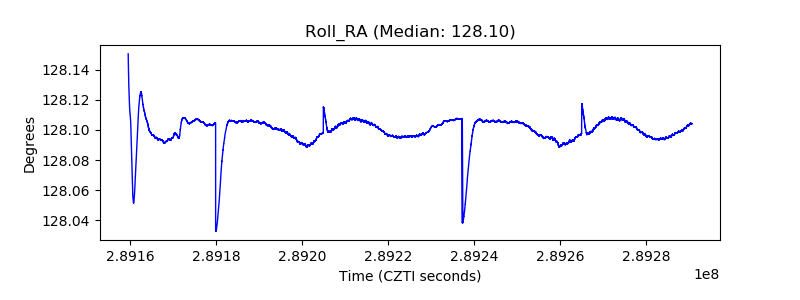 |
| Veto Counter | 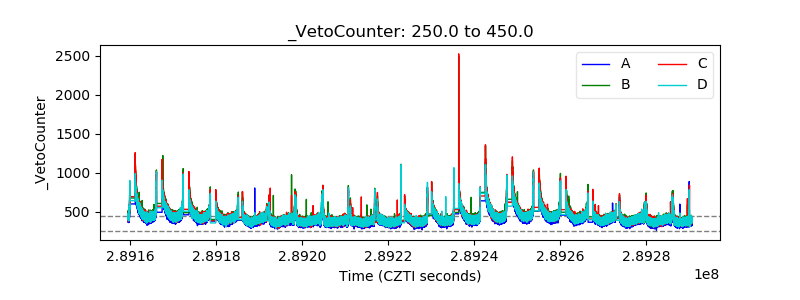 |