| Param | Original file | Final file |
|---|---|---|
| Filename | modeM0/AS1A05_187T03_9000002748_18511cztM0_level2.evt | modeM0/AS1A05_187T03_9000002748_18511cztM0_level2_quad_clean.evt |
| Size (bytes) | 149,204,160 | 35,303,040 |
| Size | 142.3 MB | 33.7 MB |
| Events in quadrant A | 1,102,687 | 240,841 |
| Events in quadrant B | 1,082,361 | 245,281 |
| Events in quadrant C | 1,047,386 | 228,420 |
| Events in quadrant D | 1,161,533 | 222,533 |
| Mode M0 | |||
|---|---|---|---|
| Quadrant | BADHDUFLAG | Total packets | Discarded packets |
| A | 0 | 4439 | 1 |
| B | 0 | 4332 | 1 |
| C | 0 | 4234 | 1 |
| D | 0 | 4728 | 1 |
| Mode SS | |||
|---|---|---|---|
| Quadrant | BADHDUFLAG | Total packets | Discarded packets |
| A | 0 | 38 | 0 |
| B | 0 | 38 | 0 |
| C | 0 | 38 | 0 |
| D | 0 | 38 | 0 |
| Mode M9 | |||
|---|---|---|---|
| Quadrant | BADHDUFLAG | Total packets | Discarded packets |
| A | 0 | 13 | 0 |
| B | 0 | 13 | 0 |
| C | 0 | 13 | 0 |
| D | 0 | 13 | 0 |
| Quadrant | Total seconds | Saturated seconds | Saturation percentage |
|---|---|---|---|
| A | 1800 | 60 | 3.333333% |
| B | 1799 | 63 | 3.501946% |
| C | 1799 | 56 | 3.112840% |
| D | 1799 | 50 | 2.779322% |
Noise dominated data is calculated using 1-second bins in cleaned event files. If a bin has >2000 counts, and if more than 50% of those come from <1% of pixels, then it is considered to be noise-dominated and hence unusable.
| Quadrant | # 1 sec bins | Bins with >0 counts | Bins with >2000 counts | High rate bins dominated by noise | Noise dominated (total time) | Noise dominated (detector-on time) | Marked lightcurve |
|---|---|---|---|---|---|---|---|
| A | 3060 | 1800 | 7 | 7 | 0.23% | 0.39% | 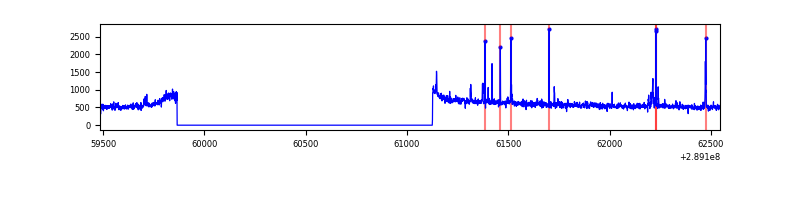 |
| B | 3059 | 1799 | 4 | 4 | 0.13% | 0.22% | 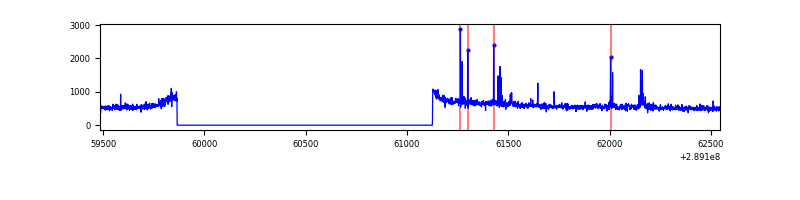 |
| C | 3059 | 1799 | 0 | 0 | 0.00% | 0.00% | 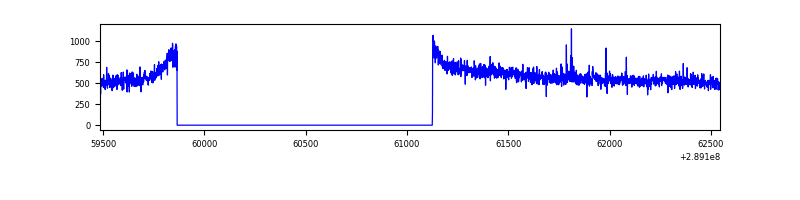 |
| D | 3059 | 1799 | 9 | 9 | 0.29% | 0.50% | 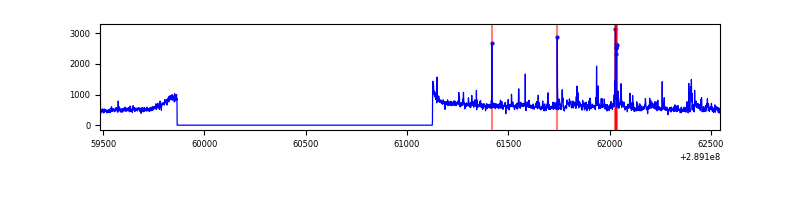 |
Top three noisy pixels from each quadrant. If the there are fewer than three noisy pixels in the level2.evt file, extra rows are filled as -1
| Pixel properties | Quadrant properties | ||||||
|---|---|---|---|---|---|---|---|
| Quadrant | DetID | PixID | Counts | Sigma | Mean | Median | Sigma |
| A | 0 | 13 | 33809 | 600.59 | 270 | 264 | 55.9 |
| A | 14 | 238 | 12729 | 223.17 | 270 | 264 | 55.9 |
| A | 11 | 47 | 11927 | 208.82 | 270 | 264 | 55.9 |
| B | 7 | 220 | 17275 | 329.5 | 267 | 261 | 51.6 |
| B | 6 | 36 | 15283 | 290.92 | 267 | 261 | 51.6 |
| B | 12 | 111 | 5578 | 102.97 | 267 | 261 | 51.6 |
| C | 14 | 238 | 39996 | 660.45 | 255 | 256 | 60.2 |
| C | 3 | 233 | 4463 | 69.92 | 255 | 256 | 60.2 |
| C | 5 | 112 | 4231 | 66.06 | 255 | 256 | 60.2 |
| D | 13 | 168 | 65782 | 1017.34 | 262 | 254 | 64.4 |
| D | 1 | 52 | 44069 | 680.24 | 262 | 254 | 64.4 |
| D | 7 | 238 | 39074 | 602.69 | 262 | 254 | 64.4 |
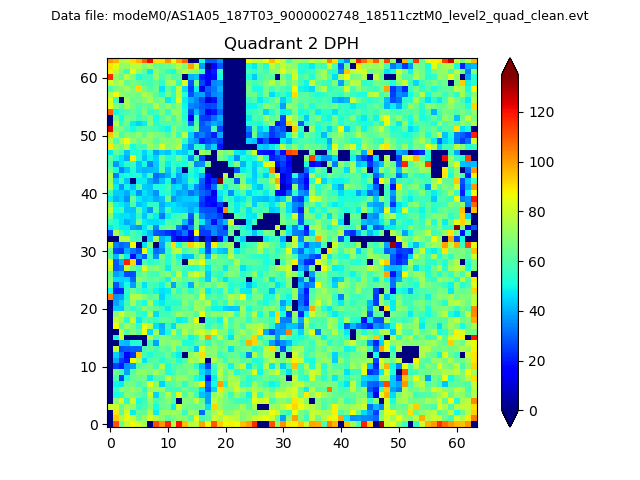
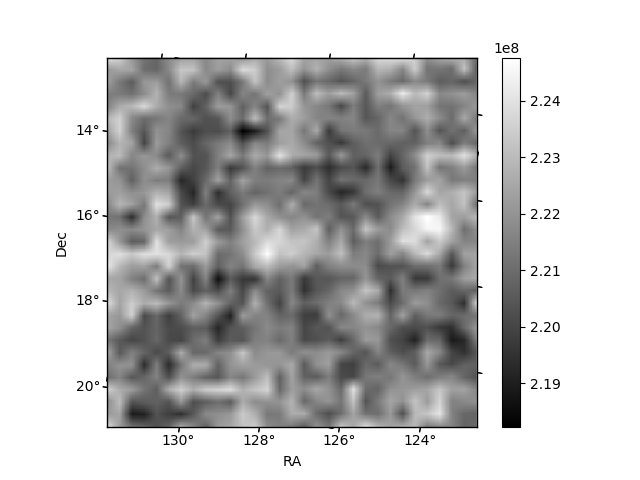
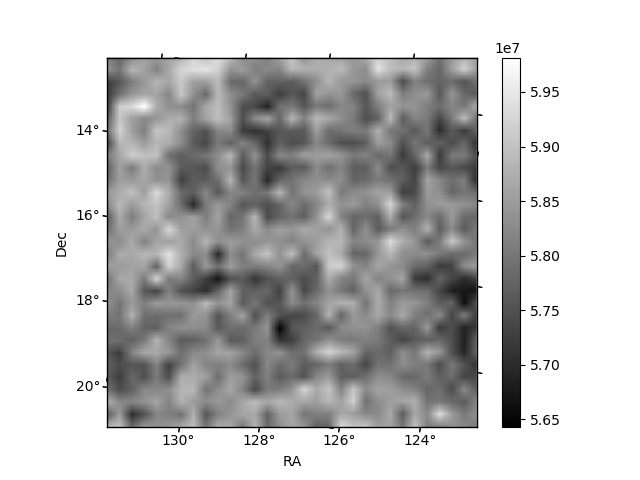
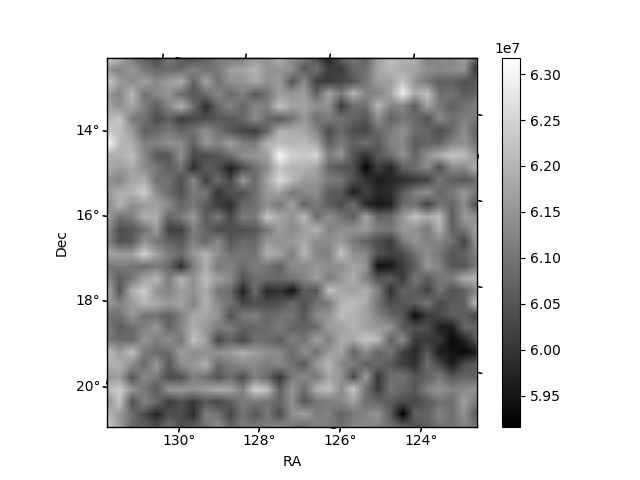
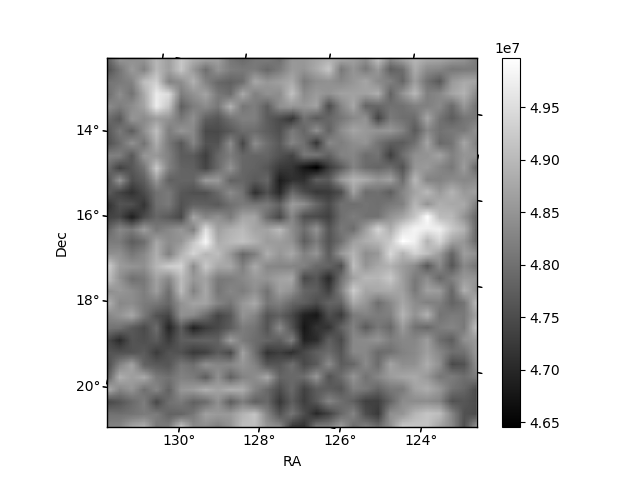
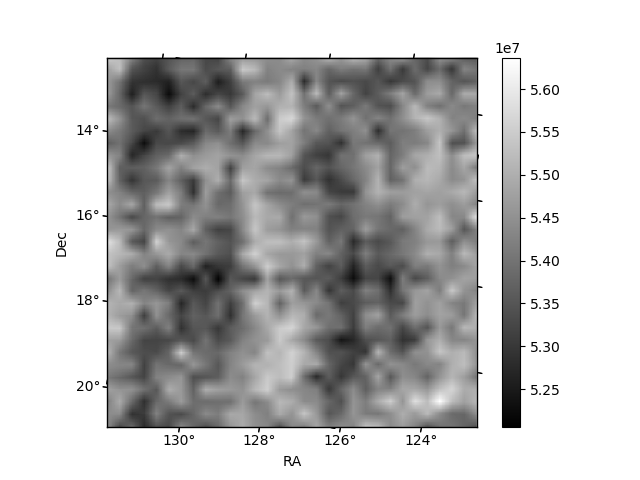
Histogram calculated using DETX and DETY for each event in the final _common_clean file
| Quadrant A | 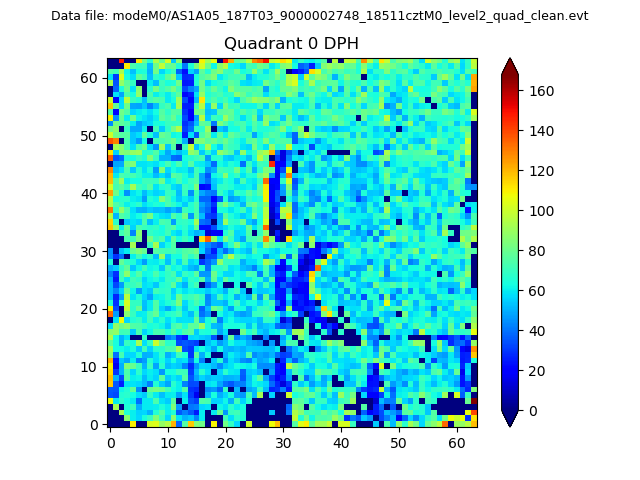 |
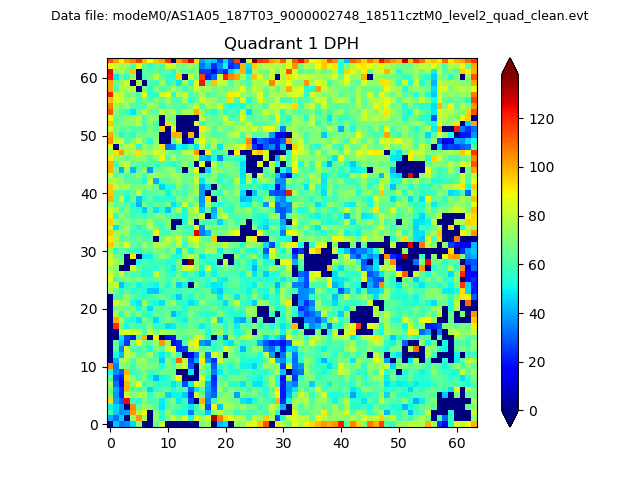 |
Quadrant B |
|---|---|---|---|
| Quadrant D | 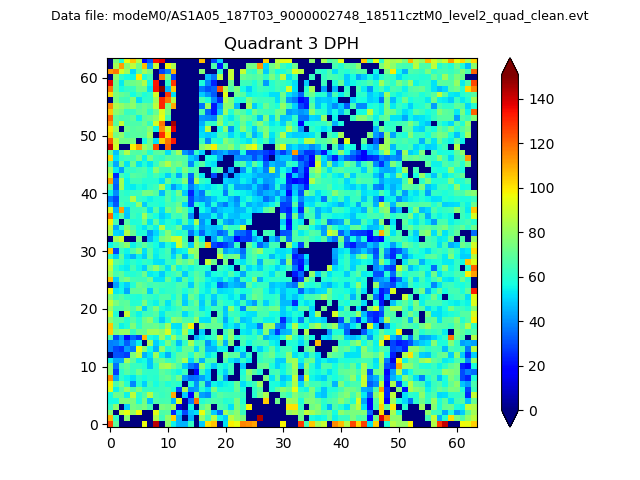 |
 |
Quadrant C |
| Plot type | Count rate plots | Images |
|---|---|---|
| Comparison with Poisson distribution Blue bars denote a histogram of data divided into 1 sec bins. Red curve is a Poisson curve with rate = median count rate of data. |
 |
 |
| Quadrant-wise count rates Data is divided into 100 sec bins |
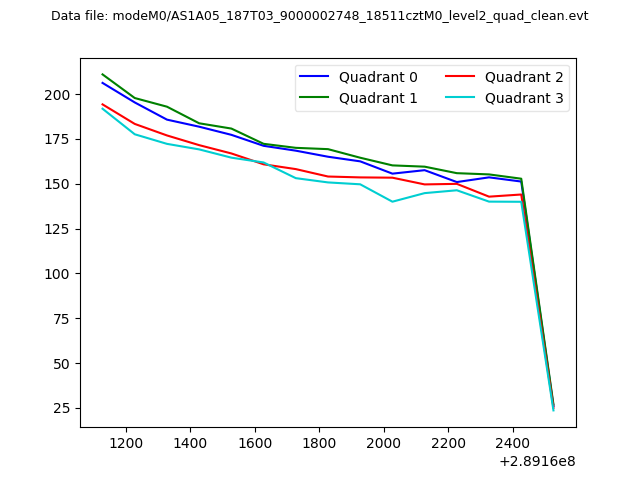 |
|
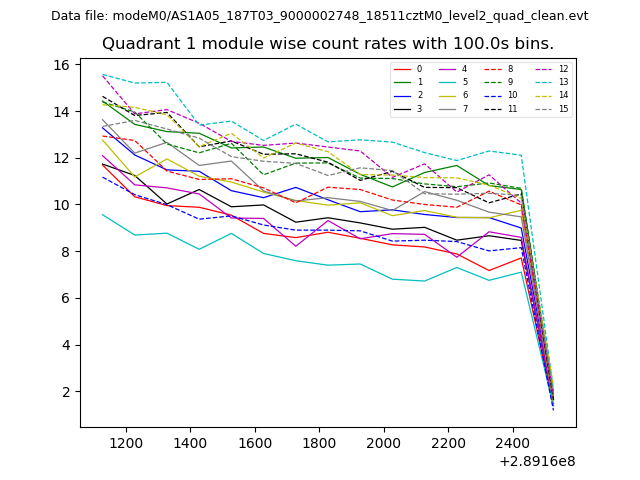
| Module-wise count rates for Quadrant A Data is divided into 100 sec bins |
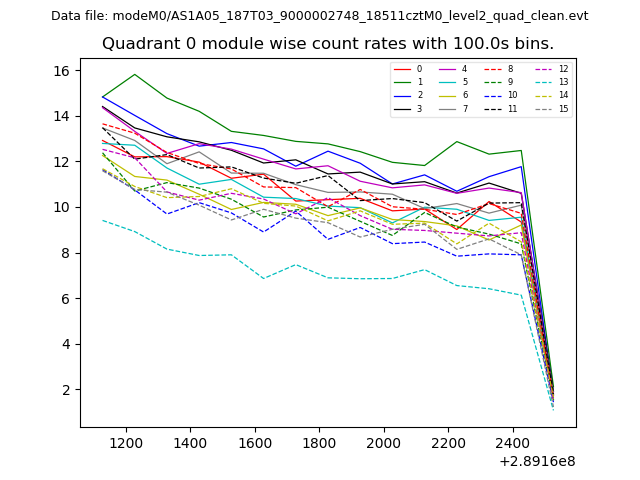 |
 |
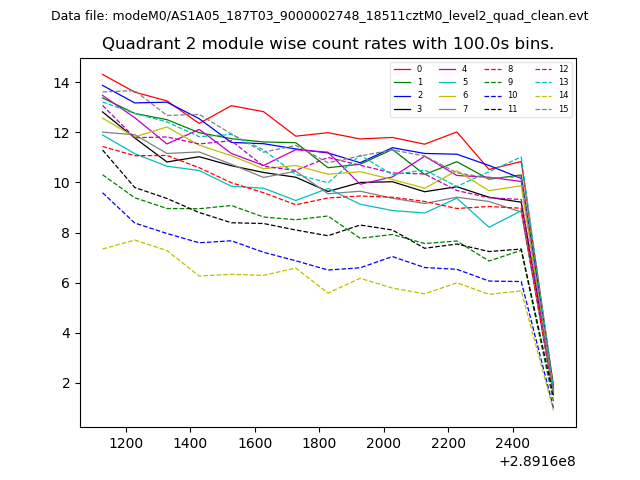
| Module-wise count rates for Quadrant B Data is divided into 100 sec bins |
 |
 |
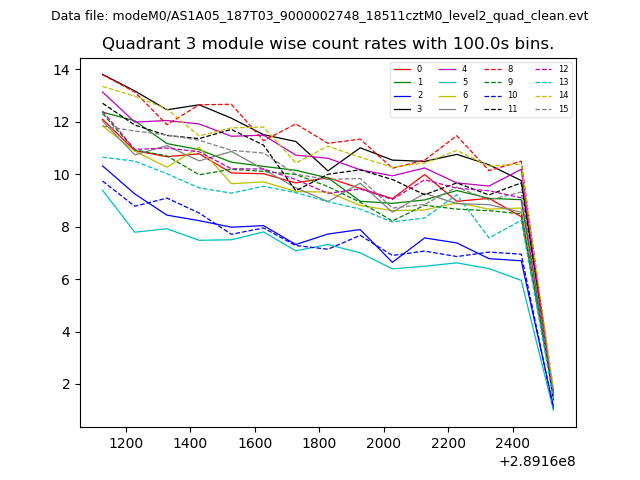
| Module-wise count rates for Quadrant C Data is divided into 100 sec bins |
 |
 |
| Module-wise count rates for Quadrant D Data is divided into 100 sec bins |
 |
 |
| Parameter | Plot |
|---|---|
| CZT HV Monitor | 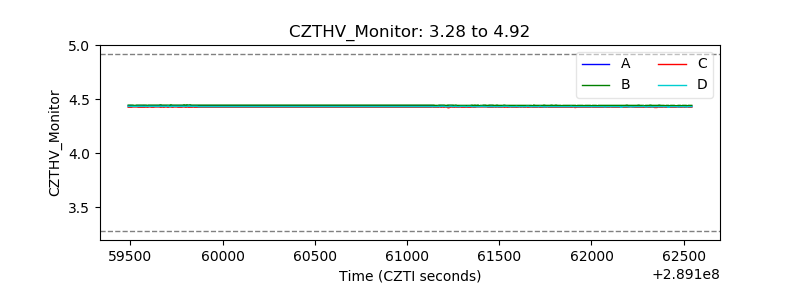 |
| D_VDD | 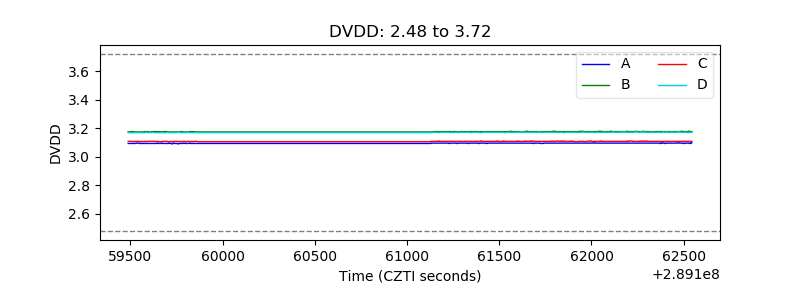 |
| Temperature 1 | 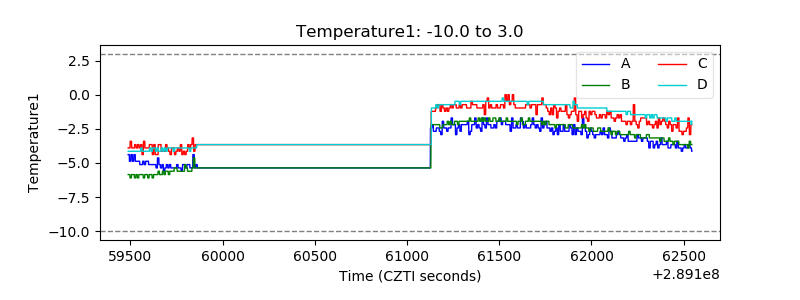 |
| Veto HV Monitor | 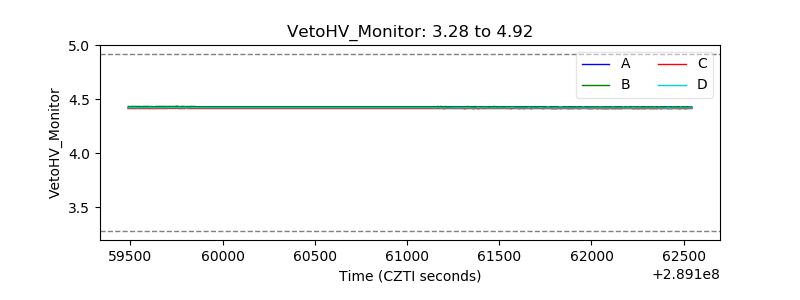 |
| Veto LLD | 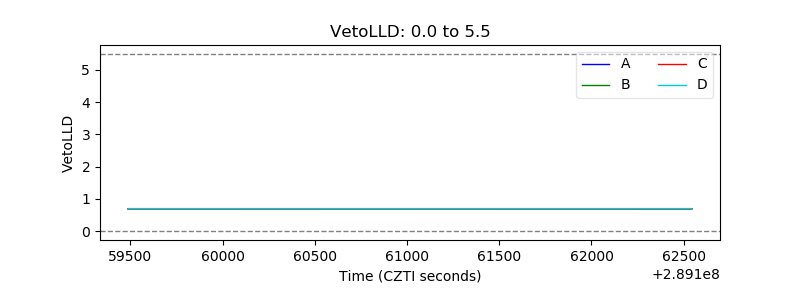 |
| Alpha Counter | 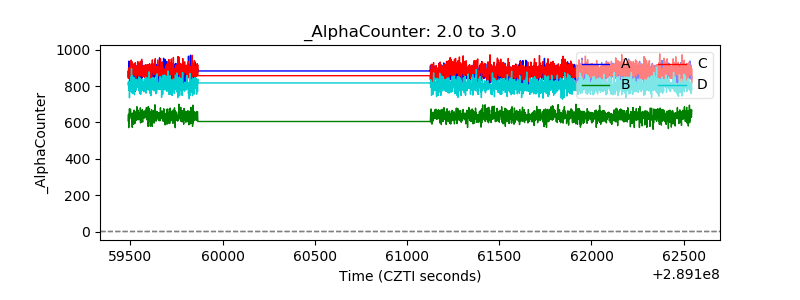 |
| _CPM_Rate | 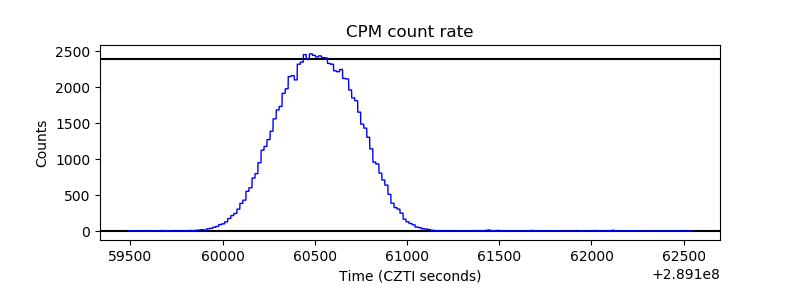 |
| CZT Counter | 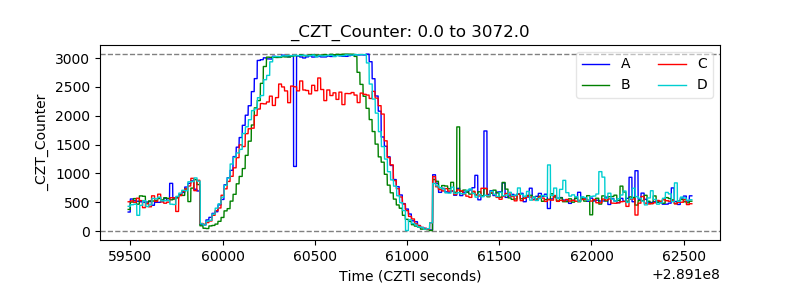 |
| +2.5 Volts monitor |  |
| +5 Volts monitor | 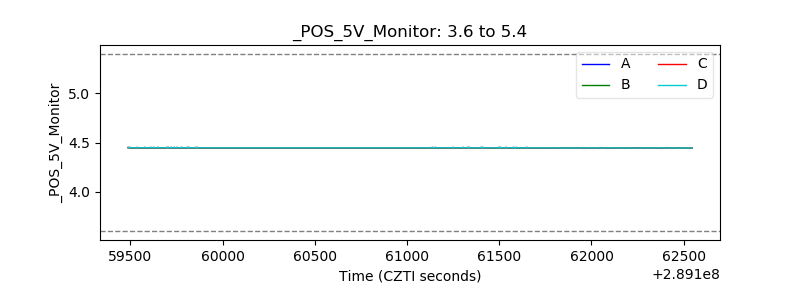 |
| _ROLL_ROT | 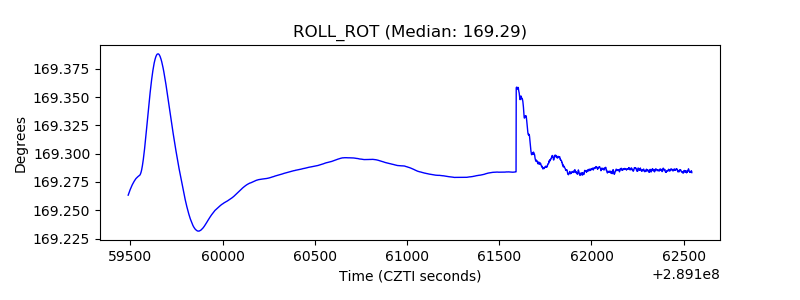 |
| _Roll_DEC | 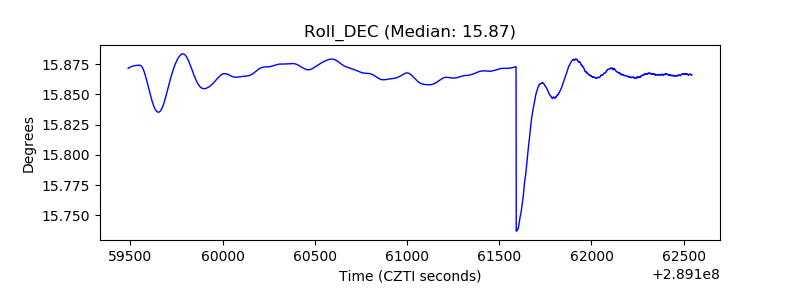 |
| _Roll_RA | 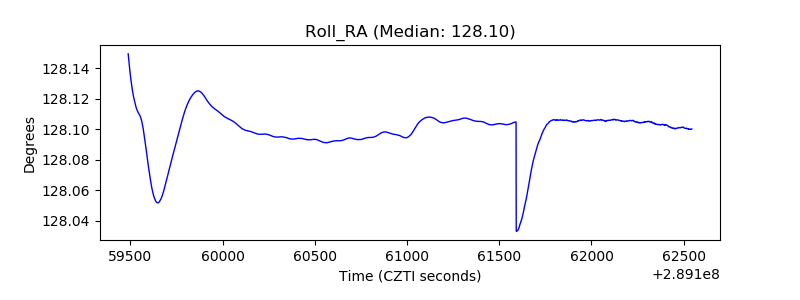 |
| Veto Counter | 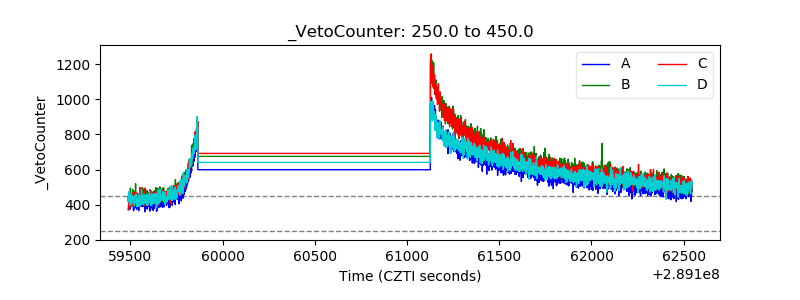 |