| Param | Original file | Final file |
|---|---|---|
| Filename | modeM0/AS1A05_187T03_9000002748_18512cztM0_level2.evt | modeM0/AS1A05_187T03_9000002748_18512cztM0_level2_quad_clean.evt |
| Size (bytes) | 566,343,360 | 96,932,160 |
| Size | 540.1 MB | 92.4 MB |
| Events in quadrant A | 4,794,916 | 593,631 |
| Events in quadrant B | 3,415,710 | 683,551 |
| Events in quadrant C | 3,341,105 | 636,931 |
| Events in quadrant D | 5,173,350 | 581,437 |
| Mode M0 | |||
|---|---|---|---|
| Quadrant | BADHDUFLAG | Total packets | Discarded packets |
| A | 0 | 18349 | 2 |
| B | 0 | 14056 | 2 |
| C | 0 | 13922 | 2 |
| D | 0 | 19747 | 2 |
| Mode SS | |||
|---|---|---|---|
| Quadrant | BADHDUFLAG | Total packets | Discarded packets |
| A | 0 | 128 | 0 |
| B | 0 | 128 | 0 |
| C | 0 | 128 | 0 |
| D | 0 | 128 | 0 |
| Mode M9 | |||
|---|---|---|---|
| Quadrant | BADHDUFLAG | Total packets | Discarded packets |
| A | 0 | 13 | 0 |
| B | 0 | 14 | 0 |
| C | 0 | 14 | 0 |
| D | 0 | 14 | 0 |
| Quadrant | Total seconds | Saturated seconds | Saturation percentage |
|---|---|---|---|
| A | 6294 | 786 | 12.488084% |
| B | 6294 | 112 | 1.779473% |
| C | 6293 | 112 | 1.779755% |
| D | 6293 | 795 | 12.633084% |
Noise dominated data is calculated using 1-second bins in cleaned event files. If a bin has >2000 counts, and if more than 50% of those come from <1% of pixels, then it is considered to be noise-dominated and hence unusable.
| Quadrant | # 1 sec bins | Bins with >0 counts | Bins with >2000 counts | High rate bins dominated by noise | Noise dominated (total time) | Noise dominated (detector-on time) | Marked lightcurve |
|---|---|---|---|---|---|---|---|
| A | 7613 | 6293 | 685 | 685 | 9.00% | 10.89% | 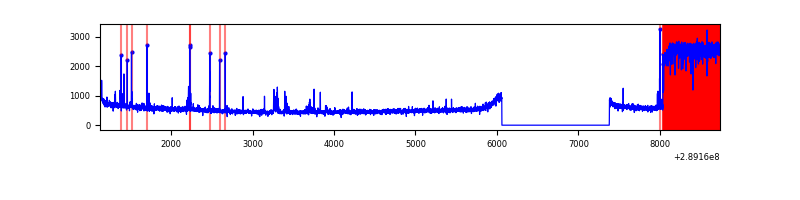 |
| B | 7614 | 6294 | 11 | 11 | 0.14% | 0.17% | 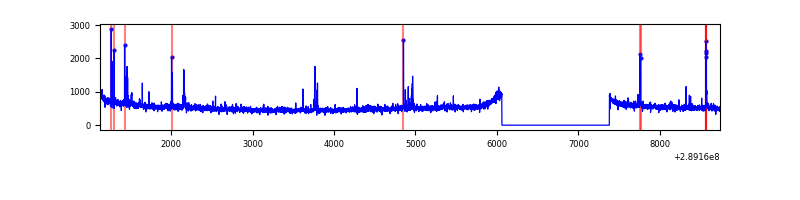 |
| C | 7613 | 6293 | 0 | 0 | 0.00% | 0.00% | 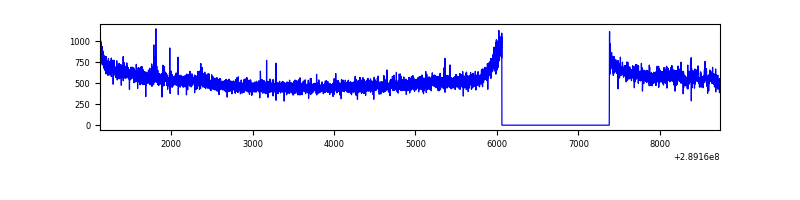 |
| D | 7613 | 6293 | 706 | 706 | 9.27% | 11.22% | 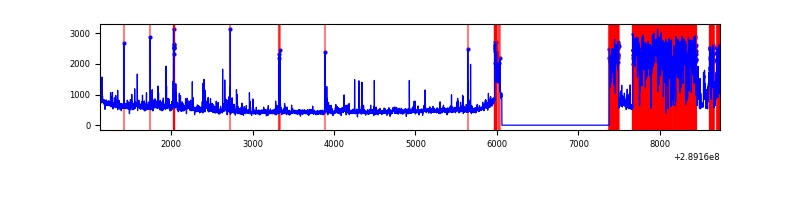 |
Top three noisy pixels from each quadrant. If the there are fewer than three noisy pixels in the level2.evt file, extra rows are filled as -1
| Pixel properties | Quadrant properties | ||||||
|---|---|---|---|---|---|---|---|
| Quadrant | DetID | PixID | Counts | Sigma | Mean | Median | Sigma |
| A | 0 | 13 | 1703545 | 10709.66 | 791 | 776 | 159.0 |
| A | 14 | 238 | 18003 | 108.35 | 791 | 776 | 159.0 |
| A | 11 | 47 | 12704 | 75.02 | 791 | 776 | 159.0 |
| B | 15 | 222 | 26388 | 161.91 | 846 | 827 | 157.9 |
| B | 7 | 220 | 18521 | 112.08 | 846 | 827 | 157.9 |
| B | 12 | 111 | 17745 | 107.16 | 846 | 827 | 157.9 |
| C | 14 | 238 | 127686 | 680.09 | 807 | 813 | 186.6 |
| C | 3 | 233 | 59097 | 312.43 | 807 | 813 | 186.6 |
| C | 13 | 61 | 5839 | 26.94 | 807 | 813 | 186.6 |
| D | 14 | 34 | 1627902 | 8471.25 | 787 | 765 | 192.1 |
| D | 13 | 168 | 199759 | 1036.01 | 787 | 765 | 192.1 |
| D | 7 | 238 | 159969 | 828.85 | 787 | 765 | 192.1 |
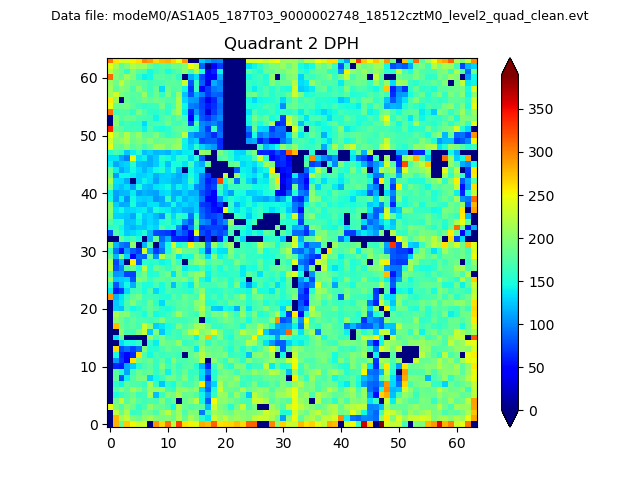
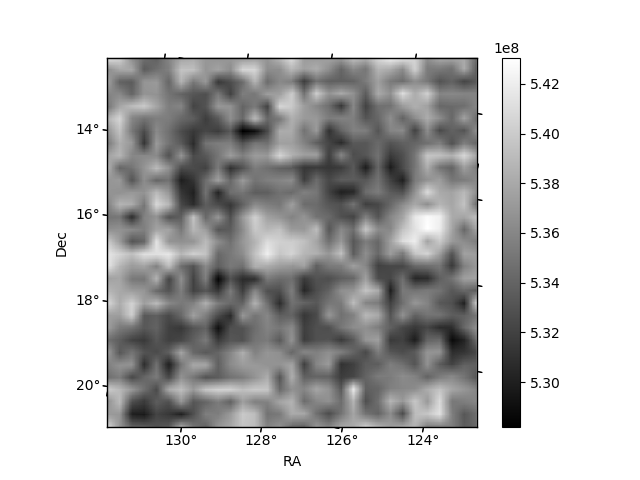
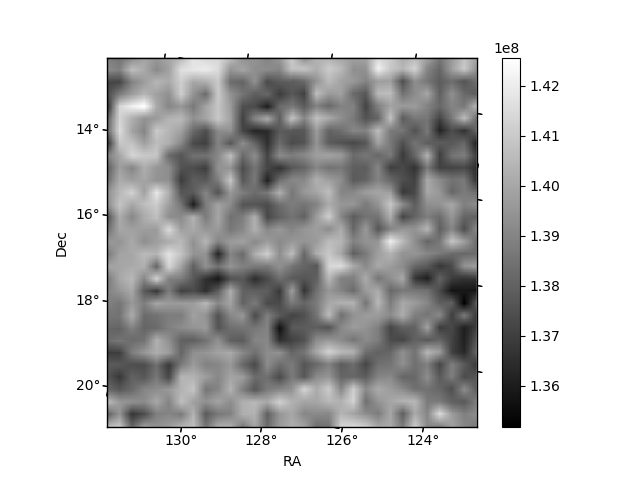
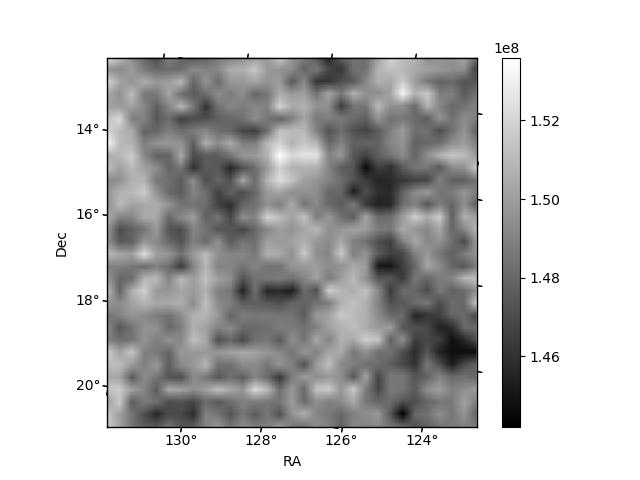
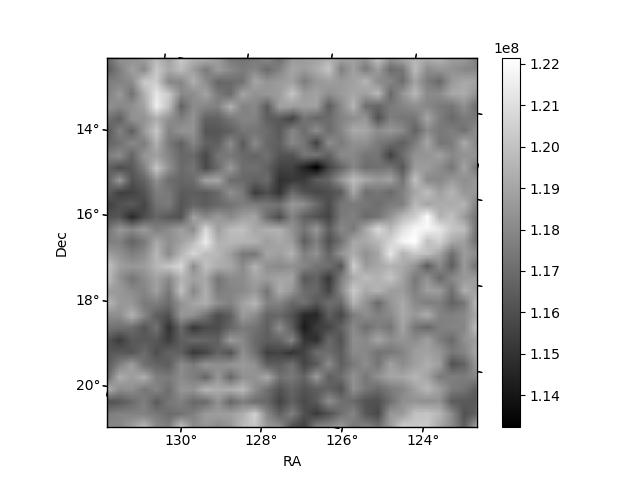
Histogram calculated using DETX and DETY for each event in the final _common_clean file
| Quadrant A | 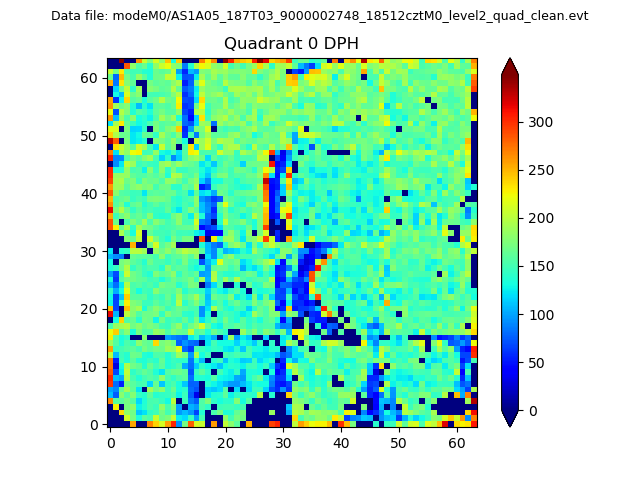 |
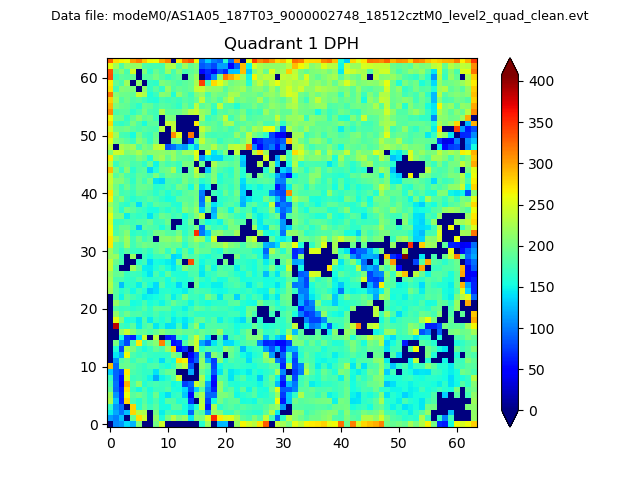 |
Quadrant B |
|---|---|---|---|
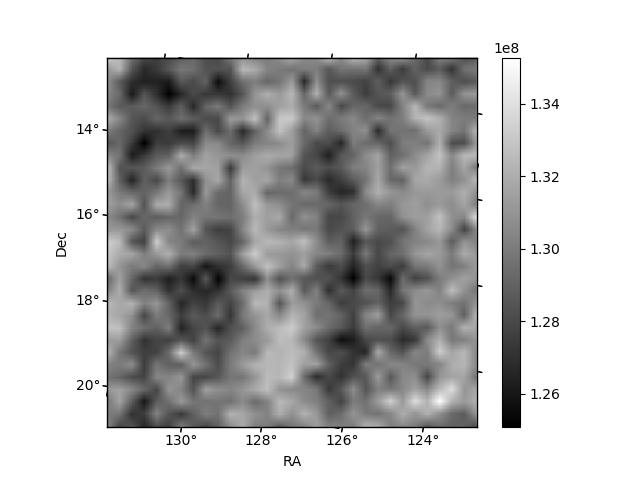
| Quadrant D | 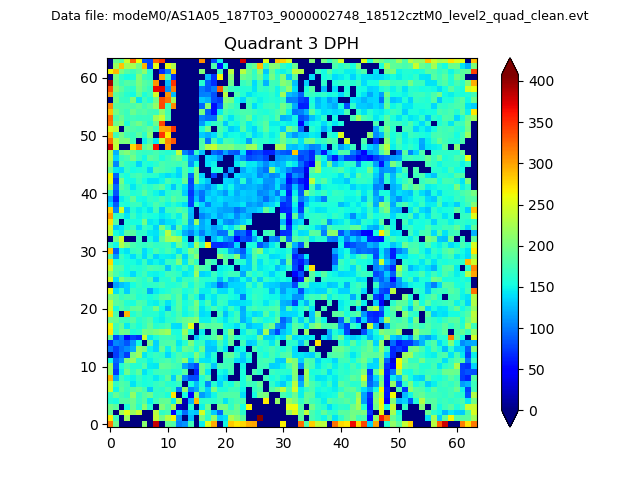 |
 |
Quadrant C |
| Plot type | Count rate plots | Images |
|---|---|---|
| Comparison with Poisson distribution Blue bars denote a histogram of data divided into 1 sec bins. Red curve is a Poisson curve with rate = median count rate of data. |
 |
 |
| Quadrant-wise count rates Data is divided into 100 sec bins |
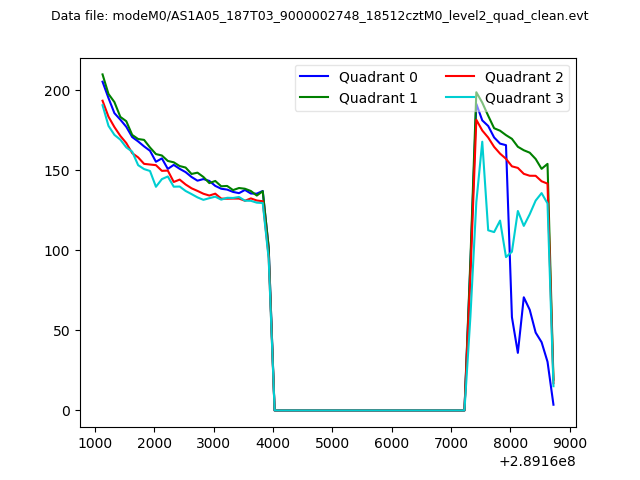 |
|
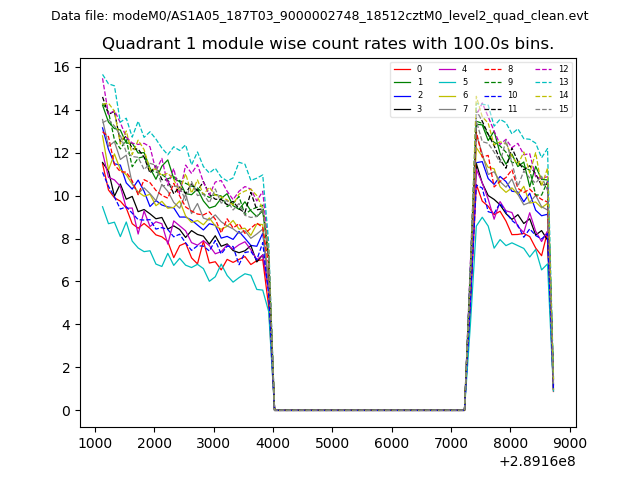
| Module-wise count rates for Quadrant A Data is divided into 100 sec bins |
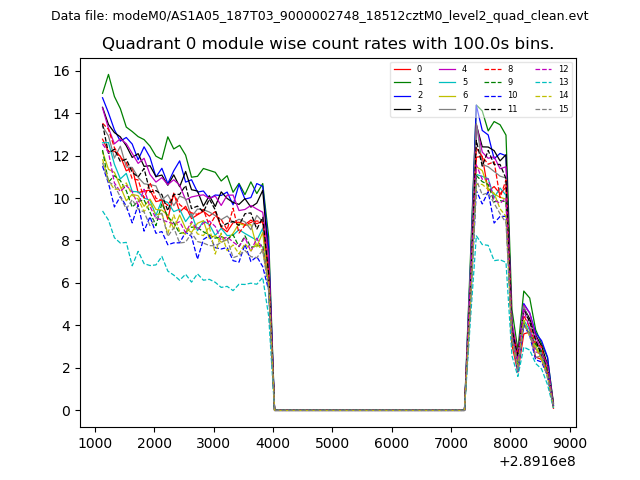 |
 |
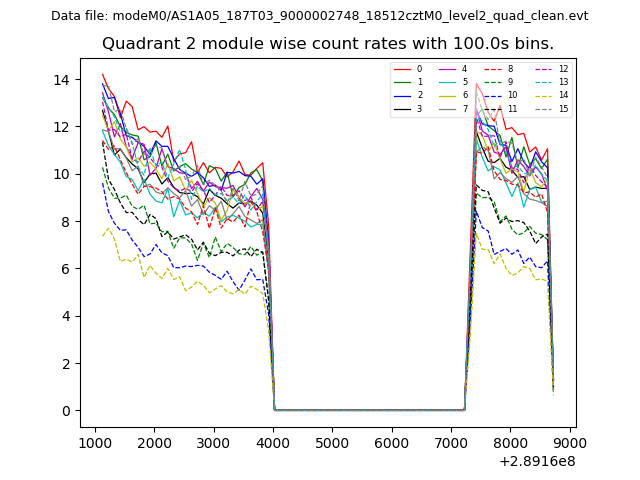
| Module-wise count rates for Quadrant B Data is divided into 100 sec bins |
 |
 |
| Module-wise count rates for Quadrant C Data is divided into 100 sec bins |
 |
 |
| Module-wise count rates for Quadrant D Data is divided into 100 sec bins |
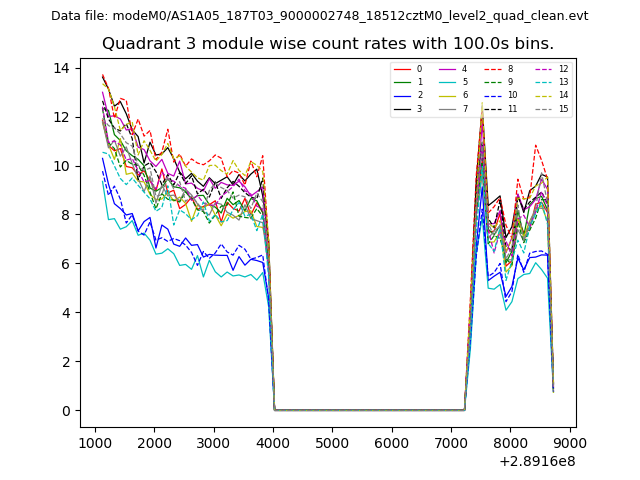 |
 |
| Parameter | Plot |
|---|---|
| CZT HV Monitor | 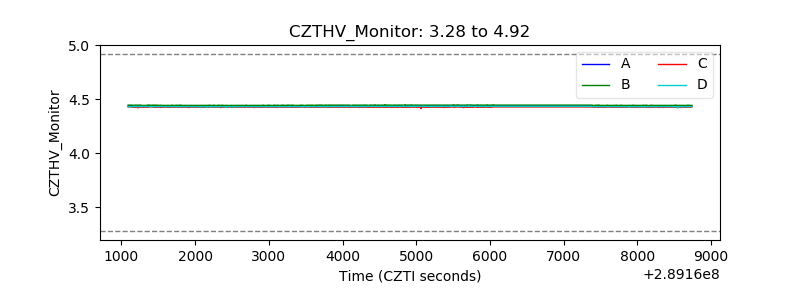 |
| D_VDD | 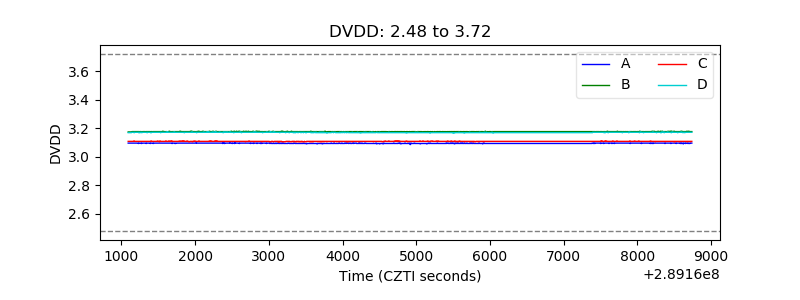 |
| Temperature 1 | 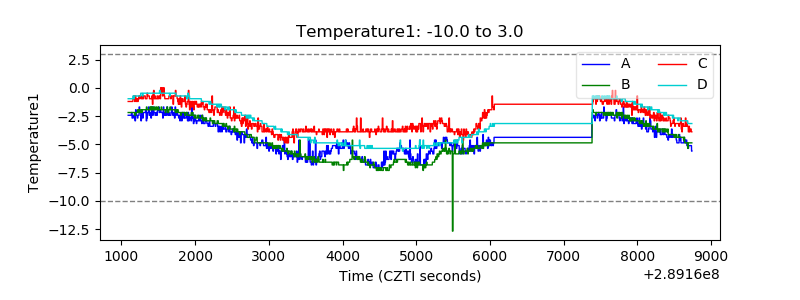 |
| Veto HV Monitor | 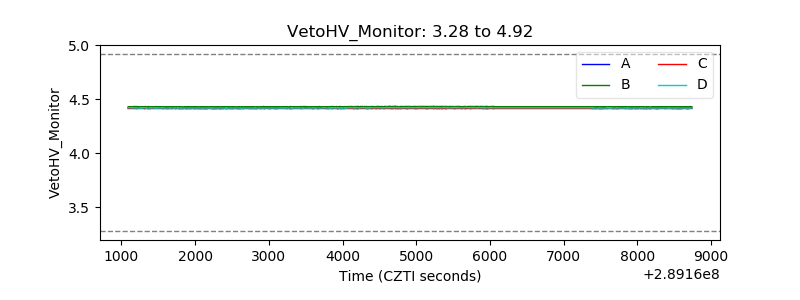 |
| Veto LLD | 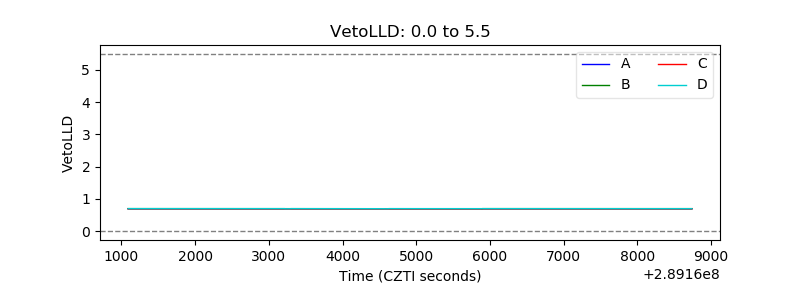 |
| Alpha Counter | 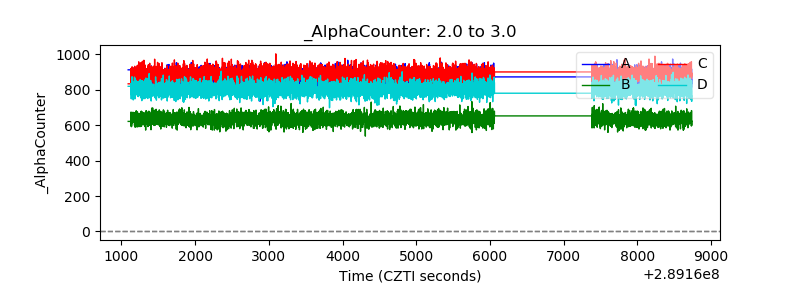 |
| _CPM_Rate | 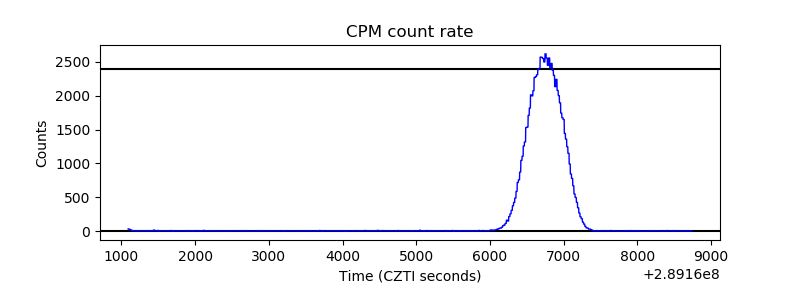 |
| CZT Counter | 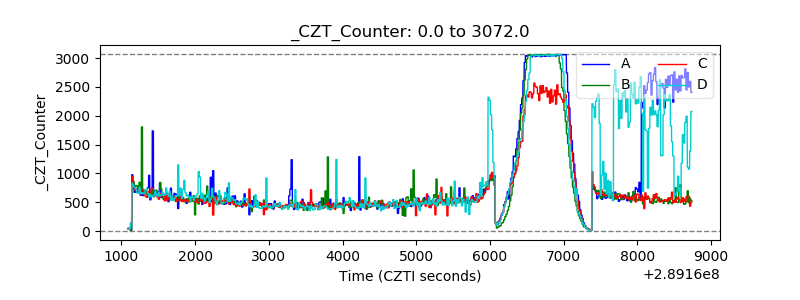 |
| +2.5 Volts monitor |  |
| +5 Volts monitor |  |
| _ROLL_ROT | 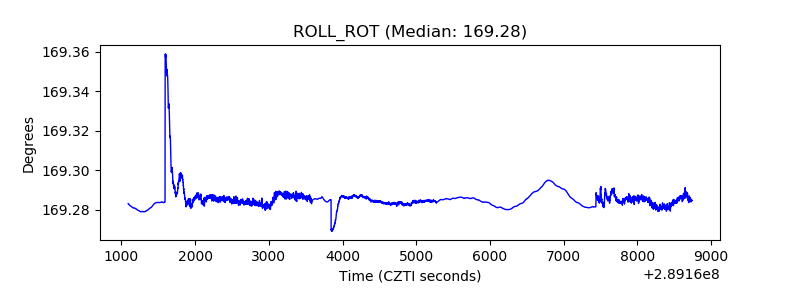 |
| _Roll_DEC | 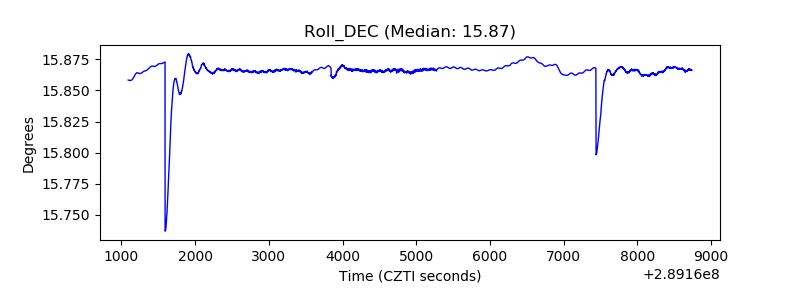 |
| _Roll_RA | 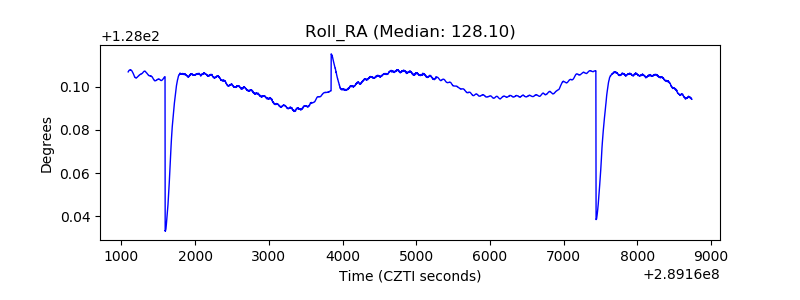 |
| Veto Counter | 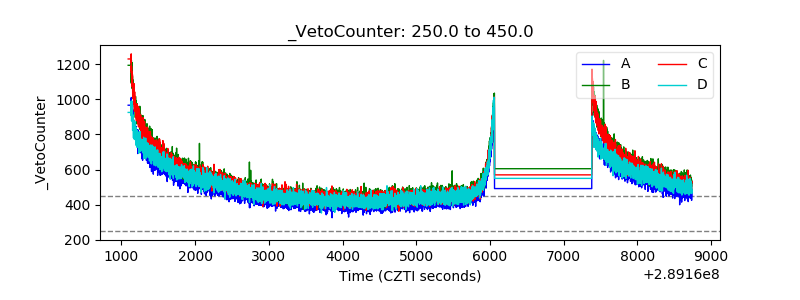 |