| Param | Original file | Final file |
|---|---|---|
| Filename | modeM0/AS1A05_187T03_9000002748_18513cztM0_level2.evt | modeM0/AS1A05_187T03_9000002748_18513cztM0_level2_quad_clean.evt |
| Size (bytes) | 627,379,200 | 86,016,960 |
| Size | 598.3 MB | 82.0 MB |
| Events in quadrant A | 5,715,680 | 485,506 |
| Events in quadrant B | 3,267,468 | 617,314 |
| Events in quadrant C | 3,382,421 | 573,576 |
| Events in quadrant D | 6,217,641 | 497,767 |
| Mode M0 | |||
|---|---|---|---|
| Quadrant | BADHDUFLAG | Total packets | Discarded packets |
| A | 0 | 21004 | 2 |
| B | 0 | 13477 | 2 |
| C | 0 | 13794 | 2 |
| D | 0 | 22619 | 2 |
| Mode SS | |||
|---|---|---|---|
| Quadrant | BADHDUFLAG | Total packets | Discarded packets |
| A | 0 | 126 | 0 |
| B | 0 | 126 | 0 |
| C | 0 | 126 | 0 |
| D | 0 | 126 | 0 |
| Mode M9 | |||
|---|---|---|---|
| Quadrant | BADHDUFLAG | Total packets | Discarded packets |
| A | 0 | 17 | 0 |
| B | 0 | 18 | 0 |
| C | 0 | 18 | 0 |
| D | 0 | 18 | 0 |
| Quadrant | Total seconds | Saturated seconds | Saturation percentage |
|---|---|---|---|
| A | 6150 | 1407 | 22.878049% |
| B | 6150 | 127 | 2.065041% |
| C | 6150 | 134 | 2.178862% |
| D | 6150 | 1067 | 17.349593% |
Noise dominated data is calculated using 1-second bins in cleaned event files. If a bin has >2000 counts, and if more than 50% of those come from <1% of pixels, then it is considered to be noise-dominated and hence unusable.
| Quadrant | # 1 sec bins | Bins with >0 counts | Bins with >2000 counts | High rate bins dominated by noise | Noise dominated (total time) | Noise dominated (detector-on time) | Marked lightcurve |
|---|---|---|---|---|---|---|---|
| A | 7465 | 6150 | 1081 | 1081 | 14.48% | 17.58% | 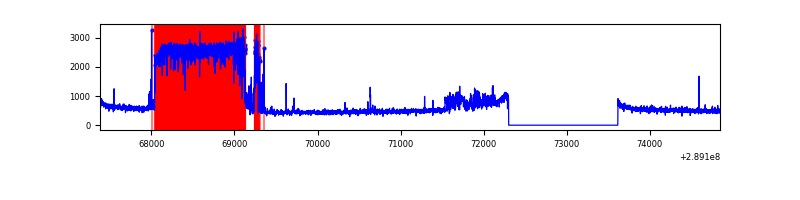 |
| B | 7465 | 6150 | 20 | 20 | 0.27% | 0.33% | 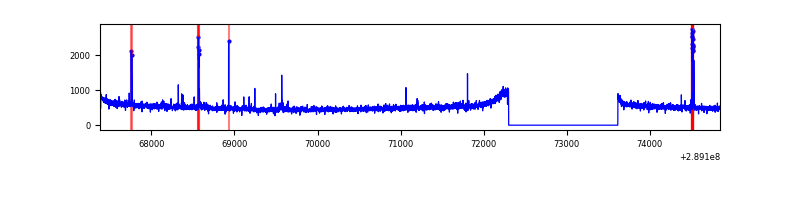 |
| C | 7465 | 6150 | 4 | 4 | 0.05% | 0.07% | 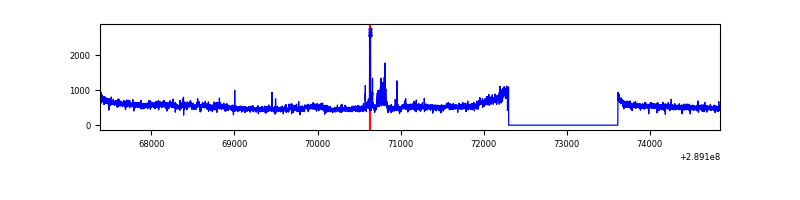 |
| D | 7465 | 6151 | 1017 | 1017 | 13.62% | 16.53% | 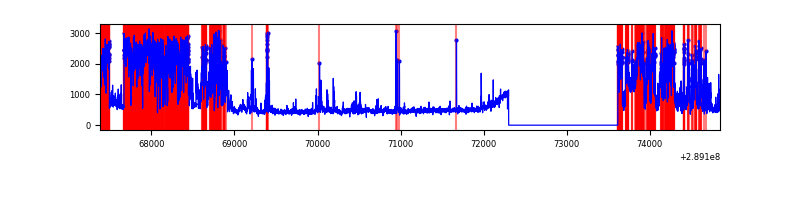 |
Top three noisy pixels from each quadrant. If the there are fewer than three noisy pixels in the level2.evt file, extra rows are filled as -1
| Pixel properties | Quadrant properties | ||||||
|---|---|---|---|---|---|---|---|
| Quadrant | DetID | PixID | Counts | Sigma | Mean | Median | Sigma |
| A | 0 | 13 | 2737880 | 18885.93 | 722 | 708 | 144.9 |
| A | 14 | 111 | 182392 | 1253.58 | 722 | 708 | 144.9 |
| A | 15 | 192 | 10385 | 66.77 | 722 | 708 | 144.9 |
| B | 0 | 182 | 38102 | 243.13 | 815 | 799 | 153.4 |
| B | 12 | 111 | 17469 | 108.65 | 815 | 799 | 153.4 |
| B | 11 | 111 | 15163 | 93.62 | 815 | 799 | 153.4 |
| C | 3 | 233 | 151529 | 832.28 | 778 | 785 | 181.1 |
| C | 14 | 238 | 122905 | 674.24 | 778 | 785 | 181.1 |
| C | 9 | 54 | 77527 | 423.7 | 778 | 785 | 181.1 |
| D | 14 | 34 | 2780575 | 15320.48 | 751 | 732 | 181.4 |
| D | 7 | 238 | 216938 | 1191.57 | 751 | 732 | 181.4 |
| D | 13 | 168 | 193877 | 1064.48 | 751 | 732 | 181.4 |
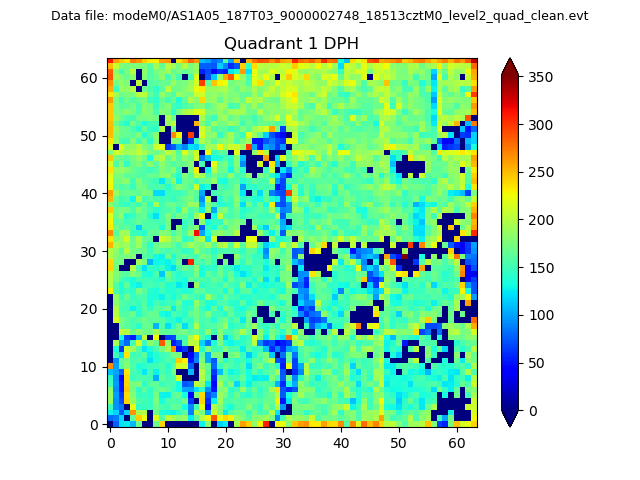
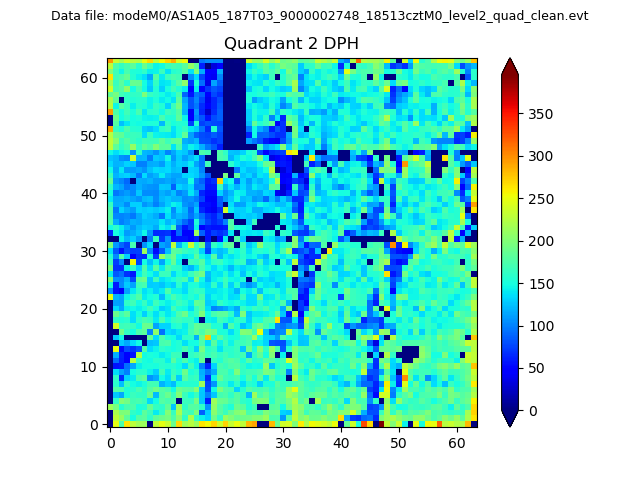
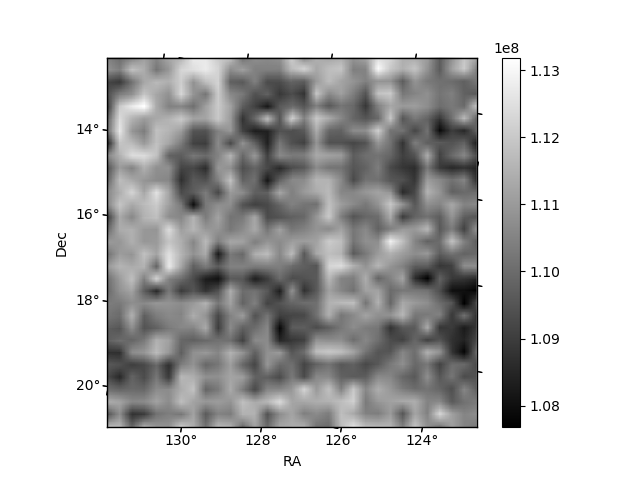
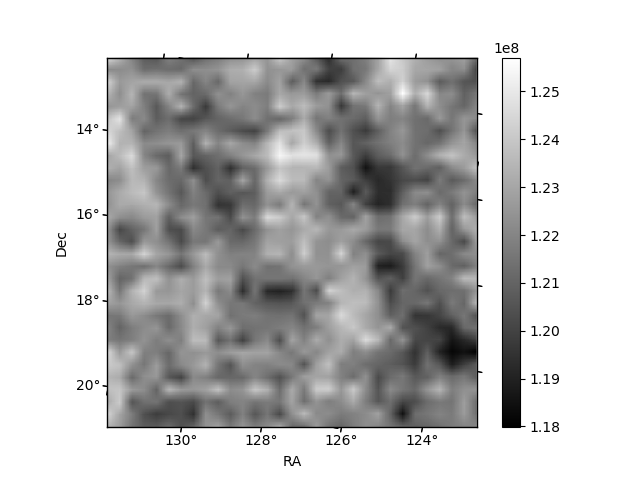
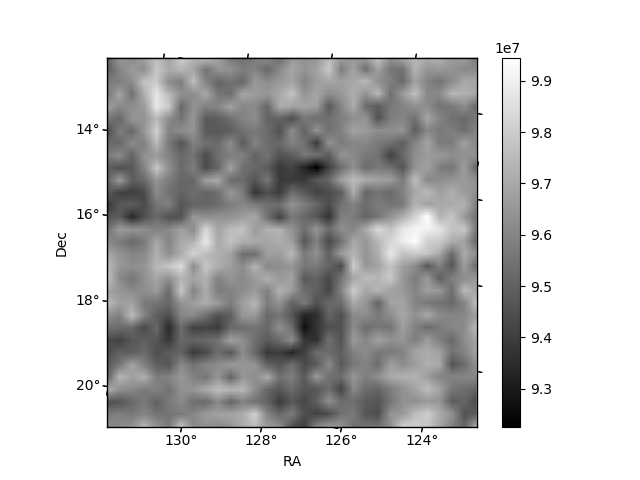
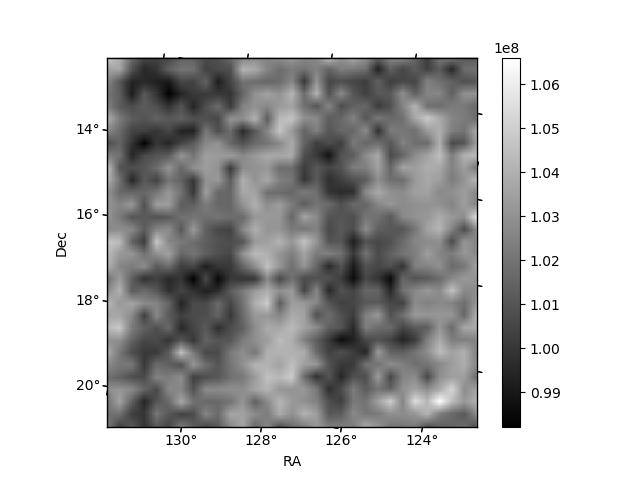
Histogram calculated using DETX and DETY for each event in the final _common_clean file
| Quadrant A |  |
 |
Quadrant B |
|---|---|---|---|
| Quadrant D |  |
 |
Quadrant C |
| Plot type | Count rate plots | Images |
|---|---|---|
| Comparison with Poisson distribution Blue bars denote a histogram of data divided into 1 sec bins. Red curve is a Poisson curve with rate = median count rate of data. |
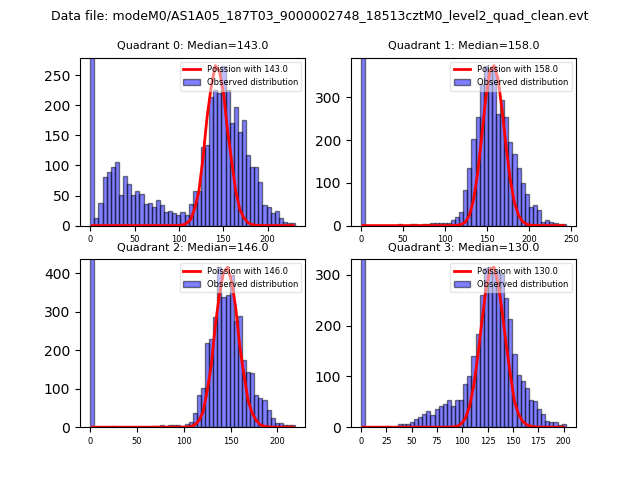 |
 |
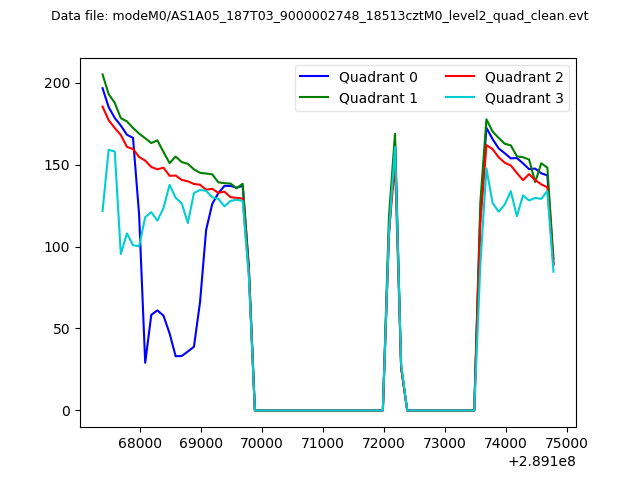
| Quadrant-wise count rates Data is divided into 100 sec bins |
 |
|
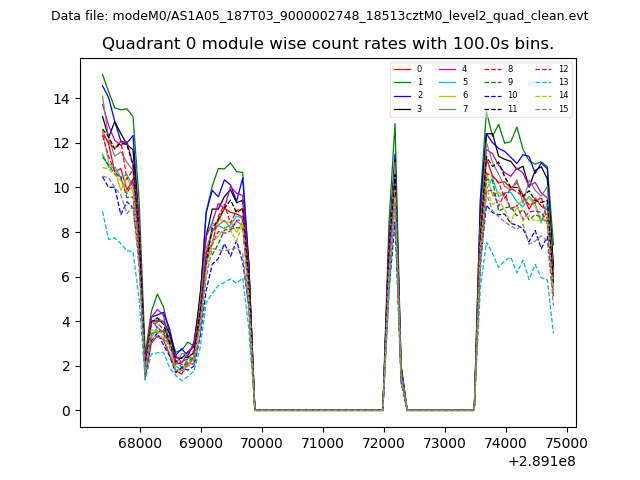
| Module-wise count rates for Quadrant A Data is divided into 100 sec bins |
 |
 |
| Module-wise count rates for Quadrant B Data is divided into 100 sec bins |
 |
 |
| Module-wise count rates for Quadrant C Data is divided into 100 sec bins |
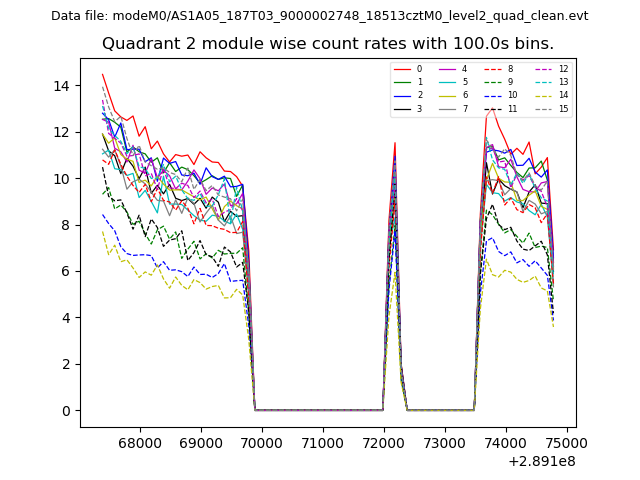 |
 |
| Module-wise count rates for Quadrant D Data is divided into 100 sec bins |
 |
 |
| Parameter | Plot |
|---|---|
| CZT HV Monitor | 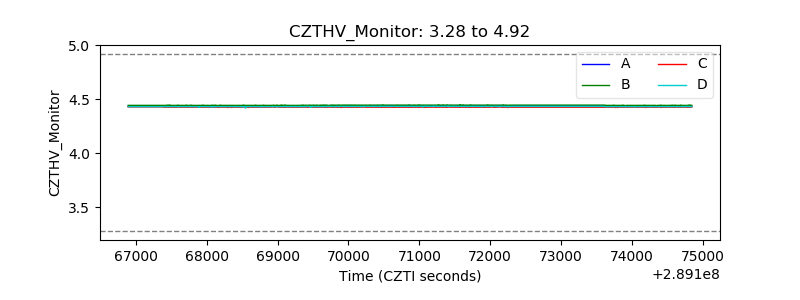 |
| D_VDD | 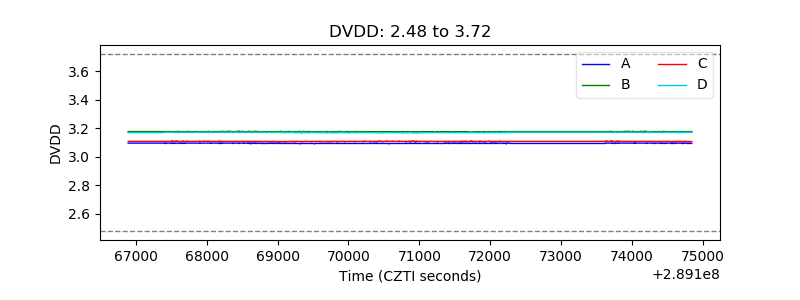 |
| Temperature 1 | 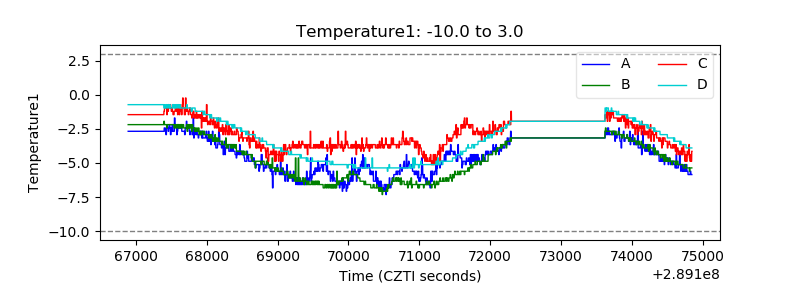 |
| Veto HV Monitor | 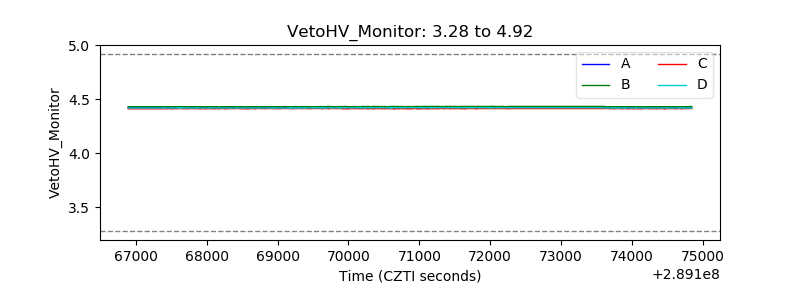 |
| Veto LLD | 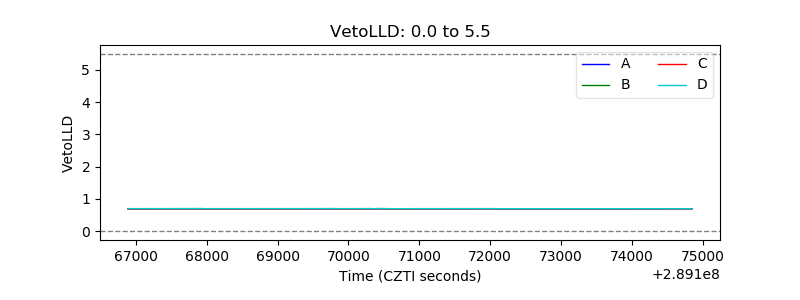 |
| Alpha Counter | 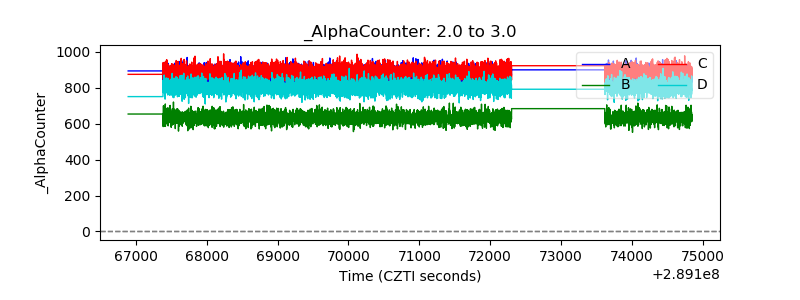 |
| _CPM_Rate | 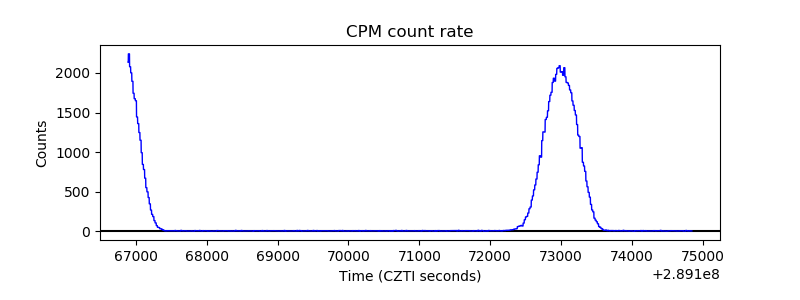 |
| CZT Counter | 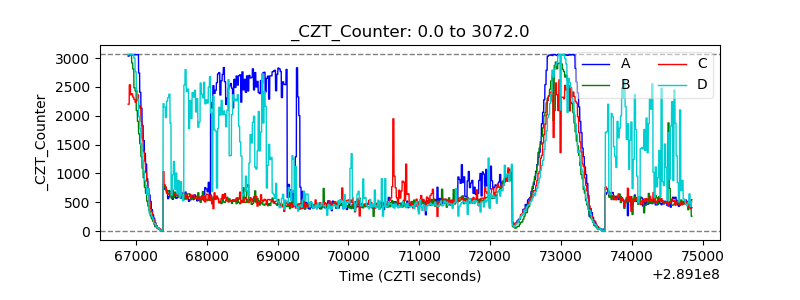 |
| +2.5 Volts monitor |  |
| +5 Volts monitor |  |
| _ROLL_ROT | 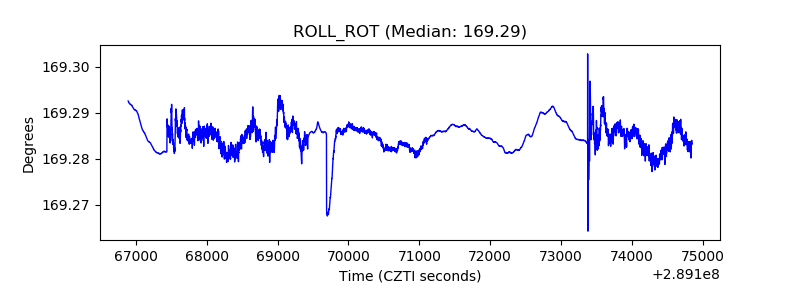 |
| _Roll_DEC | 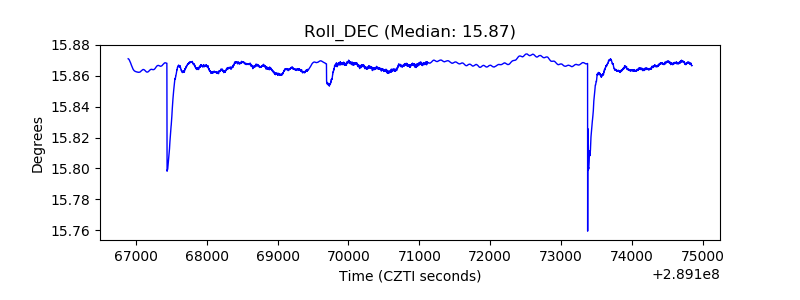 |
| _Roll_RA | 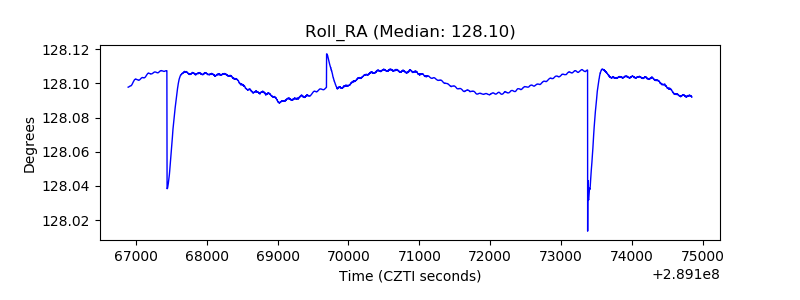 |
| Veto Counter | 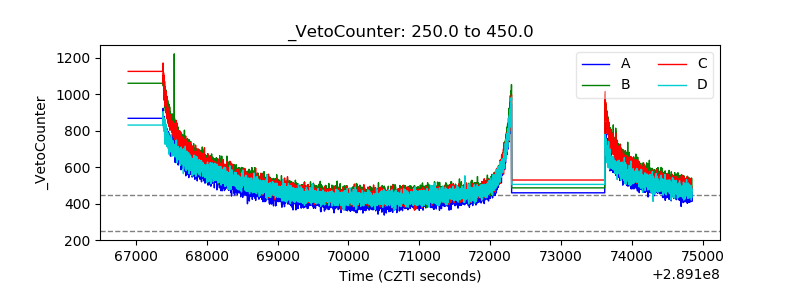 |