| Param | Original file | Final file |
|---|---|---|
| Filename | modeM0/AS1A05_187T03_9000002748_18516cztM0_level2.evt | modeM0/AS1A05_187T03_9000002748_18516cztM0_level2_quad_clean.evt |
| Size (bytes) | 686,952,000 | 87,500,160 |
| Size | 655.1 MB | 83.4 MB |
| Events in quadrant A | 3,571,045 | 568,353 |
| Events in quadrant B | 3,706,378 | 575,124 |
| Events in quadrant C | 4,786,134 | 546,035 |
| Events in quadrant D | 8,255,142 | 459,299 |
| Mode M0 | |||
|---|---|---|---|
| Quadrant | BADHDUFLAG | Total packets | Discarded packets |
| A | 0 | 15323 | 2 |
| B | 0 | 15741 | 2 |
| C | 0 | 19008 | 2 |
| D | 0 | 29499 | 2 |
| Mode SS | |||
|---|---|---|---|
| Quadrant | BADHDUFLAG | Total packets | Discarded packets |
| A | 0 | 148 | 0 |
| B | 0 | 148 | 0 |
| C | 0 | 148 | 0 |
| D | 0 | 148 | 0 |
| Mode M9 | |||
|---|---|---|---|
| Quadrant | BADHDUFLAG | Total packets | Discarded packets |
| A | 0 | 15 | 0 |
| B | 0 | 15 | 0 |
| C | 0 | 15 | 0 |
| D | 0 | 15 | 0 |
| Quadrant | Total seconds | Saturated seconds | Saturation percentage |
|---|---|---|---|
| A | 7187 | 62 | 0.862669% |
| B | 7188 | 92 | 1.279911% |
| C | 7188 | 134 | 1.864218% |
| D | 7188 | 971 | 13.508625% |
Noise dominated data is calculated using 1-second bins in cleaned event files. If a bin has >2000 counts, and if more than 50% of those come from <1% of pixels, then it is considered to be noise-dominated and hence unusable.
| Quadrant | # 1 sec bins | Bins with >0 counts | Bins with >2000 counts | High rate bins dominated by noise | Noise dominated (total time) | Noise dominated (detector-on time) | Marked lightcurve |
|---|---|---|---|---|---|---|---|
| A | 8682 | 7189 | 32 | 32 | 0.37% | 0.45% | 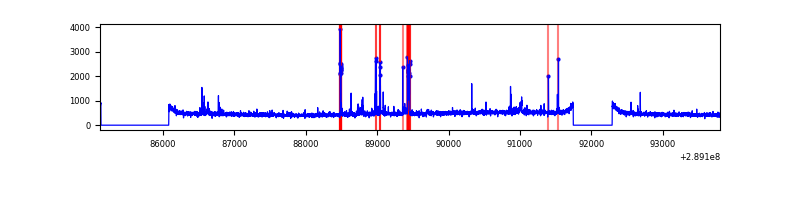 |
| B | 8683 | 7190 | 29 | 29 | 0.33% | 0.40% | 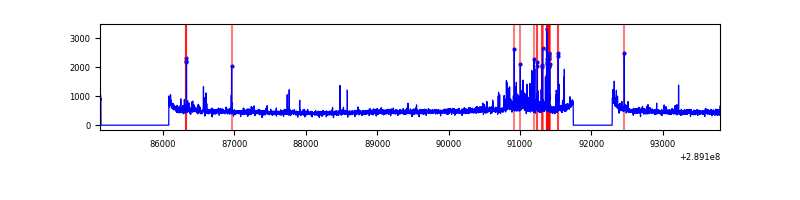 |
| C | 8683 | 7189 | 20 | 20 | 0.23% | 0.28% | 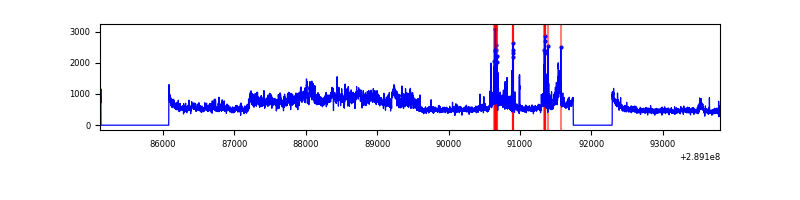 |
| D | 8683 | 7188 | 885 | 885 | 10.19% | 12.31% | 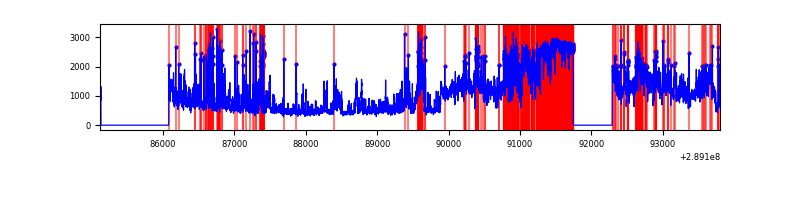 |
Top three noisy pixels from each quadrant. If the there are fewer than three noisy pixels in the level2.evt file, extra rows are filled as -1
| Pixel properties | Quadrant properties | ||||||
|---|---|---|---|---|---|---|---|
| Quadrant | DetID | PixID | Counts | Sigma | Mean | Median | Sigma |
| A | 0 | 13 | 190070 | 1079.38 | 864 | 845 | 175.3 |
| A | 15 | 174 | 26755 | 147.8 | 864 | 845 | 175.3 |
| A | 15 | 192 | 14288 | 76.68 | 864 | 845 | 175.3 |
| B | 7 | 220 | 213632 | 1253.37 | 867 | 843 | 169.8 |
| B | 0 | 228 | 24449 | 139.04 | 867 | 843 | 169.8 |
| B | 12 | 111 | 19951 | 112.55 | 867 | 843 | 169.8 |
| C | 3 | 233 | 1296906 | 6668.03 | 828 | 833 | 194.4 |
| C | 14 | 238 | 128199 | 655.27 | 828 | 833 | 194.4 |
| C | 0 | 207 | 124541 | 636.45 | 828 | 833 | 194.4 |
| D | 13 | 168 | 4007208 | 20986.96 | 772 | 750 | 190.9 |
| D | 1 | 52 | 597290 | 3124.85 | 772 | 750 | 190.9 |
| D | 7 | 238 | 559691 | 2927.89 | 772 | 750 | 190.9 |
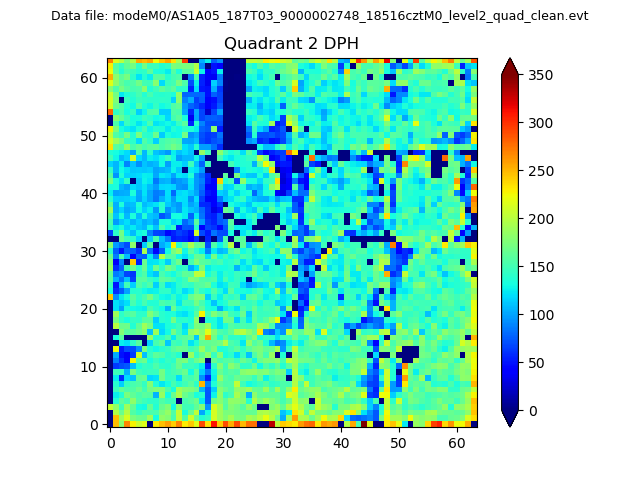
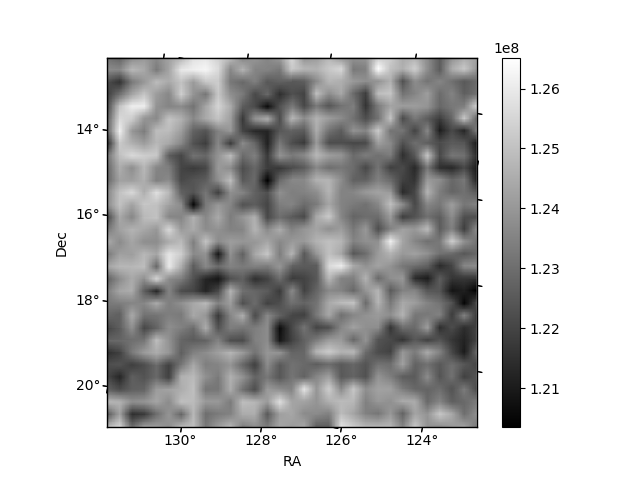
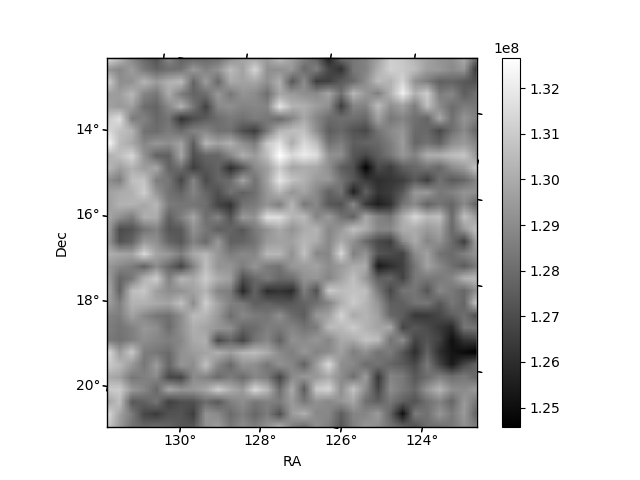
Histogram calculated using DETX and DETY for each event in the final _common_clean file
| Quadrant A | 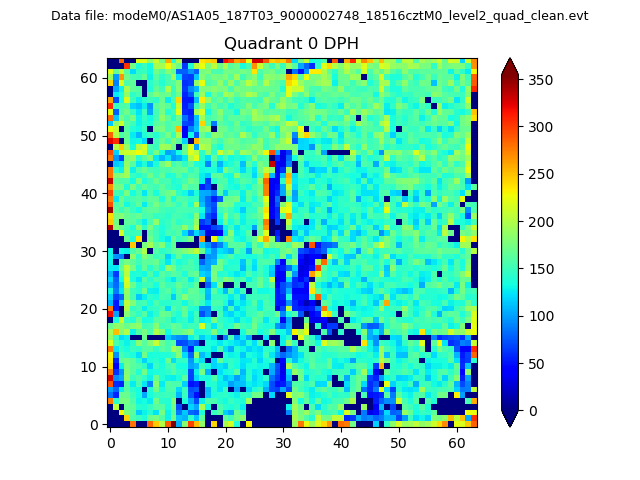 |
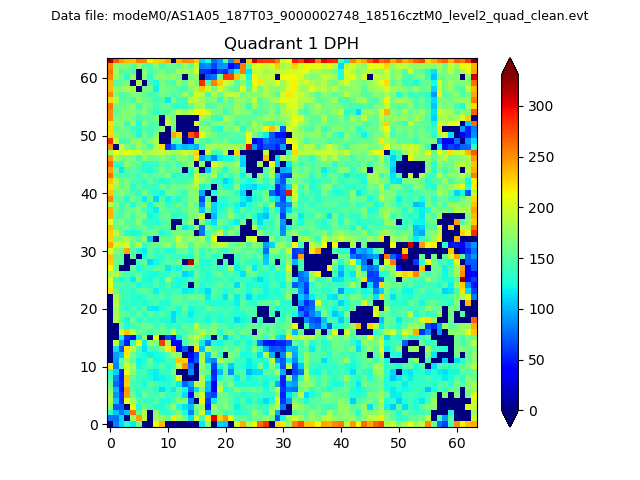 |
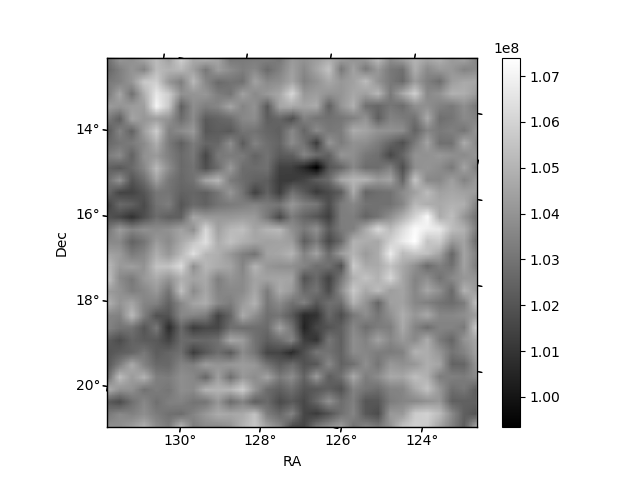
Quadrant B |
|---|---|---|---|
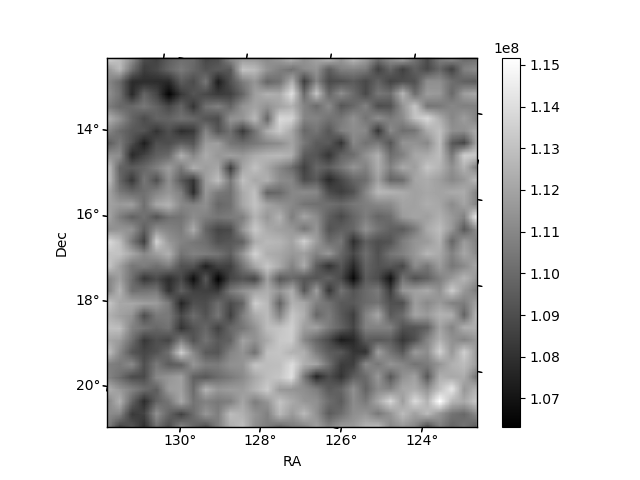
| Quadrant D | 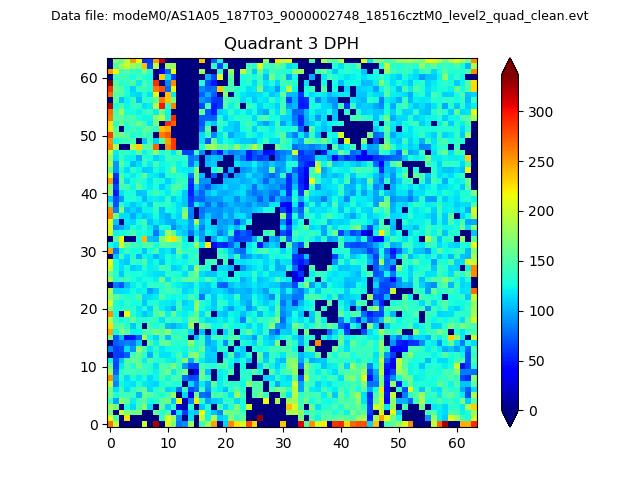 |
 |
Quadrant C |
| Plot type | Count rate plots | Images |
|---|---|---|
| Comparison with Poisson distribution Blue bars denote a histogram of data divided into 1 sec bins. Red curve is a Poisson curve with rate = median count rate of data. |
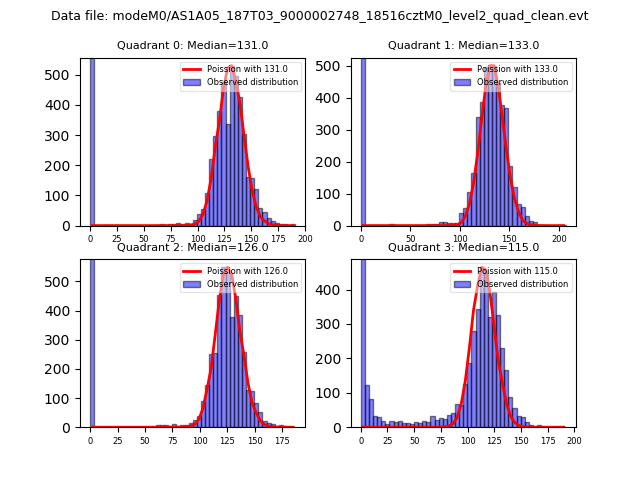 |
 |
| Quadrant-wise count rates Data is divided into 100 sec bins |
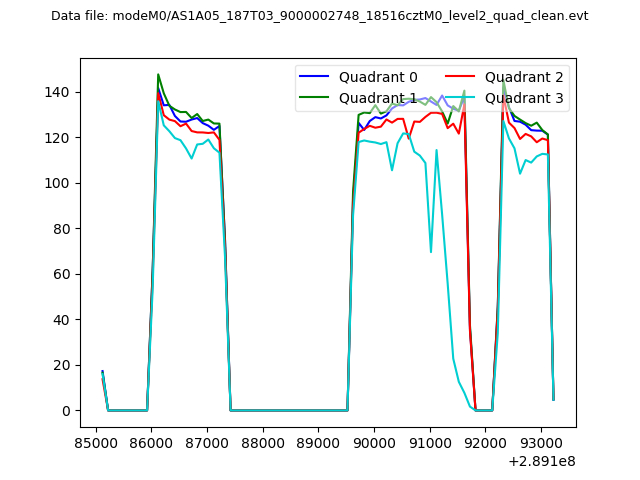 |
|
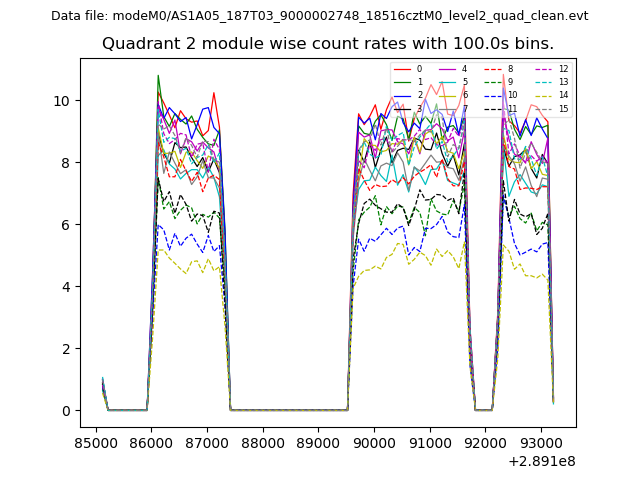
| Module-wise count rates for Quadrant A Data is divided into 100 sec bins |
 |
 |
| Module-wise count rates for Quadrant B Data is divided into 100 sec bins |
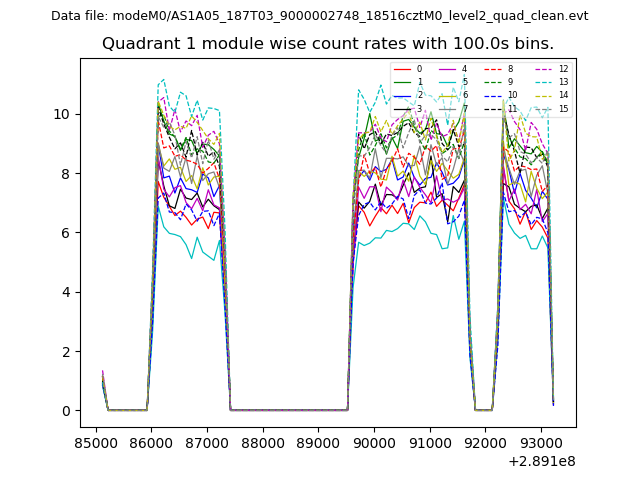 |
 |
| Module-wise count rates for Quadrant C Data is divided into 100 sec bins |
 |
 |
| Module-wise count rates for Quadrant D Data is divided into 100 sec bins |
 |
 |
| Parameter | Plot |
|---|---|
| CZT HV Monitor |  |
| D_VDD | 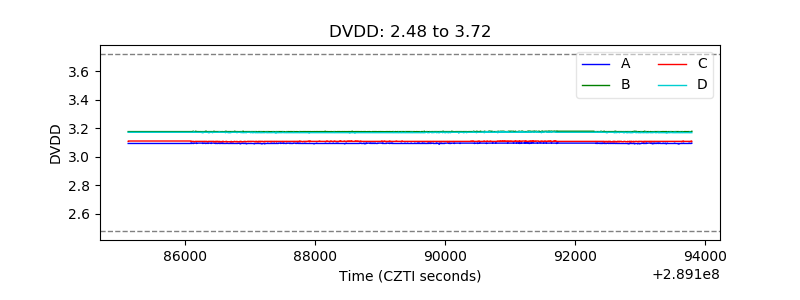 |
| Temperature 1 | 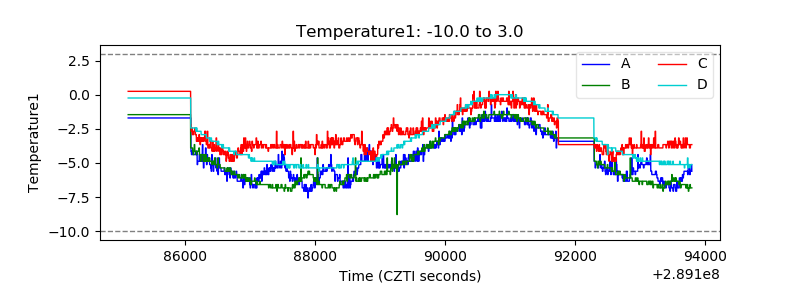 |
| Veto HV Monitor | 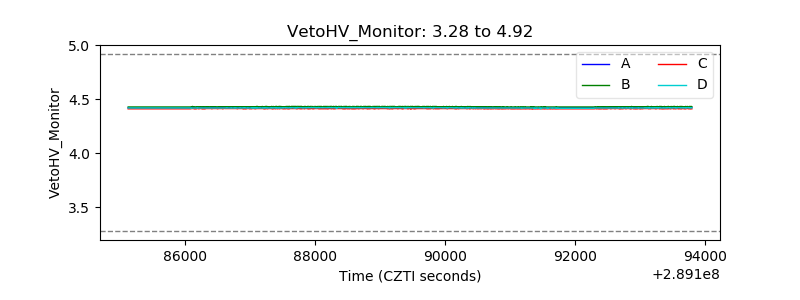 |
| Veto LLD | 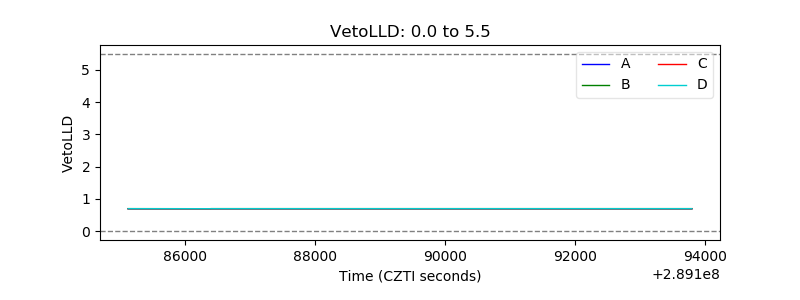 |
| Alpha Counter |  |
| _CPM_Rate | 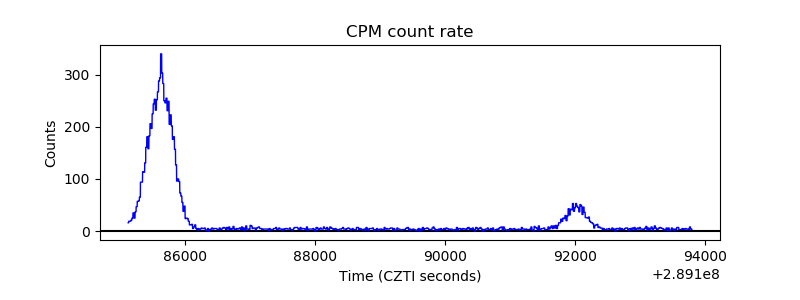 |
| CZT Counter | 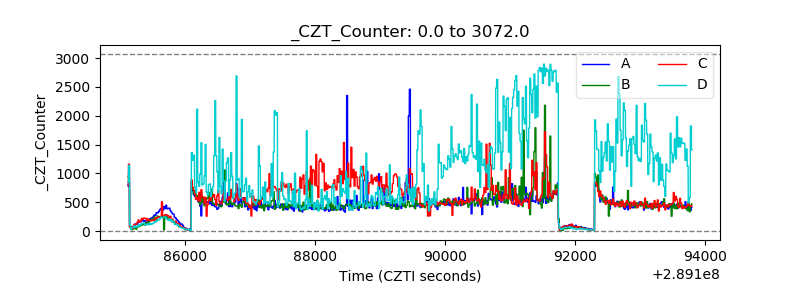 |
| +2.5 Volts monitor |  |
| +5 Volts monitor |  |
| _ROLL_ROT | 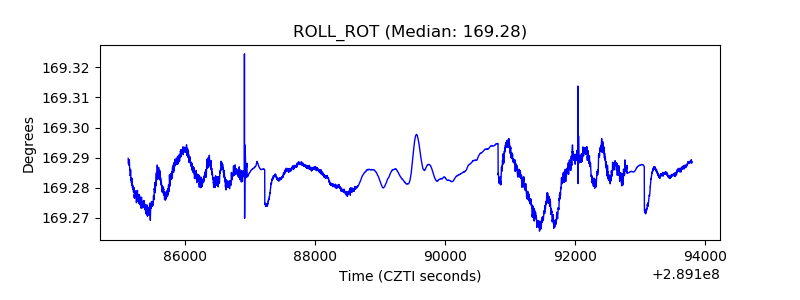 |
| _Roll_DEC | 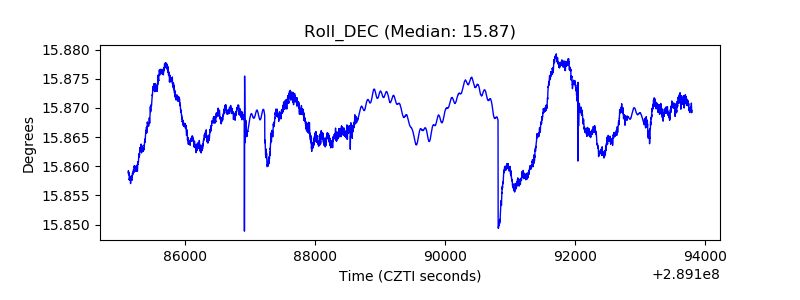 |
| _Roll_RA | 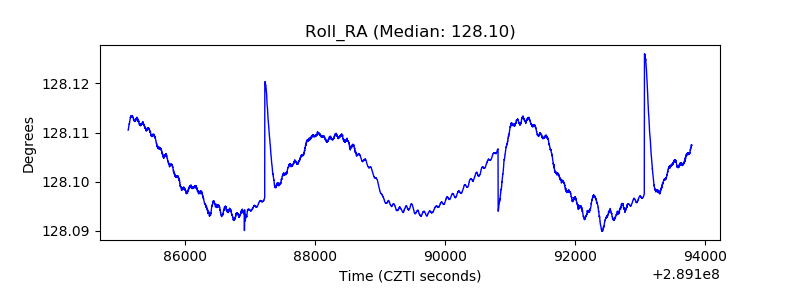 |
| Veto Counter | 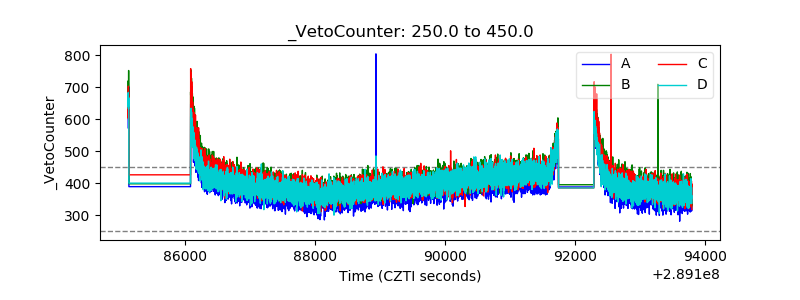 |