| Param | Original file | Final file |
|---|---|---|
| Filename | modeM0/AS1A05_187T03_9000002748_18517cztM0_level2.evt | modeM0/AS1A05_187T03_9000002748_18517cztM0_level2_quad_clean.evt |
| Size (bytes) | 842,336,640 | 89,161,920 |
| Size | 803.3 MB | 85.0 MB |
| Events in quadrant A | 4,626,835 | 561,468 |
| Events in quadrant B | 4,140,847 | 585,248 |
| Events in quadrant C | 4,101,315 | 559,434 |
| Events in quadrant D | 12,115,549 | 451,356 |
| Mode M0 | |||
|---|---|---|---|
| Quadrant | BADHDUFLAG | Total packets | Discarded packets |
| A | 0 | 19050 | 2 |
| B | 0 | 17396 | 2 |
| C | 0 | 17292 | 3 |
| D | 0 | 41266 | 2 |
| Mode SS | |||
|---|---|---|---|
| Quadrant | BADHDUFLAG | Total packets | Discarded packets |
| A | 0 | 160 | 0 |
| B | 0 | 160 | 0 |
| C | 0 | 160 | 0 |
| D | 0 | 160 | 0 |
| Mode M9 | |||
|---|---|---|---|
| Quadrant | BADHDUFLAG | Total packets | Discarded packets |
| A | 0 | 7 | 0 |
| B | 0 | 7 | 0 |
| C | 0 | 7 | 0 |
| D | 0 | 7 | 0 |
| Quadrant | Total seconds | Saturated seconds | Saturation percentage |
|---|---|---|---|
| A | 7786 | 405 | 5.201644% |
| B | 7786 | 249 | 3.198048% |
| C | 7785 | 171 | 2.196532% |
| D | 7786 | 2505 | 32.173131% |
Noise dominated data is calculated using 1-second bins in cleaned event files. If a bin has >2000 counts, and if more than 50% of those come from <1% of pixels, then it is considered to be noise-dominated and hence unusable.
| Quadrant | # 1 sec bins | Bins with >0 counts | Bins with >2000 counts | High rate bins dominated by noise | Noise dominated (total time) | Noise dominated (detector-on time) | Marked lightcurve |
|---|---|---|---|---|---|---|---|
| A | 8456 | 7787 | 183 | 183 | 2.16% | 2.35% | 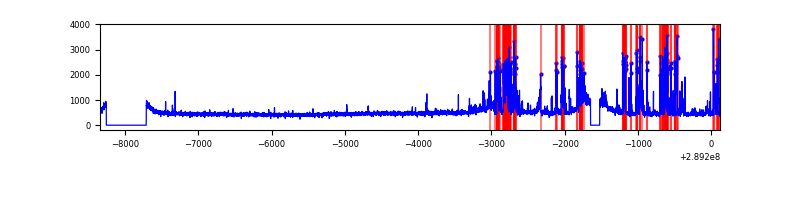 |
| B | 8456 | 7787 | 38 | 38 | 0.45% | 0.49% | 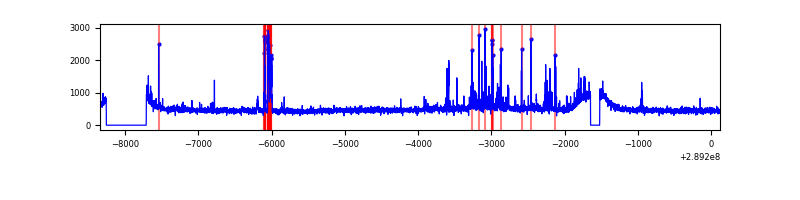 |
| C | 8455 | 7786 | 2 | 2 | 0.02% | 0.03% | 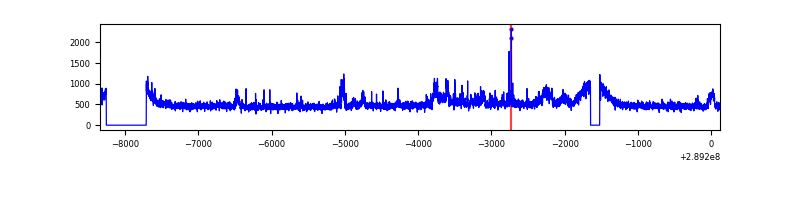 |
| D | 8456 | 7786 | 2495 | 2495 | 29.51% | 32.04% | 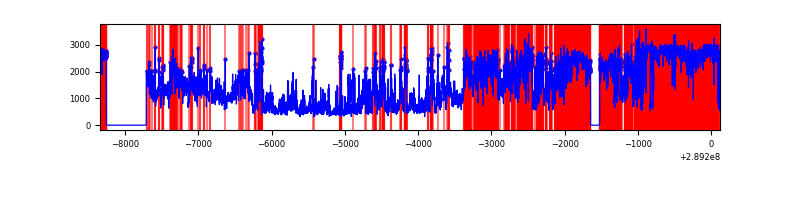 |
Top three noisy pixels from each quadrant. If the there are fewer than three noisy pixels in the level2.evt file, extra rows are filled as -1
| Pixel properties | Quadrant properties | ||||||
|---|---|---|---|---|---|---|---|
| Quadrant | DetID | PixID | Counts | Sigma | Mean | Median | Sigma |
| A | 0 | 13 | 916745 | 4774.58 | 940 | 919 | 191.8 |
| A | 14 | 111 | 56378 | 289.13 | 940 | 919 | 191.8 |
| A | 15 | 192 | 13829 | 67.31 | 940 | 919 | 191.8 |
| B | 7 | 220 | 146331 | 772.08 | 960 | 935 | 188.3 |
| B | 15 | 222 | 116559 | 613.99 | 960 | 935 | 188.3 |
| B | 0 | 228 | 23703 | 120.9 | 960 | 935 | 188.3 |
| C | 3 | 233 | 358339 | 1622.88 | 920 | 925 | 220.2 |
| C | 14 | 238 | 139129 | 627.53 | 920 | 925 | 220.2 |
| C | 0 | 207 | 13685 | 57.94 | 920 | 925 | 220.2 |
| D | 13 | 168 | 7960034 | 42003.46 | 771 | 748 | 189.5 |
| D | 1 | 52 | 623126 | 3284.47 | 771 | 748 | 189.5 |
| D | 7 | 238 | 346427 | 1824.25 | 771 | 748 | 189.5 |
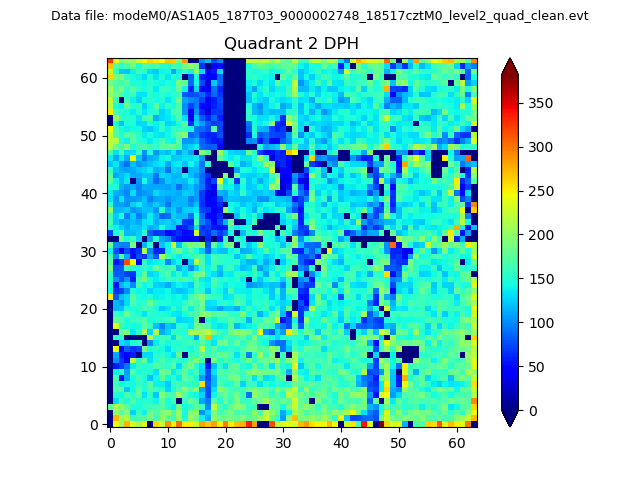
Histogram calculated using DETX and DETY for each event in the final _common_clean file
| Quadrant A | 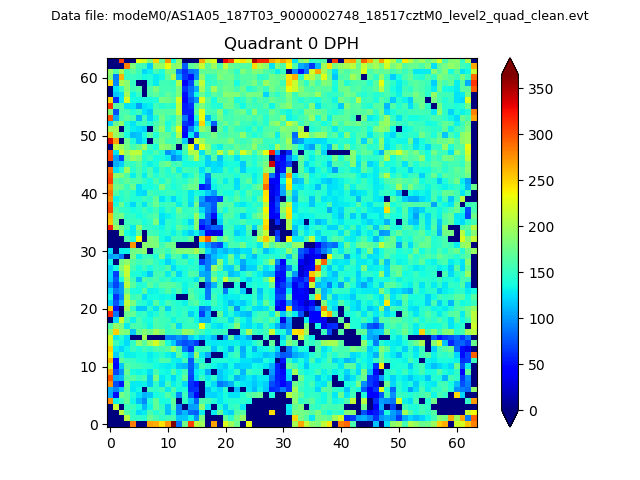 |
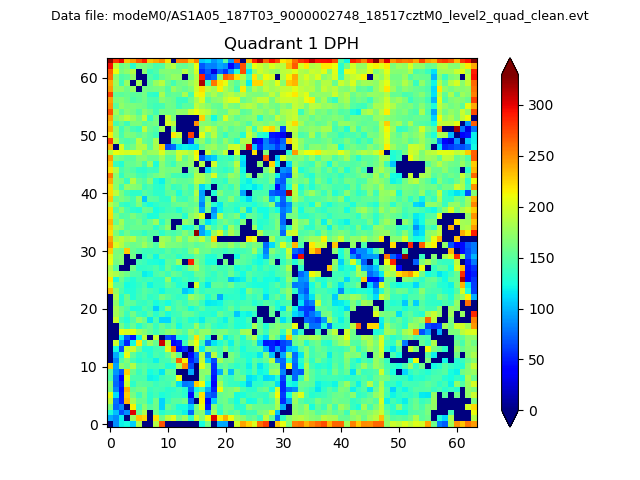 |
Quadrant B |
|---|---|---|---|
| Quadrant D | 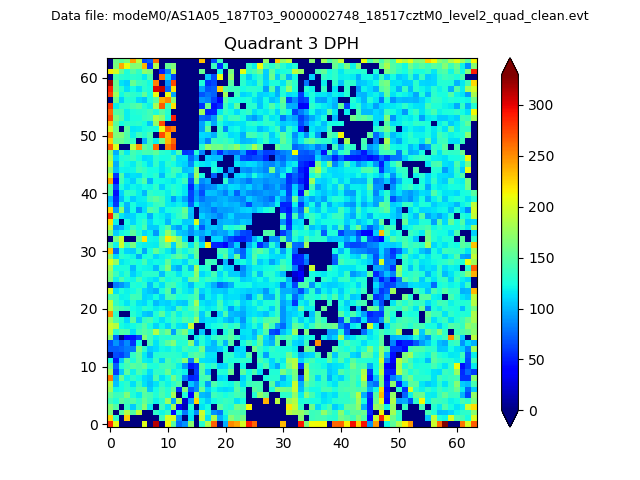 |
 |
Quadrant C |
| Plot type | Count rate plots | Images |
|---|---|---|
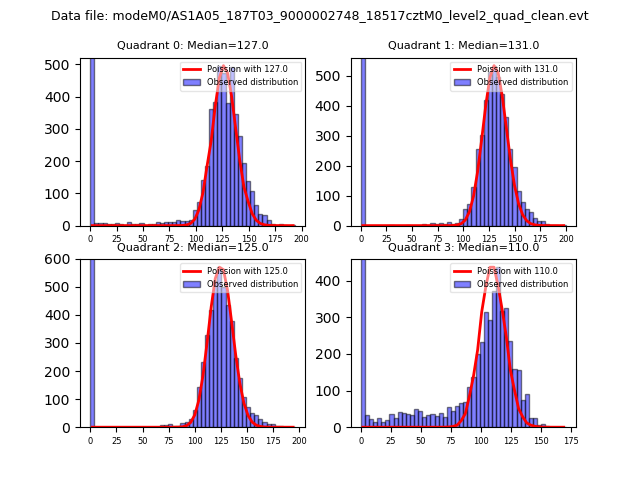
| Comparison with Poisson distribution Blue bars denote a histogram of data divided into 1 sec bins. Red curve is a Poisson curve with rate = median count rate of data. |
 |
 |
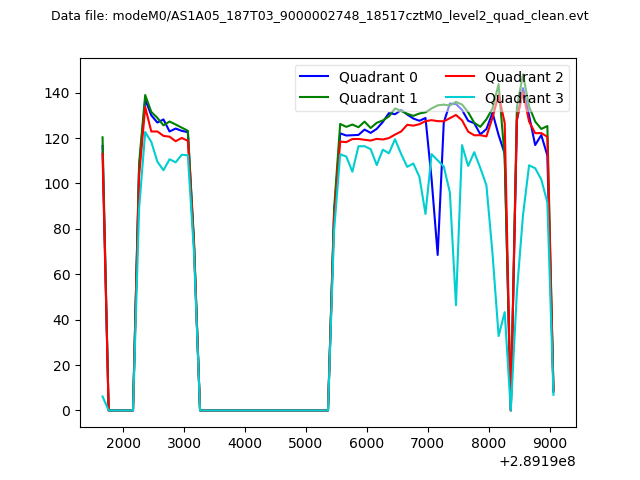
| Quadrant-wise count rates Data is divided into 100 sec bins |
 |
|
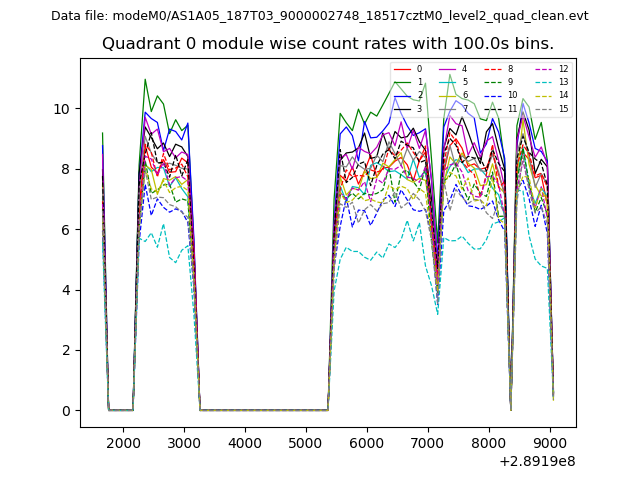
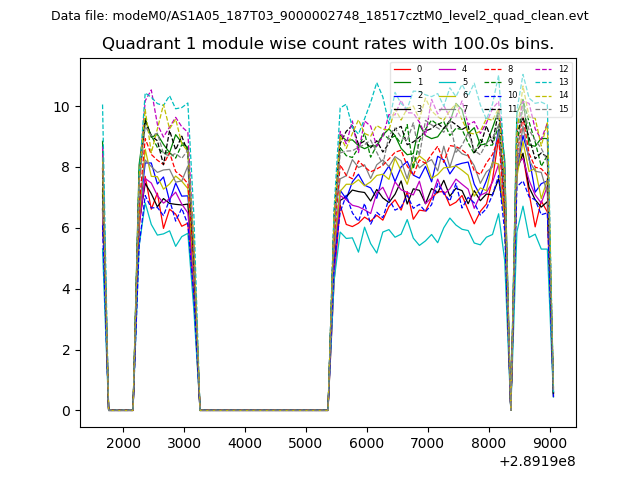
| Module-wise count rates for Quadrant A Data is divided into 100 sec bins |
 |
 |
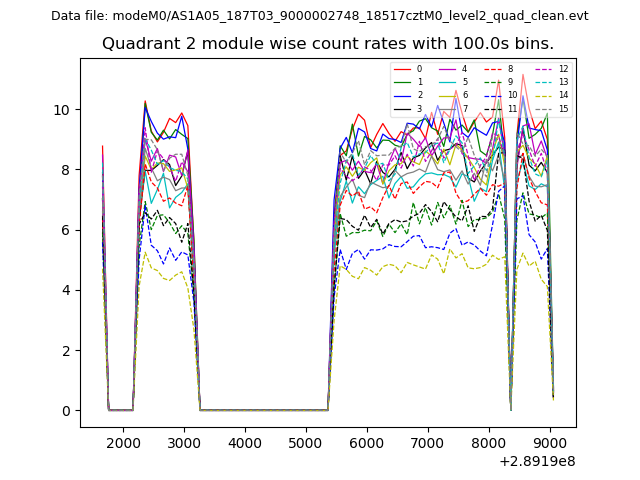
| Module-wise count rates for Quadrant B Data is divided into 100 sec bins |
 |
 |
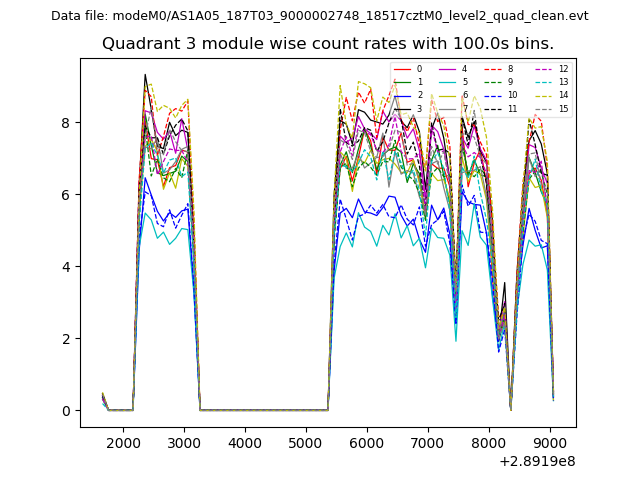
| Module-wise count rates for Quadrant C Data is divided into 100 sec bins |
 |
 |
| Module-wise count rates for Quadrant D Data is divided into 100 sec bins |
 |
 |
| Parameter | Plot |
|---|---|
| CZT HV Monitor | 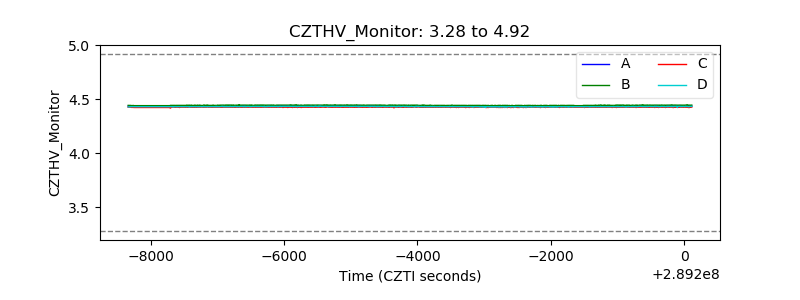 |
| D_VDD | 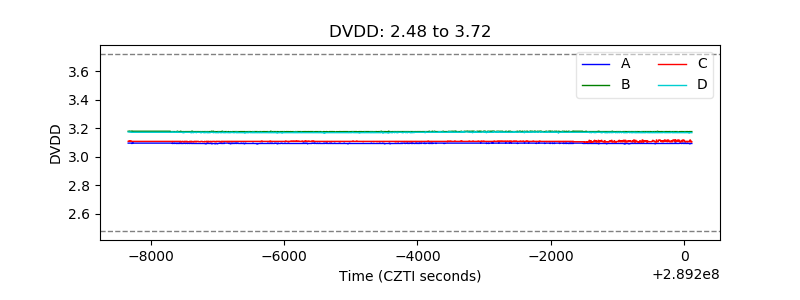 |
| Temperature 1 | 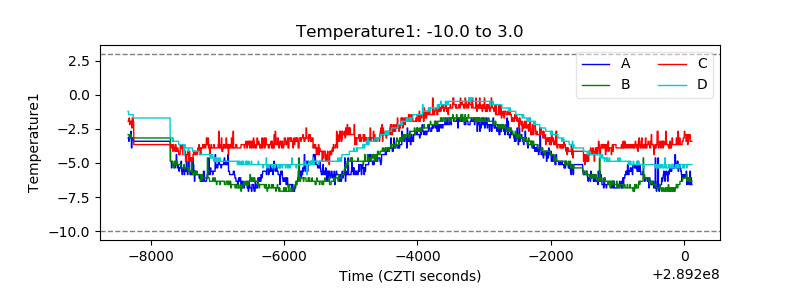 |
| Veto HV Monitor | 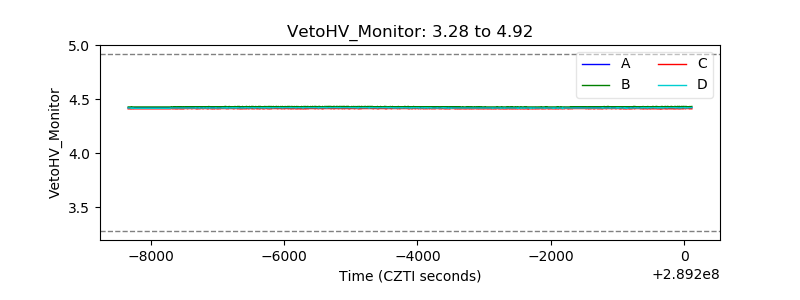 |
| Veto LLD | 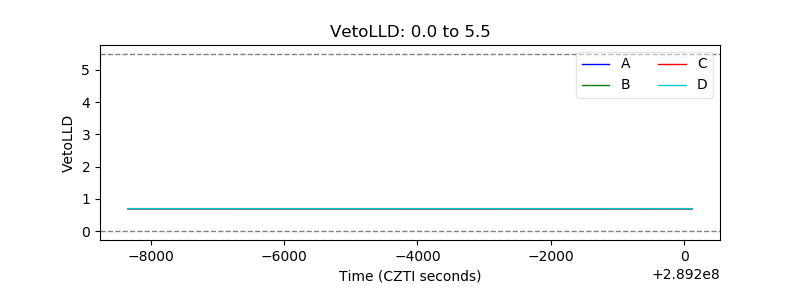 |
| Alpha Counter | 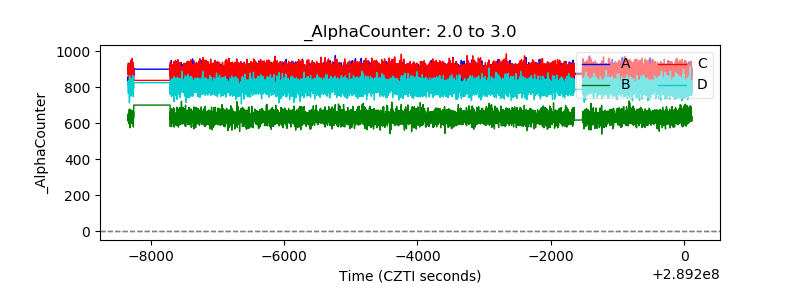 |
| _CPM_Rate | 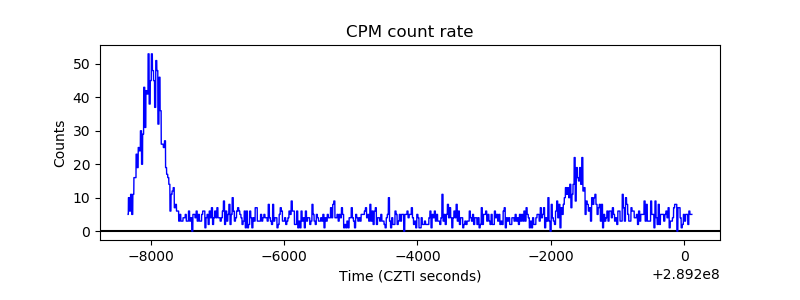 |
| CZT Counter | 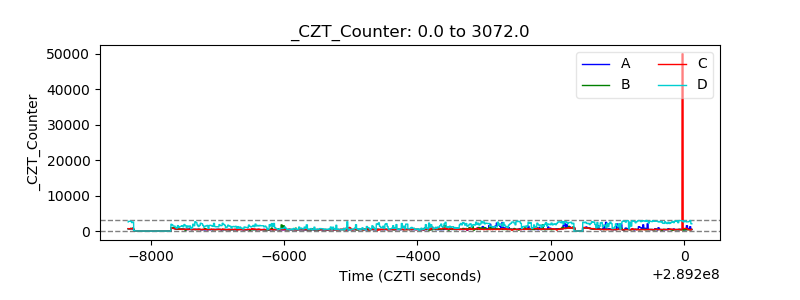 |
| +2.5 Volts monitor |  |
| +5 Volts monitor |  |
| _ROLL_ROT | 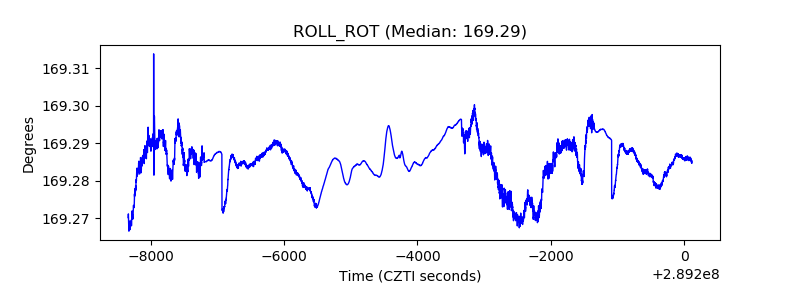 |
| _Roll_DEC | 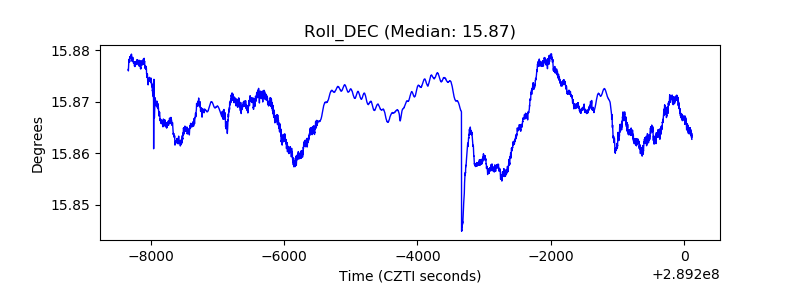 |
| _Roll_RA |  |
| Veto Counter | 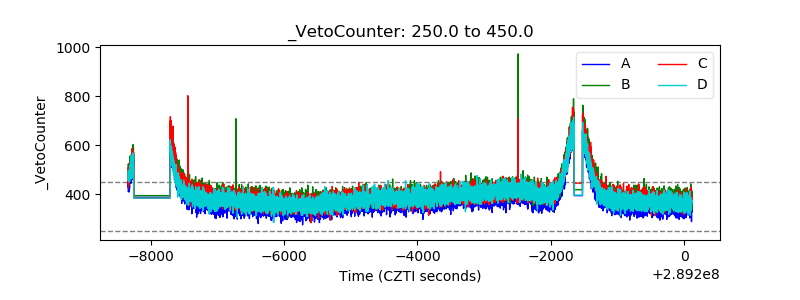 |