| Param | Original file | Final file |
|---|---|---|
| Filename | modeM0/AS1A05_187T03_9000002748_18521cztM0_level2.evt | modeM0/AS1A05_187T03_9000002748_18521cztM0_level2_quad_clean.evt |
| Size (bytes) | 1,477,480,320 | 224,138,880 |
| Size | 1.4 GB | 213.8 MB |
| Events in quadrant A | 11,483,828 | 1,395,044 |
| Events in quadrant B | 9,087,582 | 1,439,561 |
| Events in quadrant C | 9,593,461 | 1,371,648 |
| Events in quadrant D | 13,317,375 | 1,292,993 |
| Mode M0 | |||
|---|---|---|---|
| Quadrant | BADHDUFLAG | Total packets | Discarded packets |
| A | 0 | 46297 | 4 |
| B | 0 | 38953 | 4 |
| C | 0 | 40008 | 4 |
| D | 0 | 52036 | 4 |
| Mode SS | |||
|---|---|---|---|
| Quadrant | BADHDUFLAG | Total packets | Discarded packets |
| A | 0 | 380 | 0 |
| B | 0 | 380 | 0 |
| C | 0 | 380 | 0 |
| D | 0 | 380 | 0 |
| Mode M9 | |||
|---|---|---|---|
| Quadrant | BADHDUFLAG | Total packets | Discarded packets |
| A | 0 | 22 | 0 |
| B | 0 | 22 | 0 |
| C | 0 | 22 | 0 |
| D | 0 | 22 | 0 |
| Quadrant | Total seconds | Saturated seconds | Saturation percentage |
|---|---|---|---|
| A | 18711 | 1152 | 6.156806% |
| B | 18711 | 372 | 1.988135% |
| C | 18711 | 365 | 1.950724% |
| D | 18711 | 1569 | 8.385442% |
Noise dominated data is calculated using 1-second bins in cleaned event files. If a bin has >2000 counts, and if more than 50% of those come from <1% of pixels, then it is considered to be noise-dominated and hence unusable.
| Quadrant | # 1 sec bins | Bins with >0 counts | Bins with >2000 counts | High rate bins dominated by noise | Noise dominated (total time) | Noise dominated (detector-on time) | Marked lightcurve |
|---|---|---|---|---|---|---|---|
| A | 20791 | 18711 | 691 | 691 | 3.32% | 3.69% | 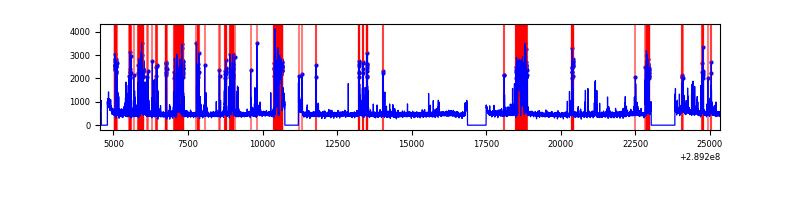 |
| B | 20791 | 18711 | 29 | 29 | 0.14% | 0.15% |  |
| C | 20791 | 18711 | 3 | 3 | 0.01% | 0.02% | 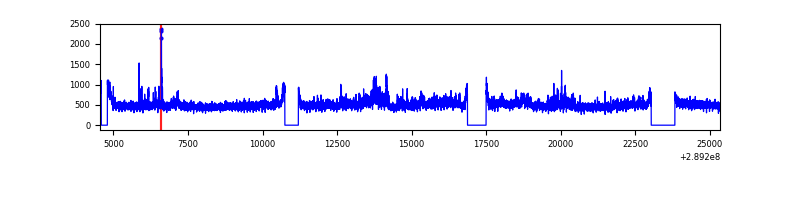 |
| D | 20791 | 18712 | 898 | 898 | 4.32% | 4.80% | 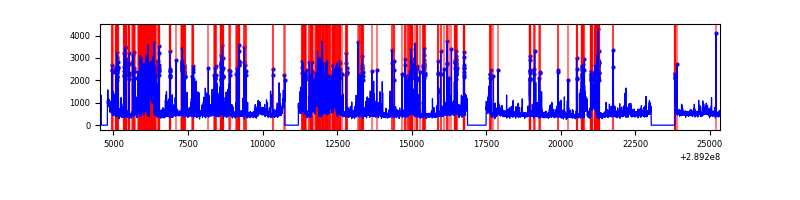 |
Top three noisy pixels from each quadrant. If the there are fewer than three noisy pixels in the level2.evt file, extra rows are filled as -1
| Pixel properties | Quadrant properties | ||||||
|---|---|---|---|---|---|---|---|
| Quadrant | DetID | PixID | Counts | Sigma | Mean | Median | Sigma |
| A | 0 | 13 | 2814657 | 6233.43 | 2227 | 2176 | 451.2 |
| A | 15 | 192 | 72970 | 156.9 | 2227 | 2176 | 451.2 |
| A | 13 | 254 | 24834 | 50.22 | 2227 | 2176 | 451.2 |
| B | 3 | 64 | 128588 | 291.56 | 2262 | 2204 | 433.5 |
| B | 15 | 222 | 61485 | 136.76 | 2262 | 2204 | 433.5 |
| B | 12 | 111 | 53818 | 119.07 | 2262 | 2204 | 433.5 |
| C | 3 | 233 | 770920 | 1499.11 | 2170 | 2186 | 512.8 |
| C | 14 | 238 | 334018 | 647.11 | 2170 | 2186 | 512.8 |
| C | 9 | 54 | 25344 | 45.16 | 2170 | 2186 | 512.8 |
| D | 7 | 238 | 2748593 | 5275.6 | 2119 | 2055 | 520.6 |
| D | 1 | 52 | 2334448 | 4480.1 | 2119 | 2055 | 520.6 |
| D | 13 | 168 | 135845 | 256.99 | 2119 | 2055 | 520.6 |
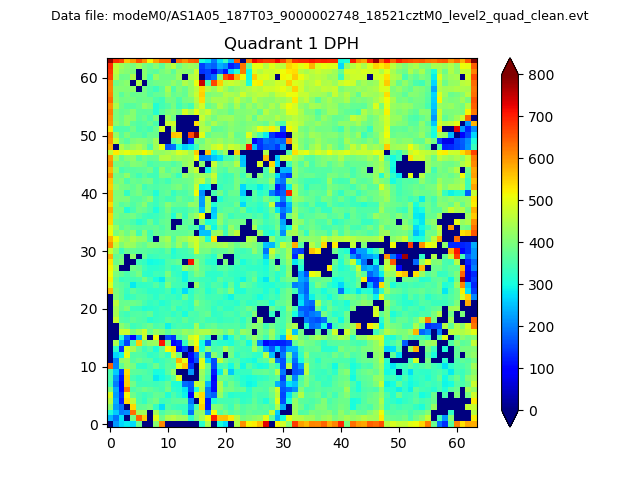
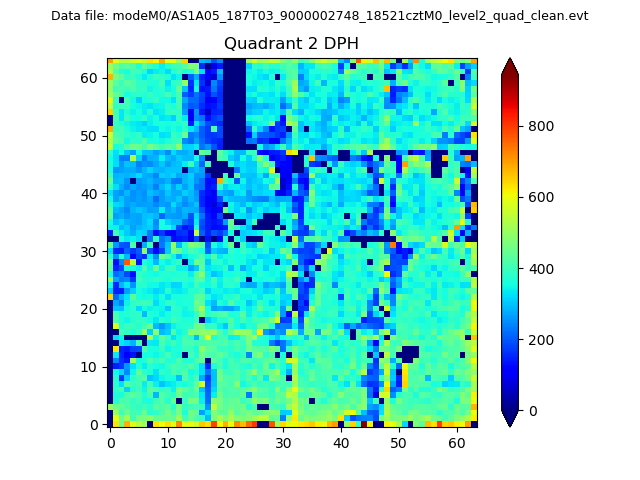
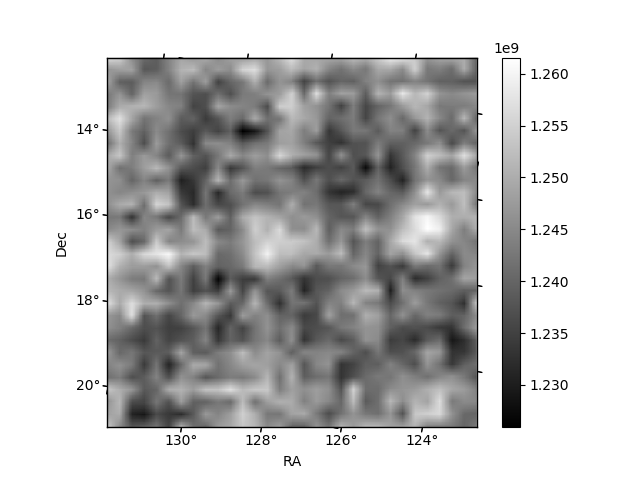
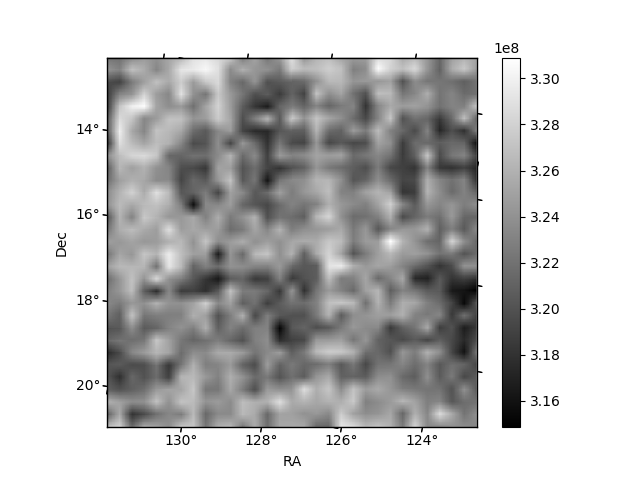
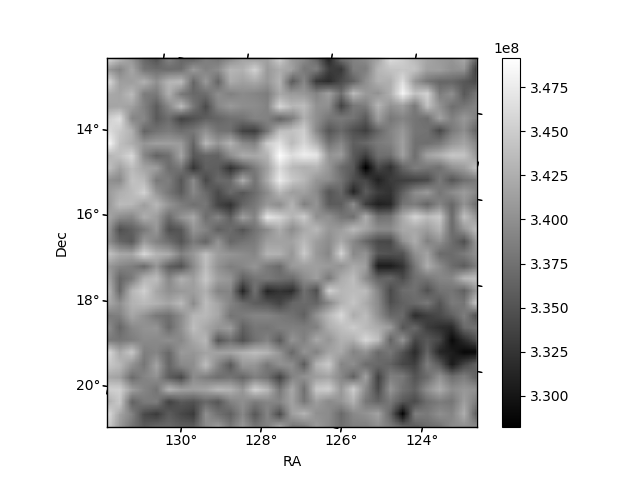
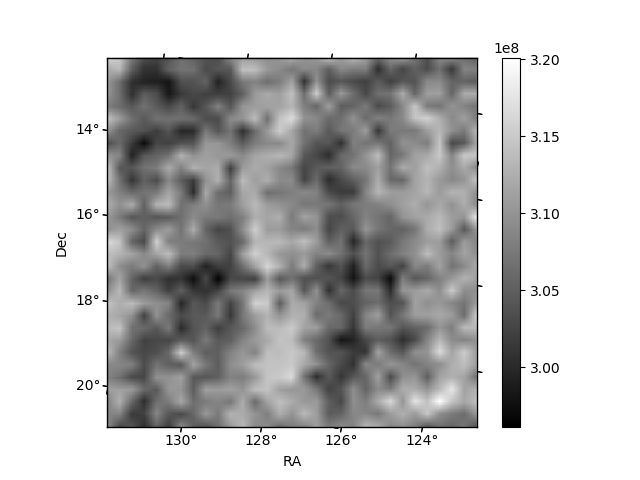
Histogram calculated using DETX and DETY for each event in the final _common_clean file
| Quadrant A | 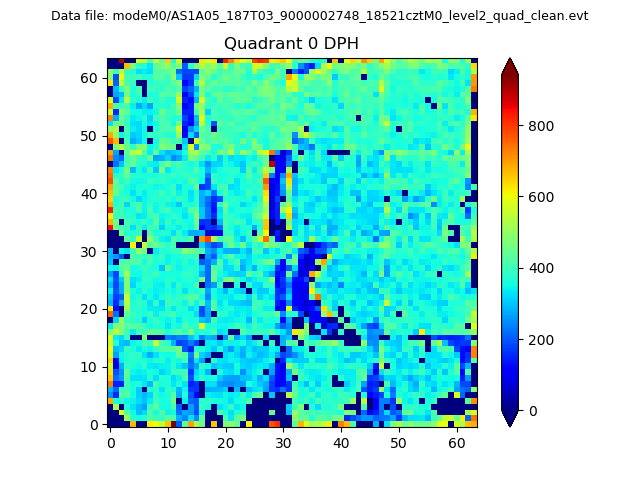 |
 |
Quadrant B |
|---|---|---|---|
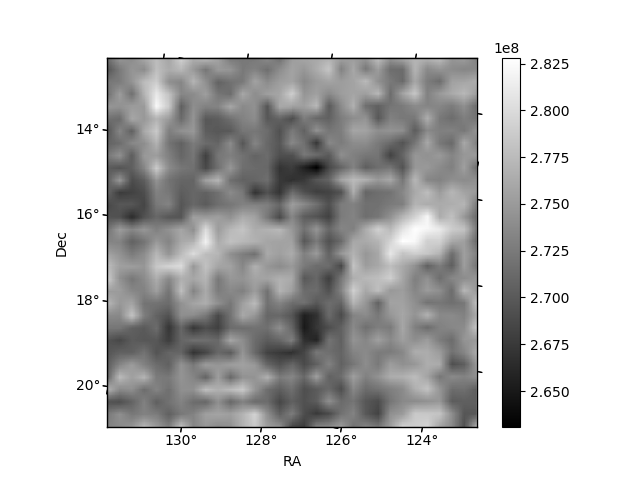
| Quadrant D | 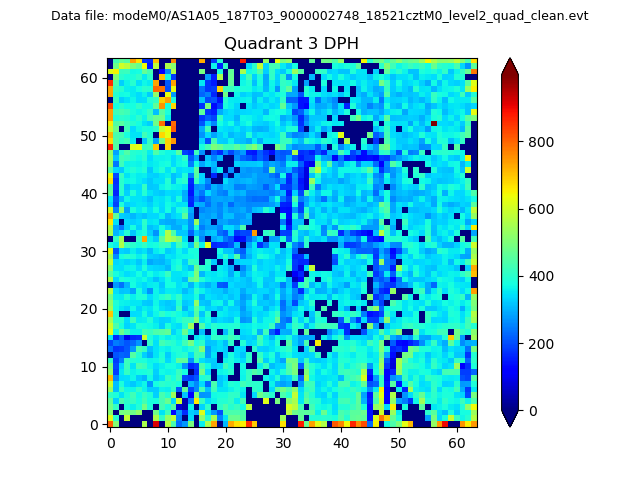 |
 |
Quadrant C |
| Plot type | Count rate plots | Images |
|---|---|---|
| Comparison with Poisson distribution Blue bars denote a histogram of data divided into 1 sec bins. Red curve is a Poisson curve with rate = median count rate of data. |
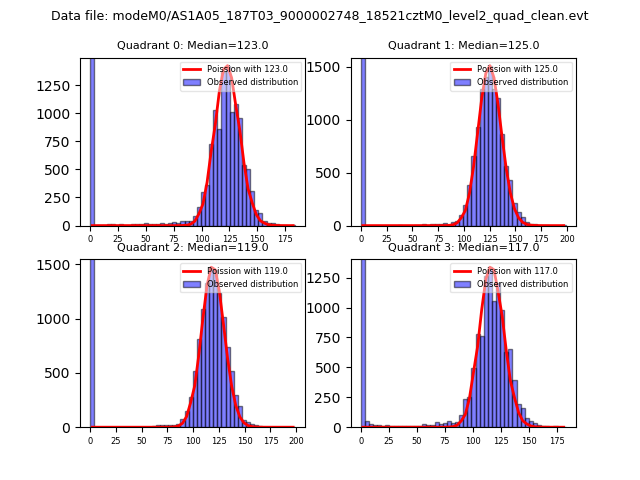 |
 |
| Quadrant-wise count rates Data is divided into 100 sec bins |
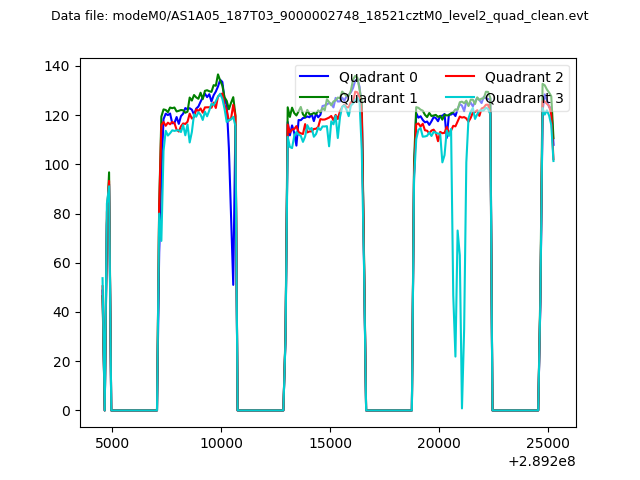 |
|
| Module-wise count rates for Quadrant A Data is divided into 100 sec bins |
 |
 |
| Module-wise count rates for Quadrant B Data is divided into 100 sec bins |
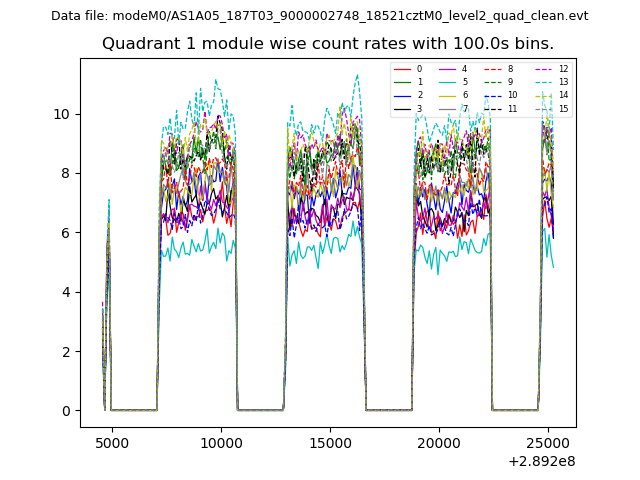 |
 |
| Module-wise count rates for Quadrant C Data is divided into 100 sec bins |
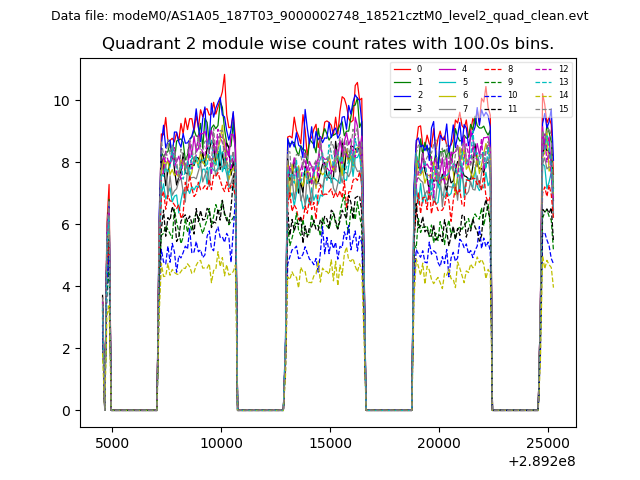 |
 |
| Module-wise count rates for Quadrant D Data is divided into 100 sec bins |
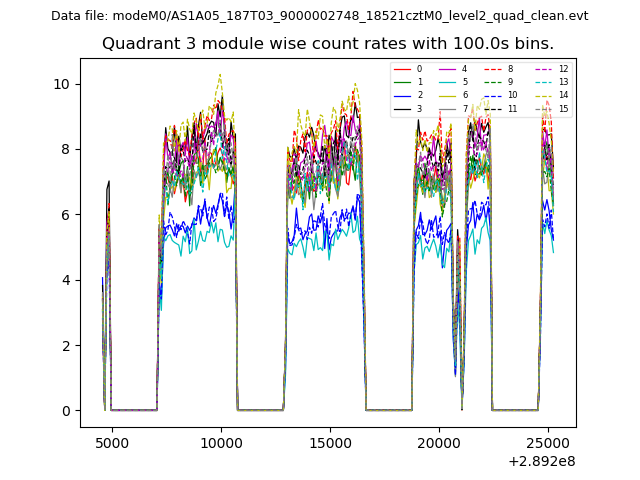 |
 |
| Parameter | Plot |
|---|---|
| CZT HV Monitor |  |
| D_VDD | 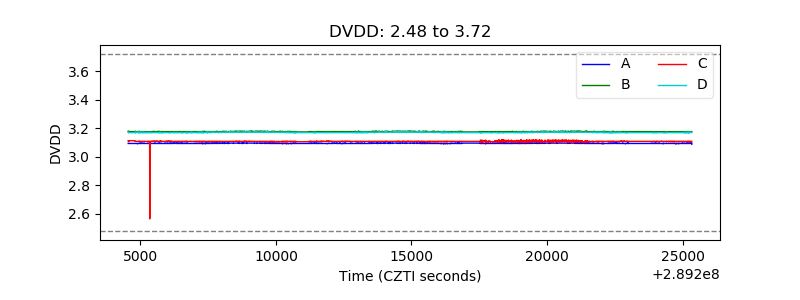 |
| Temperature 1 | 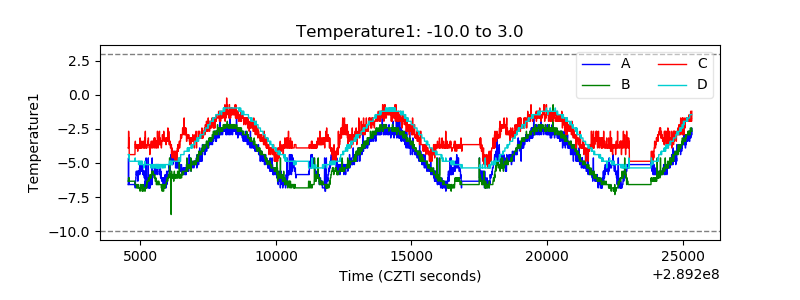 |
| Veto HV Monitor | 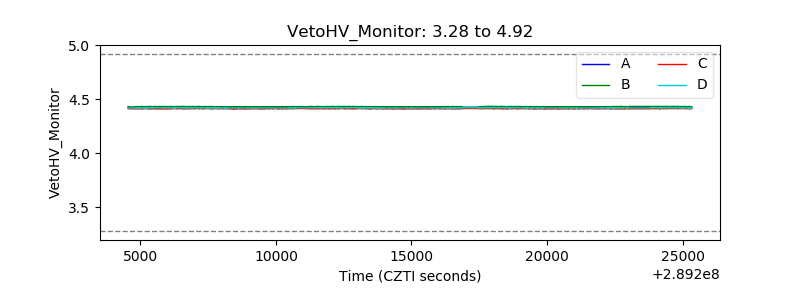 |
| Veto LLD | 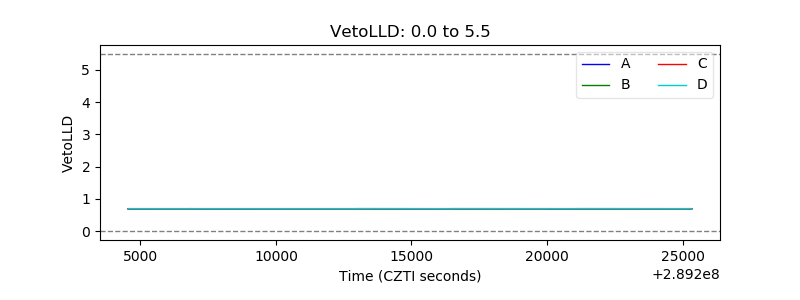 |
| Alpha Counter | 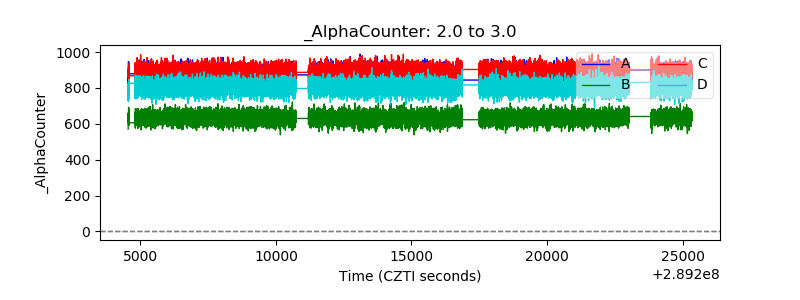 |
| _CPM_Rate | 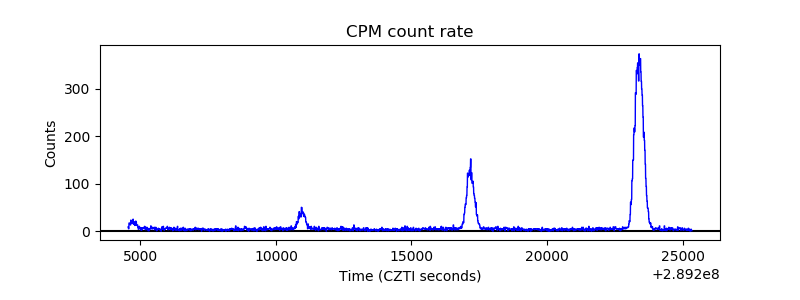 |
| CZT Counter | 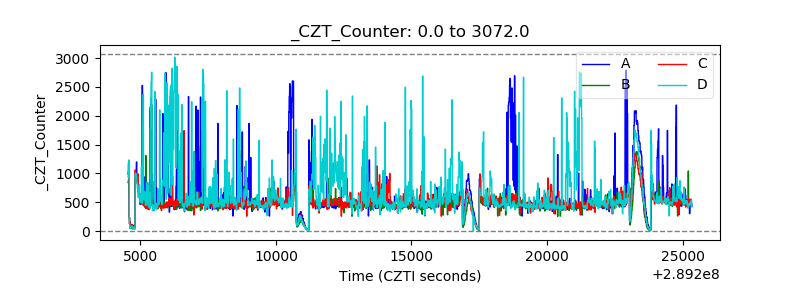 |
| +2.5 Volts monitor |  |
| +5 Volts monitor |  |
| _ROLL_ROT | 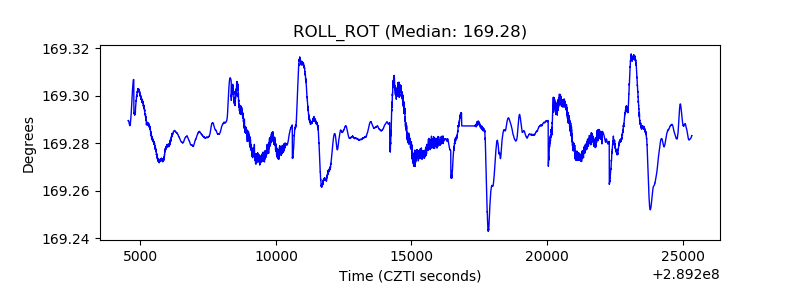 |
| _Roll_DEC | 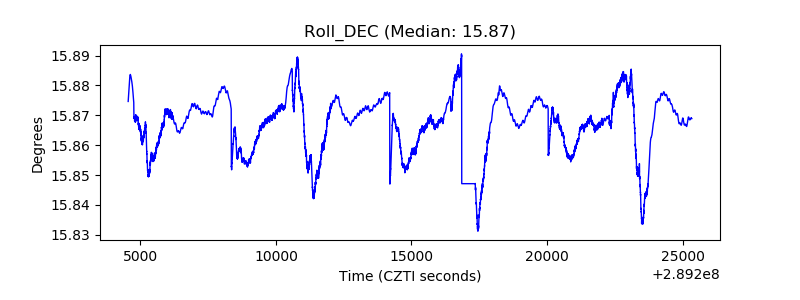 |
| _Roll_RA | 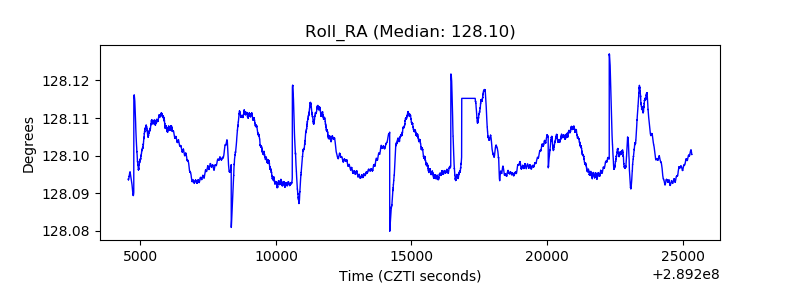 |
| Veto Counter | 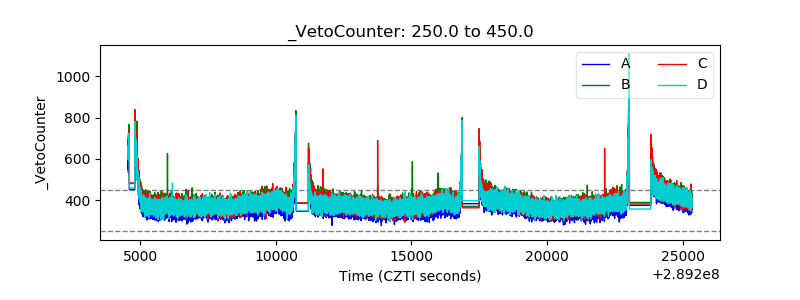 |