| Param | Original file | Final file |
|---|---|---|
| Filename | modeM0/AS1A05_187T03_9000002748_18524cztM0_level2.evt | modeM0/AS1A05_187T03_9000002748_18524cztM0_level2_quad_clean.evt |
| Size (bytes) | 510,413,760 | 103,507,200 |
| Size | 486.8 MB | 98.7 MB |
| Events in quadrant A | 3,527,330 | 689,484 |
| Events in quadrant B | 3,388,756 | 696,310 |
| Events in quadrant C | 3,168,669 | 658,609 |
| Events in quadrant D | 4,932,764 | 637,600 |
| Mode M0 | |||
|---|---|---|---|
| Quadrant | BADHDUFLAG | Total packets | Discarded packets |
| A | 0 | 14860 | 1 |
| B | 0 | 14294 | 5 |
| C | 0 | 13589 | 1 |
| D | 0 | 19018 | 1 |
| Mode SS | |||
|---|---|---|---|
| Quadrant | BADHDUFLAG | Total packets | Discarded packets |
| A | 0 | 132 | 0 |
| B | 0 | 132 | 0 |
| C | 0 | 132 | 0 |
| D | 0 | 132 | 0 |
| Mode M9 | |||
|---|---|---|---|
| Quadrant | BADHDUFLAG | Total packets | Discarded packets |
| A | 0 | 11 | 0 |
| B | 0 | 11 | 0 |
| C | 0 | 11 | 0 |
| D | 0 | 11 | 0 |
| Quadrant | Total seconds | Saturated seconds | Saturation percentage |
|---|---|---|---|
| A | 6489 | 118 | 1.818462% |
| B | 6488 | 116 | 1.787916% |
| C | 6488 | 87 | 1.340937% |
| D | 6488 | 415 | 6.396424% |
Noise dominated data is calculated using 1-second bins in cleaned event files. If a bin has >2000 counts, and if more than 50% of those come from <1% of pixels, then it is considered to be noise-dominated and hence unusable.
| Quadrant | # 1 sec bins | Bins with >0 counts | Bins with >2000 counts | High rate bins dominated by noise | Noise dominated (total time) | Noise dominated (detector-on time) | Marked lightcurve |
|---|---|---|---|---|---|---|---|
| A | 7599 | 6489 | 30 | 30 | 0.39% | 0.46% | 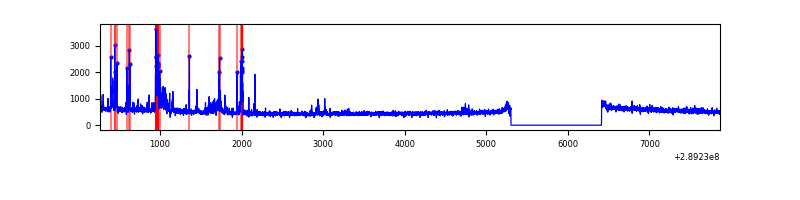 |
| B | 7597 | 6487 | 30 | 30 | 0.39% | 0.46% | 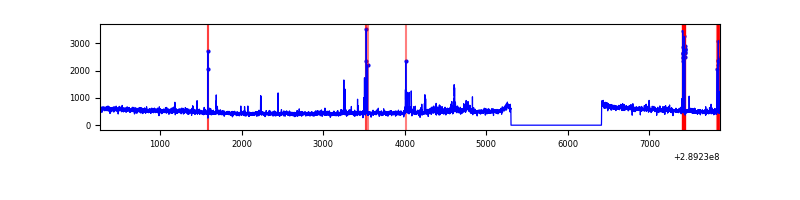 |
| C | 7598 | 6488 | 0 | 0 | 0.00% | 0.00% | 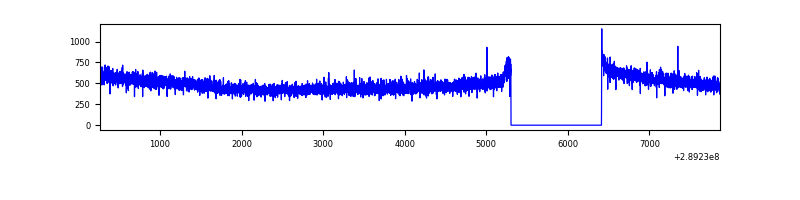 |
| D | 7598 | 6488 | 291 | 291 | 3.83% | 4.49% | 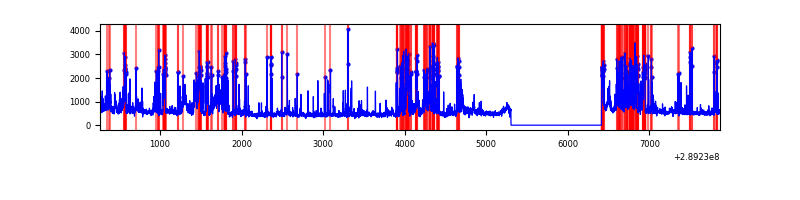 |
Top three noisy pixels from each quadrant. If the there are fewer than three noisy pixels in the level2.evt file, extra rows are filled as -1
| Pixel properties | Quadrant properties | ||||||
|---|---|---|---|---|---|---|---|
| Quadrant | DetID | PixID | Counts | Sigma | Mean | Median | Sigma |
| A | 0 | 13 | 273094 | 1646.12 | 827 | 811 | 165.4 |
| A | 15 | 174 | 34321 | 202.59 | 827 | 811 | 165.4 |
| A | 15 | 192 | 17738 | 102.33 | 827 | 811 | 165.4 |
| B | 15 | 222 | 77895 | 492.25 | 813 | 792 | 156.6 |
| B | 3 | 64 | 57544 | 362.32 | 813 | 792 | 156.6 |
| B | 10 | 247 | 28253 | 175.32 | 813 | 792 | 156.6 |
| C | 14 | 238 | 123275 | 668.95 | 781 | 789 | 183.1 |
| C | 13 | 61 | 5594 | 26.24 | 781 | 789 | 183.1 |
| C | 0 | 207 | 2385 | 8.72 | 781 | 789 | 183.1 |
| D | 7 | 238 | 1595390 | 8345.22 | 787 | 764 | 191.1 |
| D | 13 | 168 | 260021 | 1356.78 | 787 | 764 | 191.1 |
| D | 1 | 52 | 36406 | 186.52 | 787 | 764 | 191.1 |
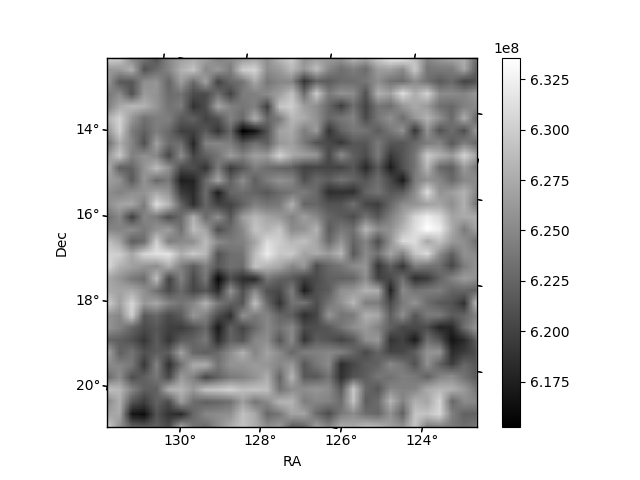
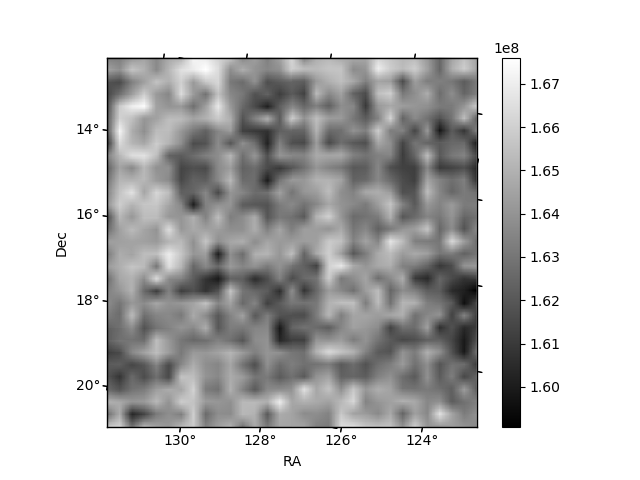
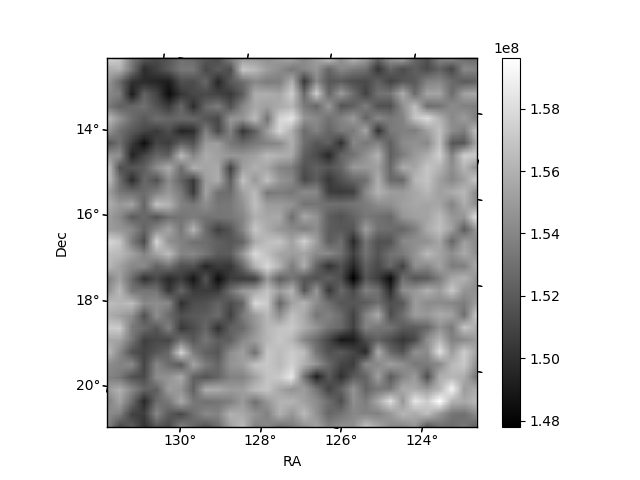
Histogram calculated using DETX and DETY for each event in the final _common_clean file
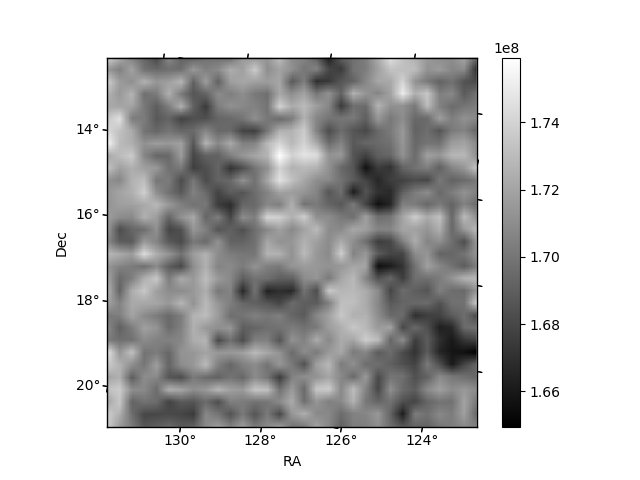
| Quadrant A | 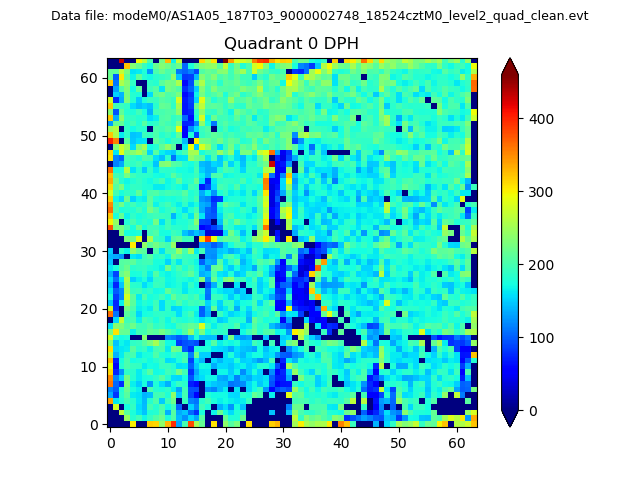 |
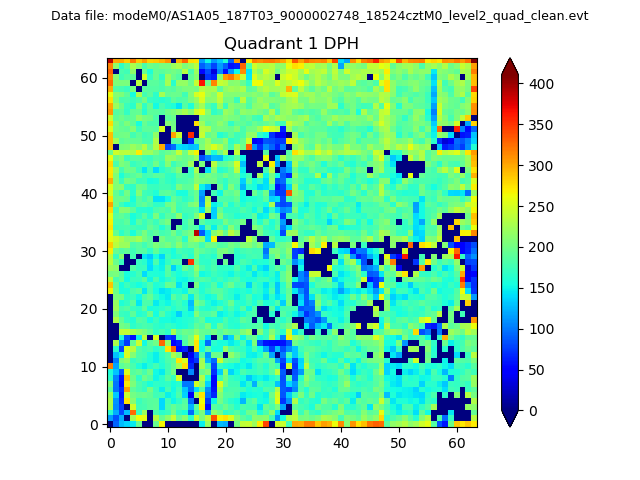 |
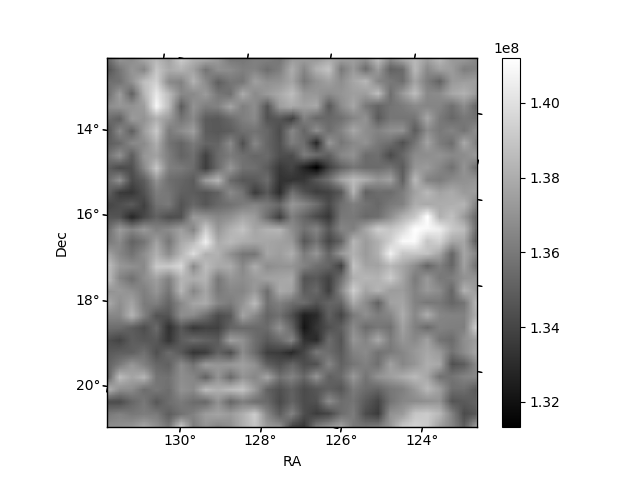
Quadrant B |
|---|---|---|---|
| Quadrant D |  |
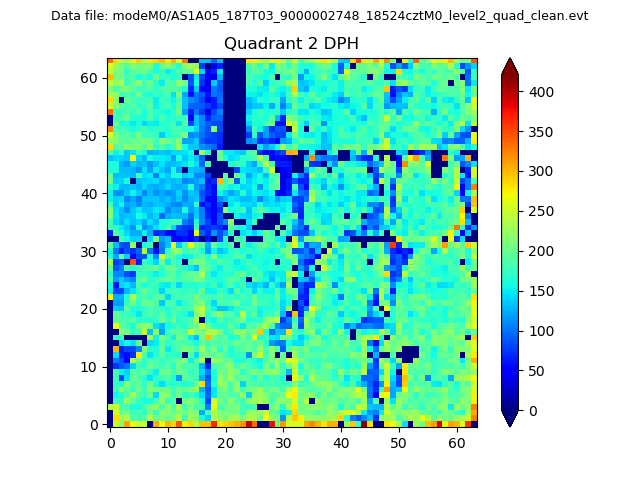 |
Quadrant C |
| Plot type | Count rate plots | Images |
|---|---|---|
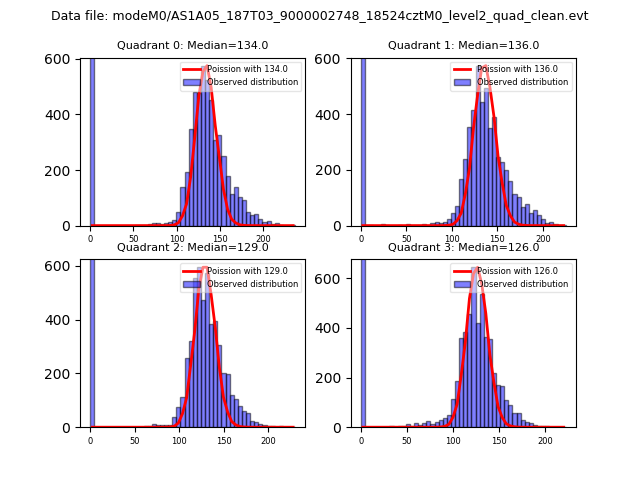
| Comparison with Poisson distribution Blue bars denote a histogram of data divided into 1 sec bins. Red curve is a Poisson curve with rate = median count rate of data. |
 |
 |
| Quadrant-wise count rates Data is divided into 100 sec bins |
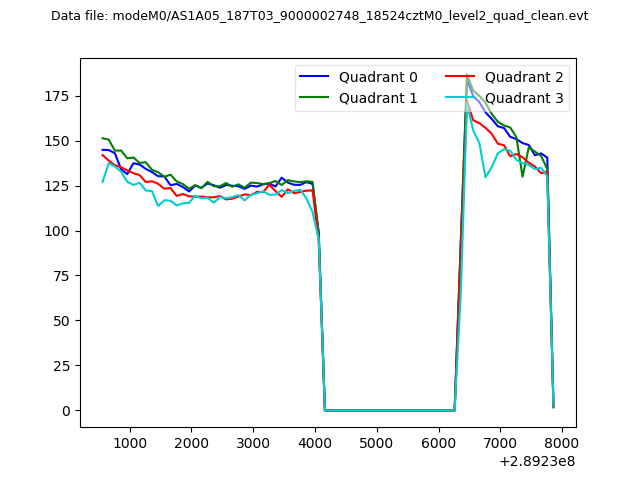 |
|
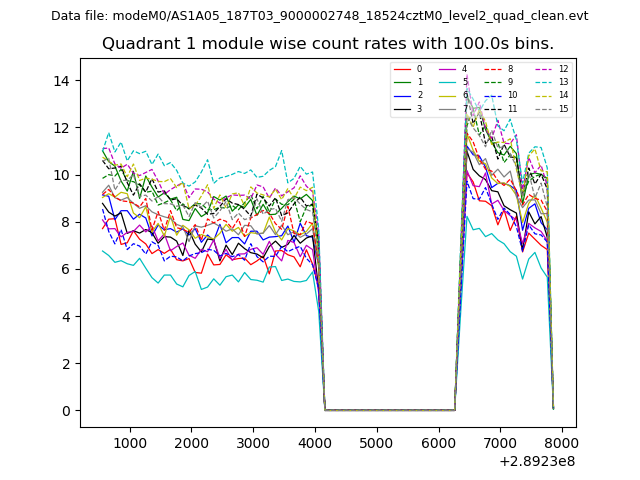
| Module-wise count rates for Quadrant A Data is divided into 100 sec bins |
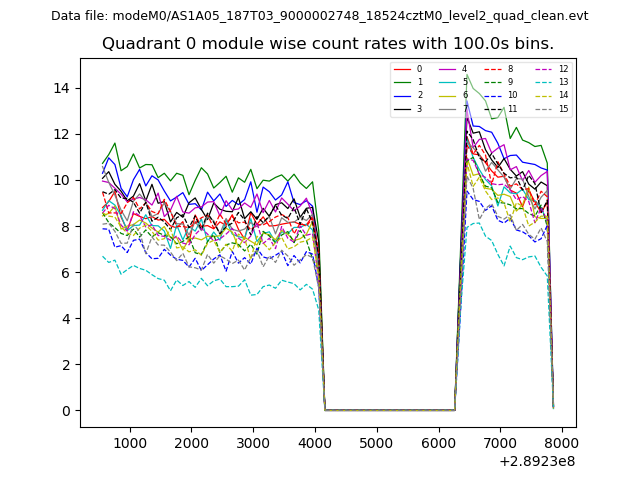 |
 |
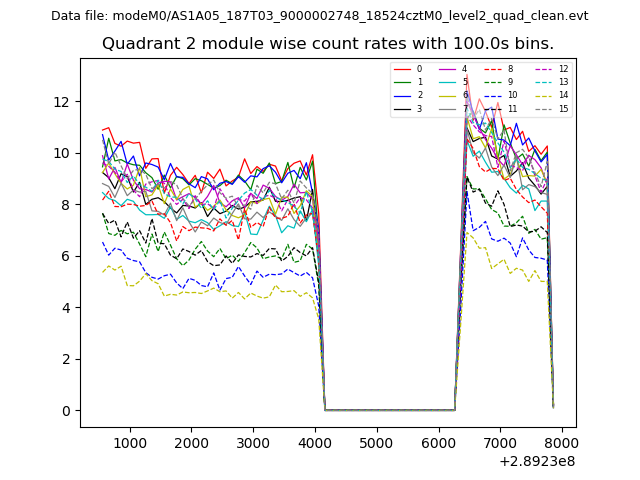
| Module-wise count rates for Quadrant B Data is divided into 100 sec bins |
 |
 |
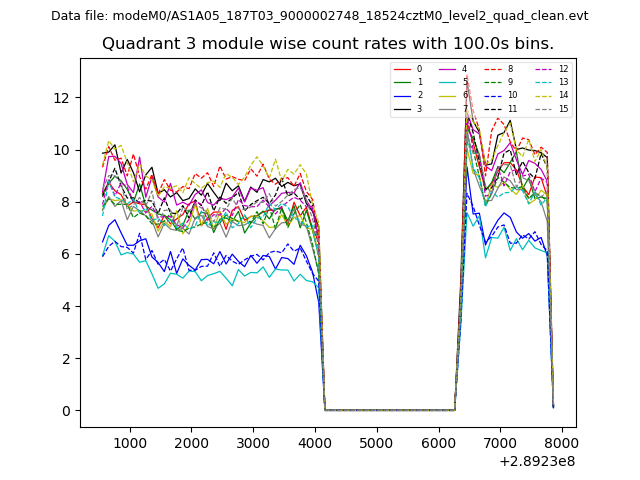
| Module-wise count rates for Quadrant C Data is divided into 100 sec bins |
 |
 |
| Module-wise count rates for Quadrant D Data is divided into 100 sec bins |
 |
 |
| Parameter | Plot |
|---|---|
| CZT HV Monitor | 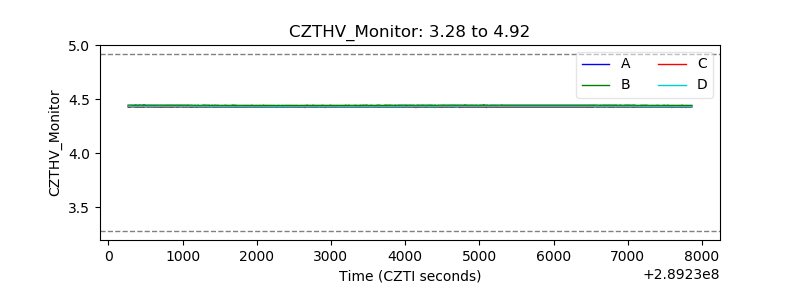 |
| D_VDD | 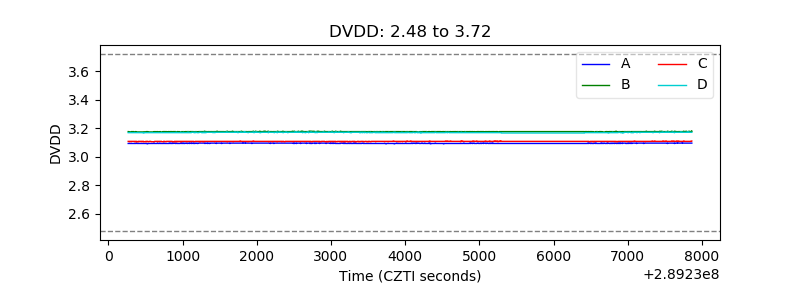 |
| Temperature 1 |  |
| Veto HV Monitor | 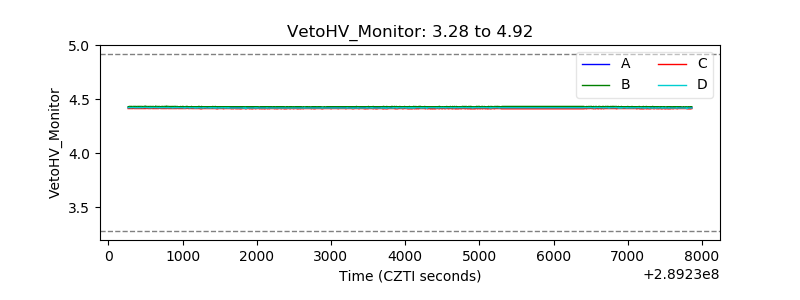 |
| Veto LLD | 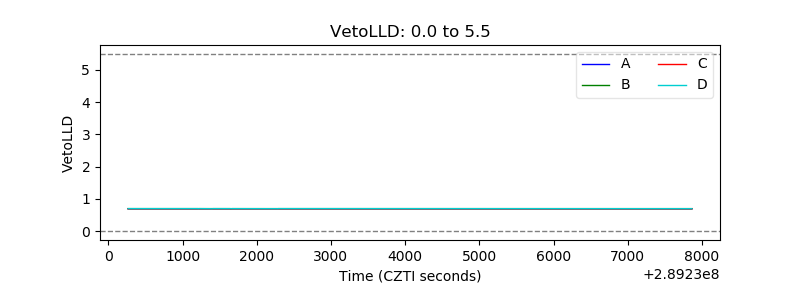 |
| Alpha Counter | 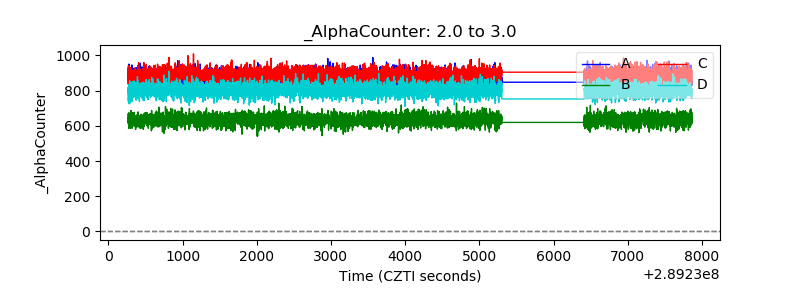 |
| _CPM_Rate | 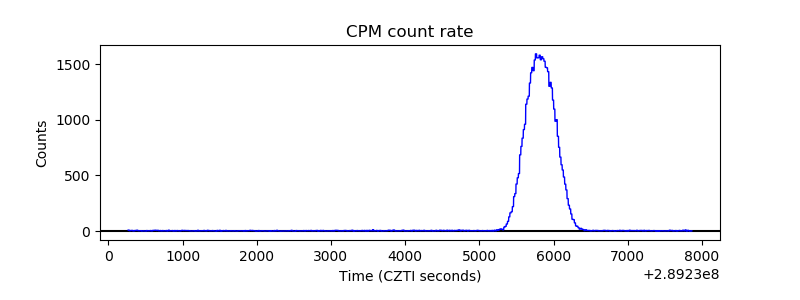 |
| CZT Counter | 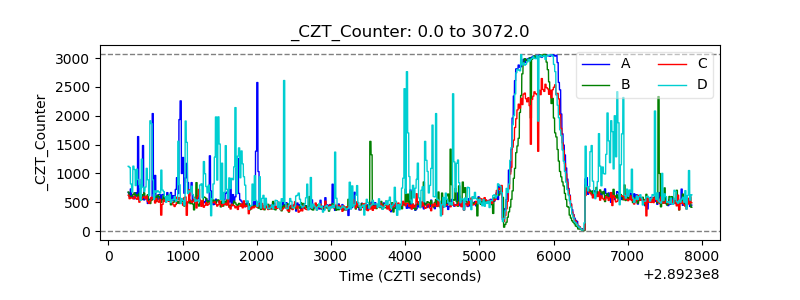 |
| +2.5 Volts monitor |  |
| +5 Volts monitor | 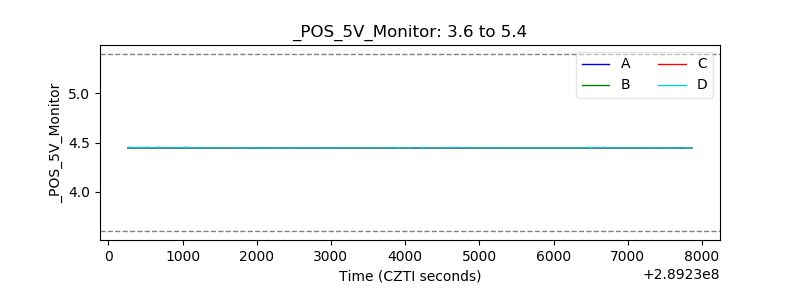 |
| _ROLL_ROT | 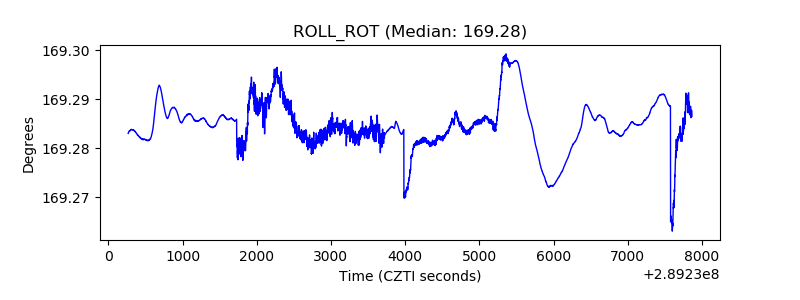 |
| _Roll_DEC | 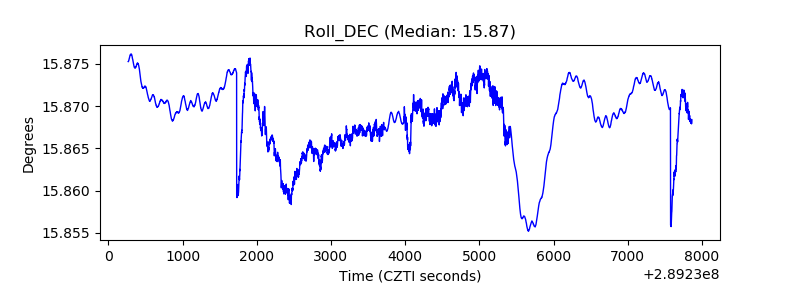 |
| _Roll_RA | 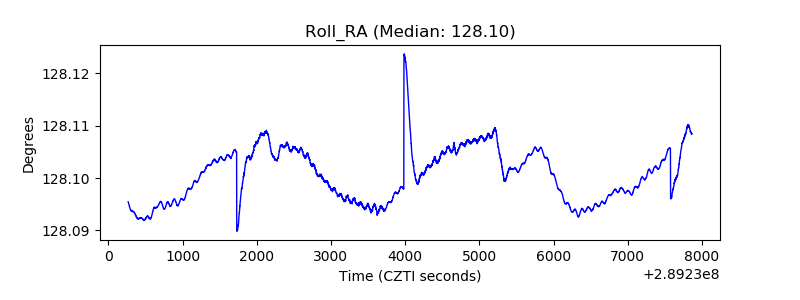 |
| Veto Counter | 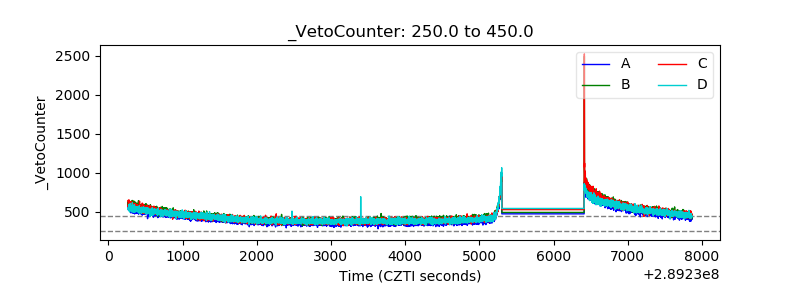 |