| Param | Original file | Final file |
|---|---|---|
| Filename | modeM0/AS1A05_187T03_9000002748_18525cztM0_level2.evt | modeM0/AS1A05_187T03_9000002748_18525cztM0_level2_quad_clean.evt |
| Size (bytes) | 485,524,800 | 110,727,360 |
| Size | 463.0 MB | 105.6 MB |
| Events in quadrant A | 3,385,281 | 748,327 |
| Events in quadrant B | 3,512,046 | 752,257 |
| Events in quadrant C | 3,339,728 | 707,647 |
| Events in quadrant D | 4,027,215 | 693,494 |
| Mode M0 | |||
|---|---|---|---|
| Quadrant | BADHDUFLAG | Total packets | Discarded packets |
| A | 0 | 14333 | 2 |
| B | 0 | 14688 | 2 |
| C | 0 | 14121 | 2 |
| D | 0 | 16352 | 2 |
| Mode SS | |||
|---|---|---|---|
| Quadrant | BADHDUFLAG | Total packets | Discarded packets |
| A | 0 | 134 | 0 |
| B | 0 | 134 | 0 |
| C | 0 | 134 | 0 |
| D | 0 | 134 | 0 |
| Mode M9 | |||
|---|---|---|---|
| Quadrant | BADHDUFLAG | Total packets | Discarded packets |
| A | 0 | 23 | 0 |
| B | 0 | 23 | 0 |
| C | 0 | 23 | 0 |
| D | 0 | 23 | 0 |
| Quadrant | Total seconds | Saturated seconds | Saturation percentage |
|---|---|---|---|
| A | 6475 | 113 | 1.745174% |
| B | 6475 | 156 | 2.409266% |
| C | 6475 | 133 | 2.054054% |
| D | 6475 | 264 | 4.077220% |
Noise dominated data is calculated using 1-second bins in cleaned event files. If a bin has >2000 counts, and if more than 50% of those come from <1% of pixels, then it is considered to be noise-dominated and hence unusable.
| Quadrant | # 1 sec bins | Bins with >0 counts | Bins with >2000 counts | High rate bins dominated by noise | Noise dominated (total time) | Noise dominated (detector-on time) | Marked lightcurve |
|---|---|---|---|---|---|---|---|
| A | 8800 | 6475 | 6 | 6 | 0.07% | 0.09% | 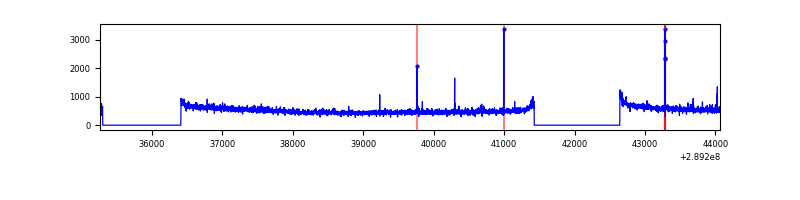 |
| B | 8800 | 6475 | 39 | 39 | 0.44% | 0.60% | 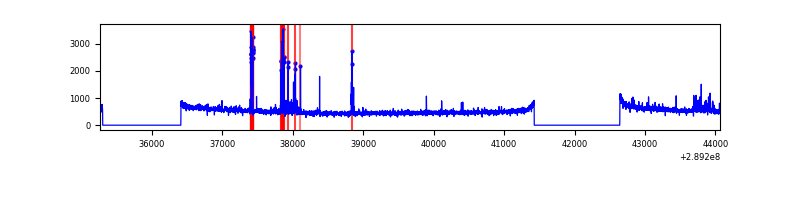 |
| C | 8800 | 6475 | 0 | 0 | 0.00% | 0.00% | 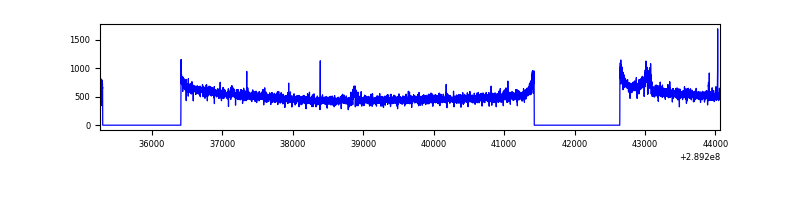 |
| D | 8800 | 6475 | 141 | 141 | 1.60% | 2.18% | 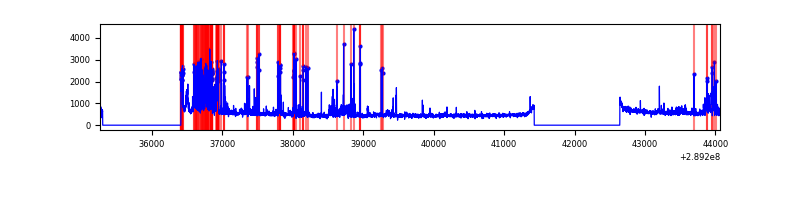 |
Top three noisy pixels from each quadrant. If the there are fewer than three noisy pixels in the level2.evt file, extra rows are filled as -1
| Pixel properties | Quadrant properties | ||||||
|---|---|---|---|---|---|---|---|
| Quadrant | DetID | PixID | Counts | Sigma | Mean | Median | Sigma |
| A | 15 | 192 | 25710 | 143.18 | 863 | 845 | 173.7 |
| A | 14 | 111 | 13427 | 72.45 | 863 | 845 | 173.7 |
| A | 9 | 143 | 11303 | 60.22 | 863 | 845 | 173.7 |
| B | 7 | 220 | 135764 | 843.25 | 845 | 826 | 160.0 |
| B | 3 | 64 | 55743 | 343.18 | 845 | 826 | 160.0 |
| B | 12 | 111 | 18467 | 110.24 | 845 | 826 | 160.0 |
| C | 14 | 238 | 127143 | 672.73 | 810 | 819 | 187.8 |
| C | 9 | 54 | 38538 | 200.87 | 810 | 819 | 187.8 |
| C | 0 | 207 | 9474 | 46.09 | 810 | 819 | 187.8 |
| D | 7 | 238 | 478503 | 2368.08 | 826 | 801 | 201.7 |
| D | 13 | 168 | 363795 | 1799.45 | 826 | 801 | 201.7 |
| D | 1 | 52 | 31978 | 154.55 | 826 | 801 | 201.7 |
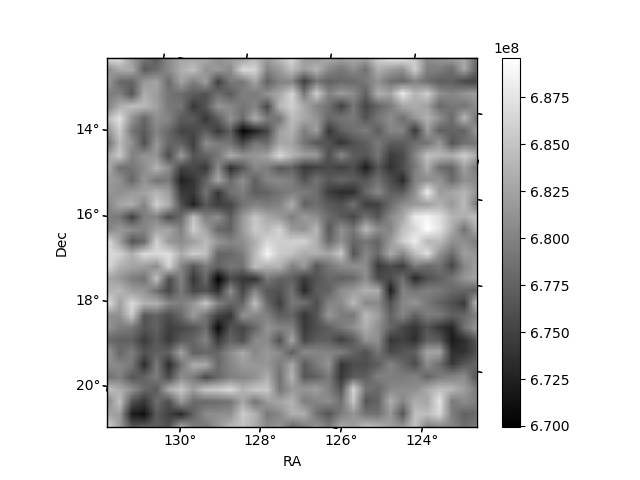
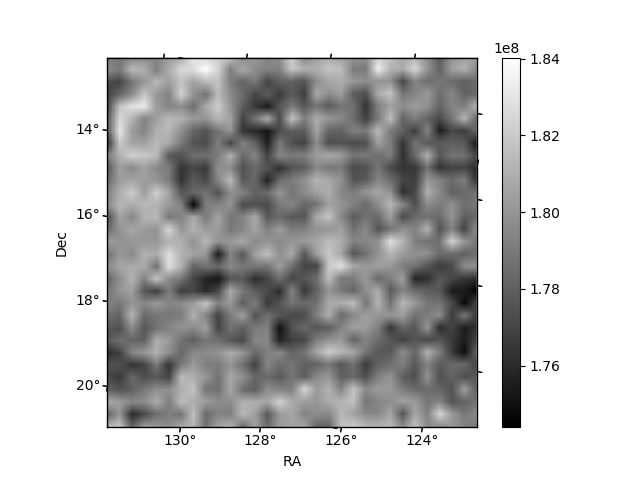
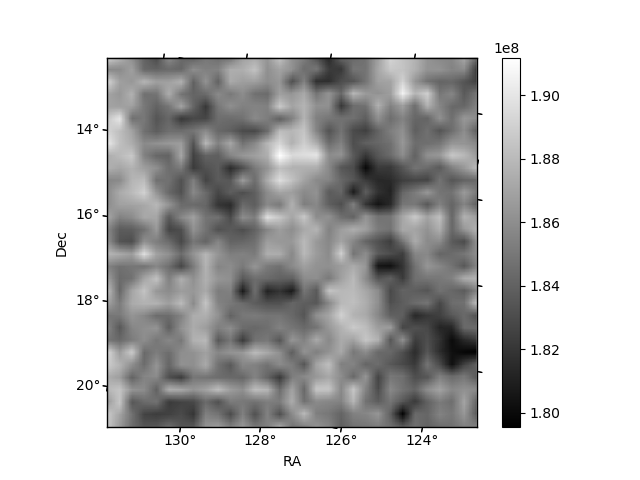
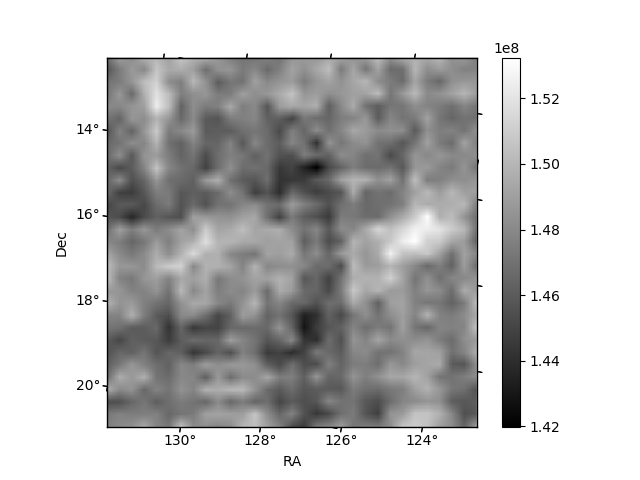
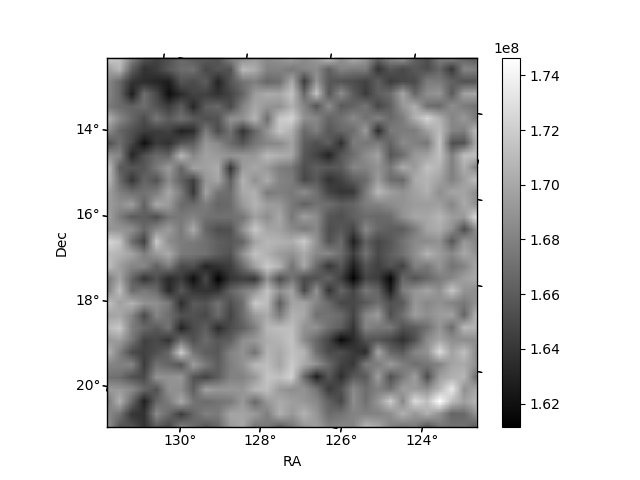
Histogram calculated using DETX and DETY for each event in the final _common_clean file
| Quadrant A | 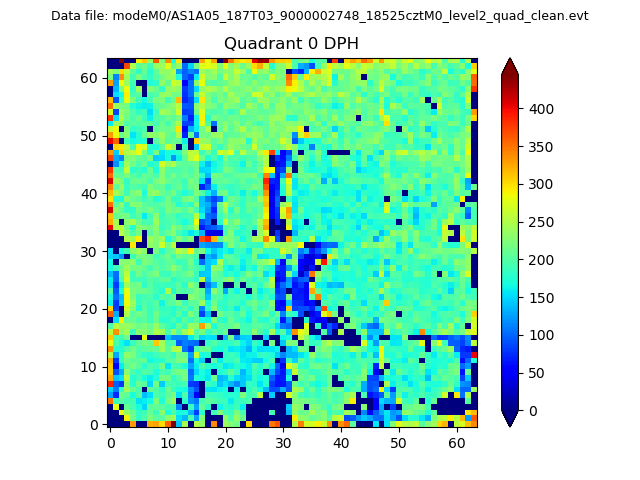 |
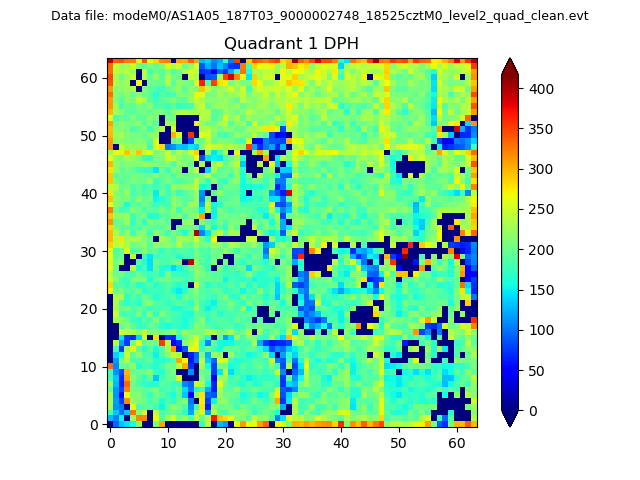 |
Quadrant B |
|---|---|---|---|
| Quadrant D |  |
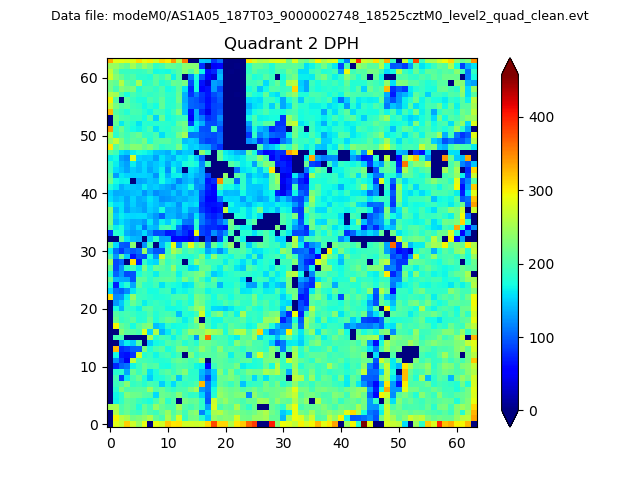 |
Quadrant C |
| Plot type | Count rate plots | Images |
|---|---|---|
| Comparison with Poisson distribution Blue bars denote a histogram of data divided into 1 sec bins. Red curve is a Poisson curve with rate = median count rate of data. |
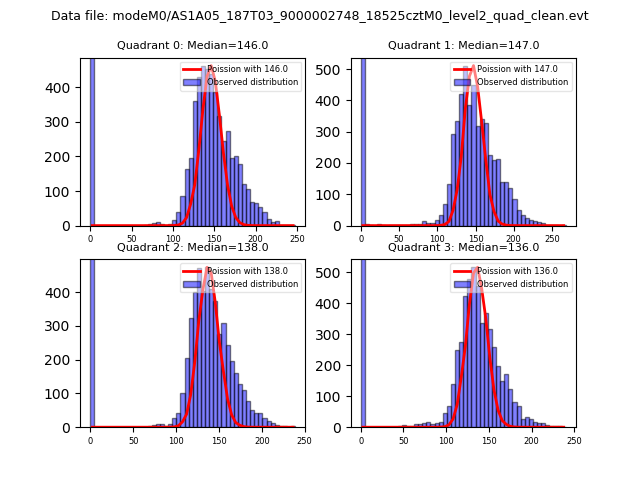 |
 |
| Quadrant-wise count rates Data is divided into 100 sec bins |
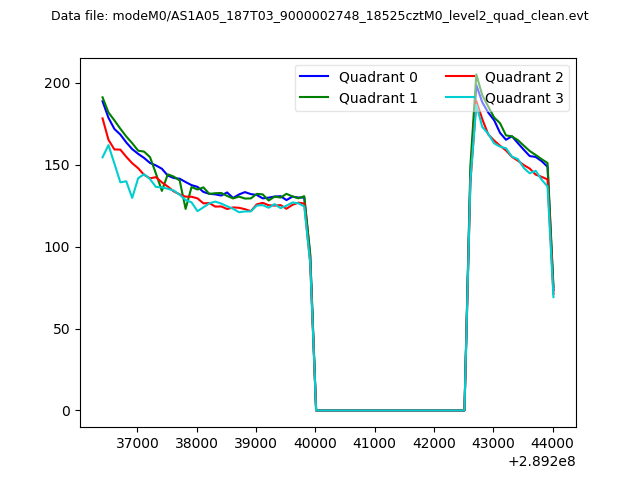 |
|
| Module-wise count rates for Quadrant A Data is divided into 100 sec bins |
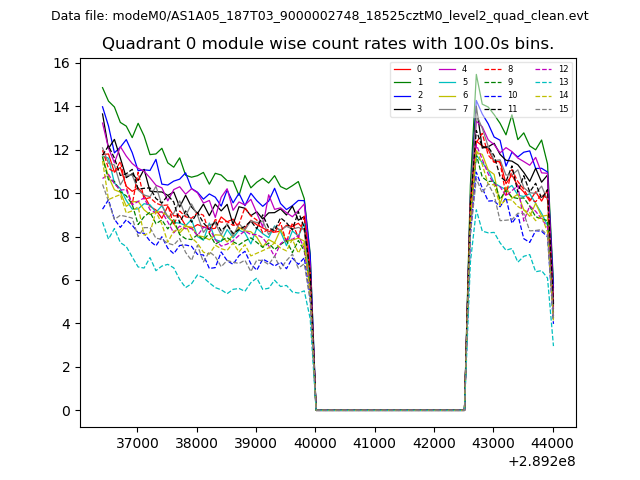 |
 |
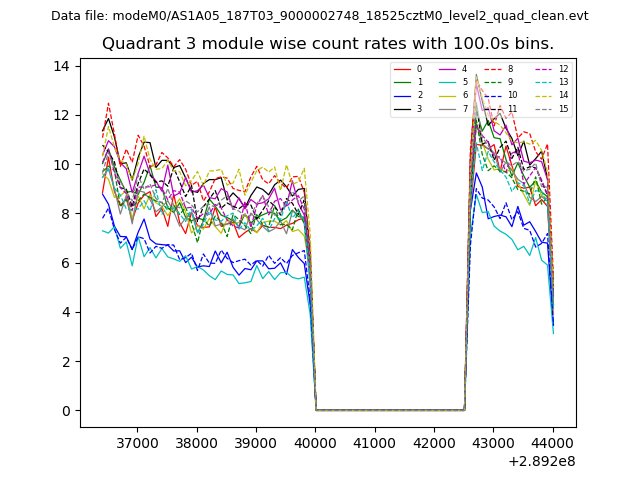
| Module-wise count rates for Quadrant B Data is divided into 100 sec bins |
 |
 |
| Module-wise count rates for Quadrant C Data is divided into 100 sec bins |
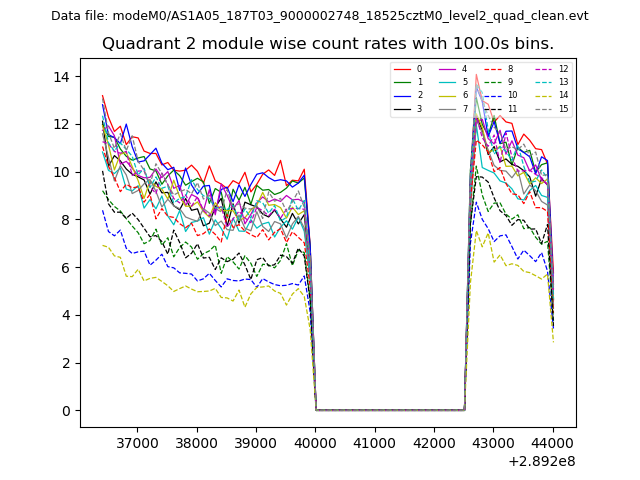 |
 |
| Module-wise count rates for Quadrant D Data is divided into 100 sec bins |
 |
 |
| Parameter | Plot |
|---|---|
| CZT HV Monitor | 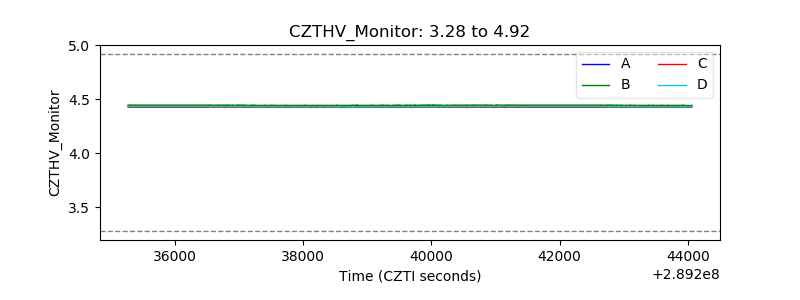 |
| D_VDD | 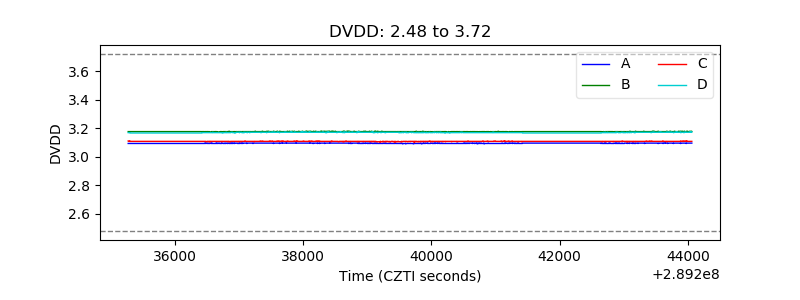 |
| Temperature 1 | 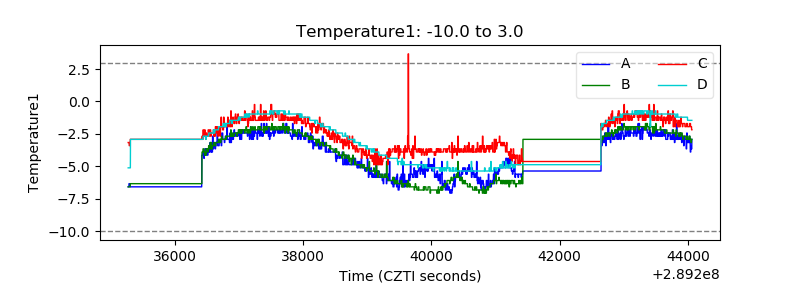 |
| Veto HV Monitor | 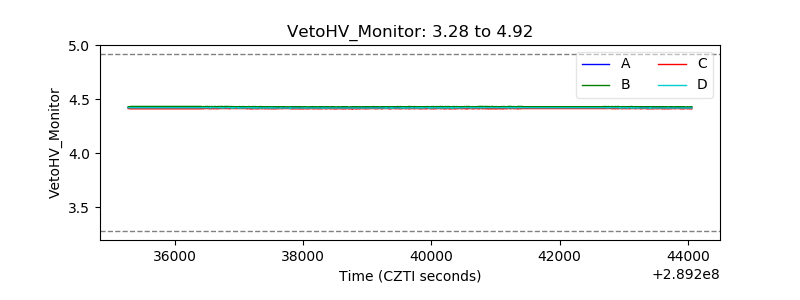 |
| Veto LLD | 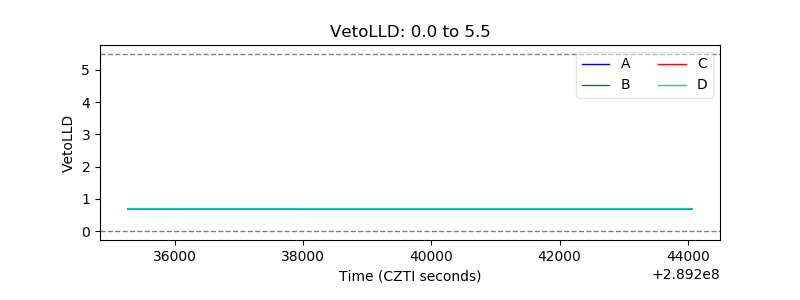 |
| Alpha Counter | 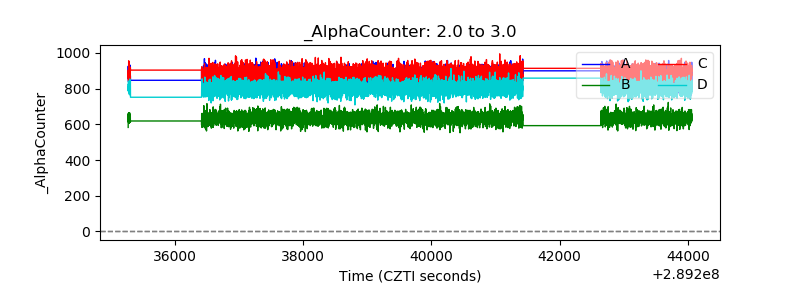 |
| _CPM_Rate | 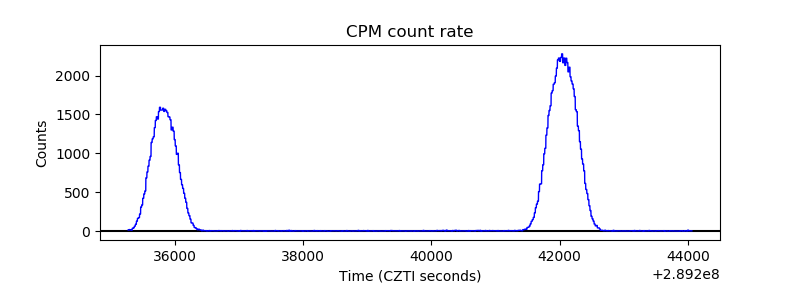 |
| CZT Counter | 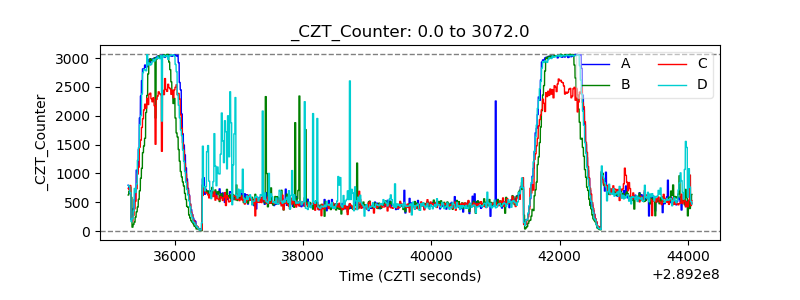 |
| +2.5 Volts monitor |  |
| +5 Volts monitor |  |
| _ROLL_ROT | 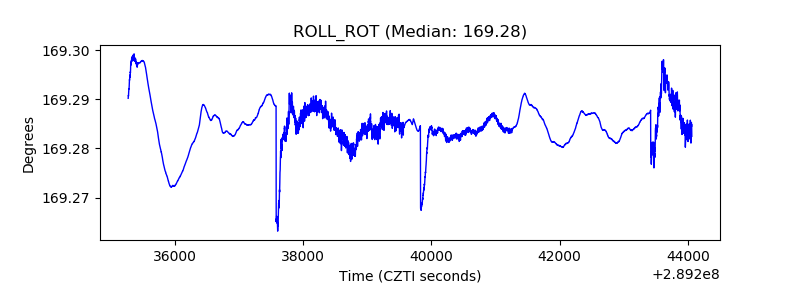 |
| _Roll_DEC | 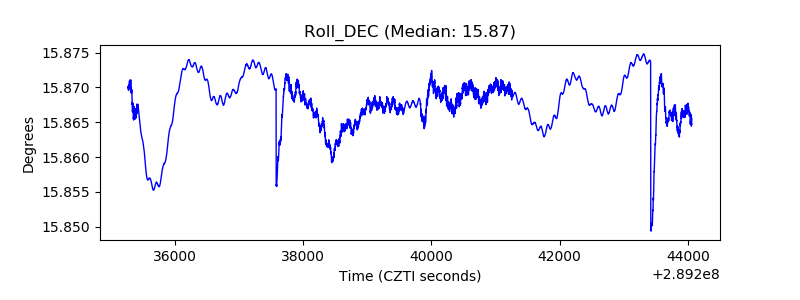 |
| _Roll_RA | 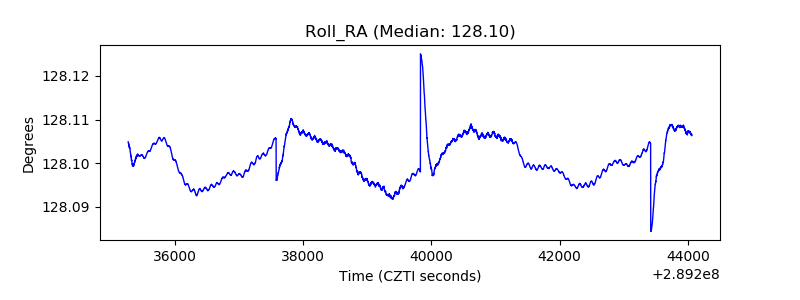 |
| Veto Counter | 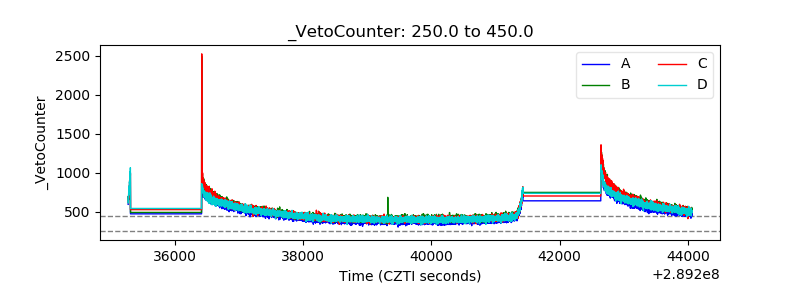 |