| Param | Original file | Final file |
|---|---|---|
| Filename | modeM0/AS1A05_187T03_9000002748_18526cztM0_level2.evt | modeM0/AS1A05_187T03_9000002748_18526cztM0_level2_quad_clean.evt |
| Size (bytes) | 488,194,560 | 104,771,520 |
| Size | 465.6 MB | 99.9 MB |
| Events in quadrant A | 3,404,159 | 705,477 |
| Events in quadrant B | 3,365,522 | 713,576 |
| Events in quadrant C | 3,382,220 | 665,863 |
| Events in quadrant D | 4,205,615 | 648,441 |
| Mode M0 | |||
|---|---|---|---|
| Quadrant | BADHDUFLAG | Total packets | Discarded packets |
| A | 0 | 14089 | 1 |
| B | 0 | 13984 | 2 |
| C | 0 | 14054 | 1 |
| D | 0 | 16831 | 1 |
| Mode SS | |||
|---|---|---|---|
| Quadrant | BADHDUFLAG | Total packets | Discarded packets |
| A | 0 | 128 | 0 |
| B | 0 | 128 | 0 |
| C | 0 | 128 | 0 |
| D | 0 | 128 | 0 |
| Mode M9 | |||
|---|---|---|---|
| Quadrant | BADHDUFLAG | Total packets | Discarded packets |
| A | 0 | 13 | 0 |
| B | 0 | 13 | 0 |
| C | 0 | 13 | 0 |
| D | 0 | 13 | 0 |
| Quadrant | Total seconds | Saturated seconds | Saturation percentage |
|---|---|---|---|
| A | 6300 | 91 | 1.444444% |
| B | 6300 | 78 | 1.238095% |
| C | 6300 | 105 | 1.666667% |
| D | 6300 | 236 | 3.746032% |
Noise dominated data is calculated using 1-second bins in cleaned event files. If a bin has >2000 counts, and if more than 50% of those come from <1% of pixels, then it is considered to be noise-dominated and hence unusable.
| Quadrant | # 1 sec bins | Bins with >0 counts | Bins with >2000 counts | High rate bins dominated by noise | Noise dominated (total time) | Noise dominated (detector-on time) | Marked lightcurve |
|---|---|---|---|---|---|---|---|
| A | 7600 | 6300 | 13 | 13 | 0.17% | 0.21% | 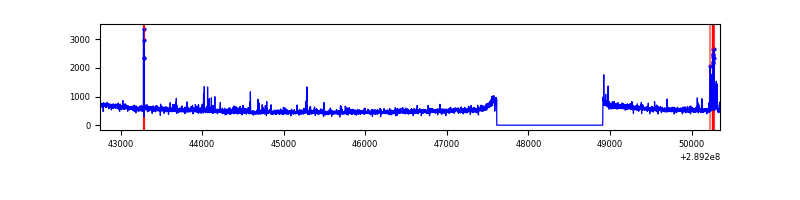 |
| B | 7600 | 6300 | 1 | 1 | 0.01% | 0.02% | 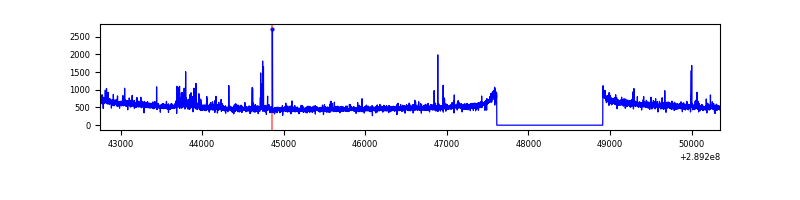 |
| C | 7600 | 6300 | 3 | 3 | 0.04% | 0.05% | 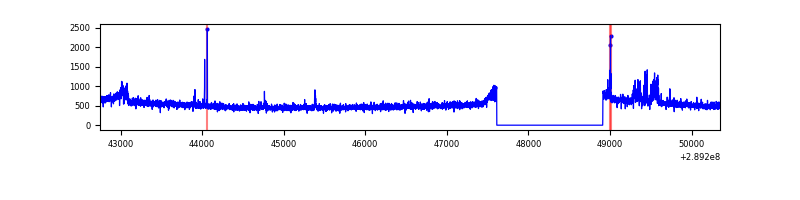 |
| D | 7600 | 6300 | 169 | 169 | 2.22% | 2.68% | 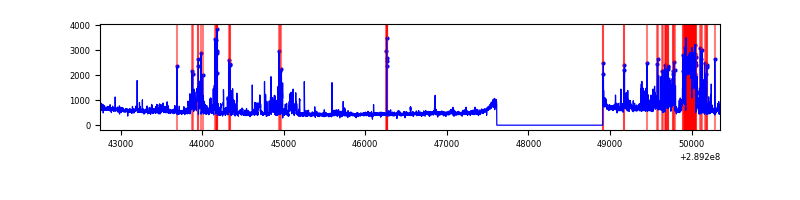 |
Top three noisy pixels from each quadrant. If the there are fewer than three noisy pixels in the level2.evt file, extra rows are filled as -1
| Pixel properties | Quadrant properties | ||||||
|---|---|---|---|---|---|---|---|
| Quadrant | DetID | PixID | Counts | Sigma | Mean | Median | Sigma |
| A | 0 | 13 | 80677 | 472.42 | 845 | 830 | 169.0 |
| A | 15 | 192 | 32402 | 186.8 | 845 | 830 | 169.0 |
| A | 14 | 111 | 19382 | 109.76 | 845 | 830 | 169.0 |
| B | 7 | 220 | 43930 | 276.93 | 835 | 817 | 155.7 |
| B | 4 | 171 | 17860 | 109.47 | 835 | 817 | 155.7 |
| B | 12 | 111 | 17611 | 107.87 | 835 | 817 | 155.7 |
| C | 14 | 238 | 125245 | 675.47 | 798 | 804 | 184.2 |
| C | 3 | 233 | 78788 | 423.3 | 798 | 804 | 184.2 |
| C | 9 | 54 | 44567 | 237.54 | 798 | 804 | 184.2 |
| D | 13 | 168 | 525479 | 2686.16 | 811 | 791 | 195.3 |
| D | 7 | 238 | 472513 | 2414.99 | 811 | 791 | 195.3 |
| D | 1 | 52 | 78408 | 397.36 | 811 | 791 | 195.3 |
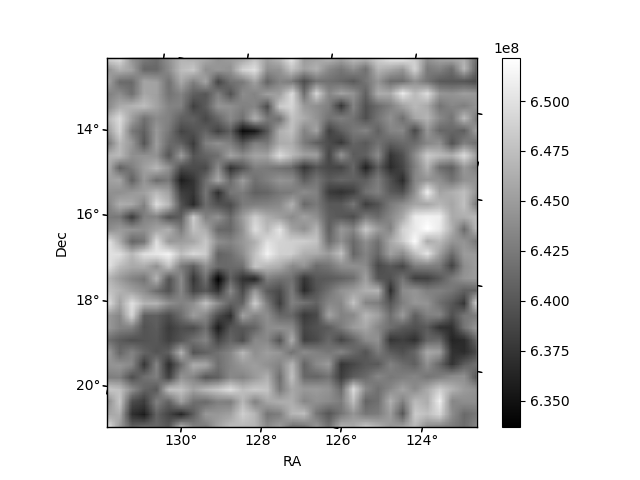
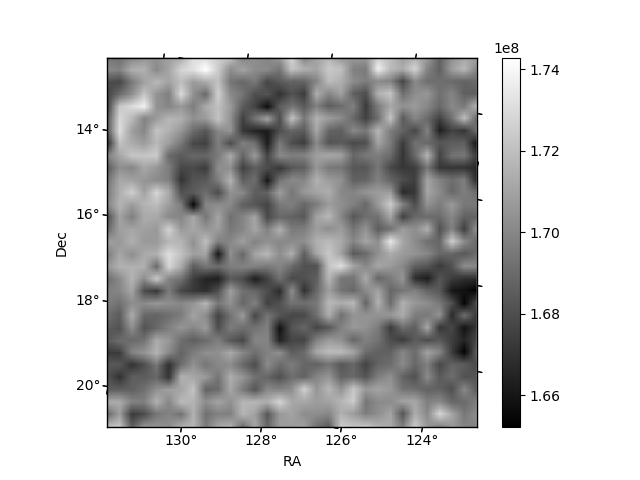
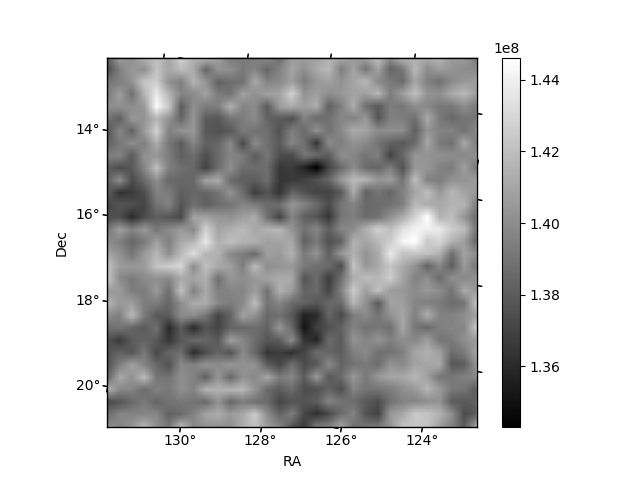
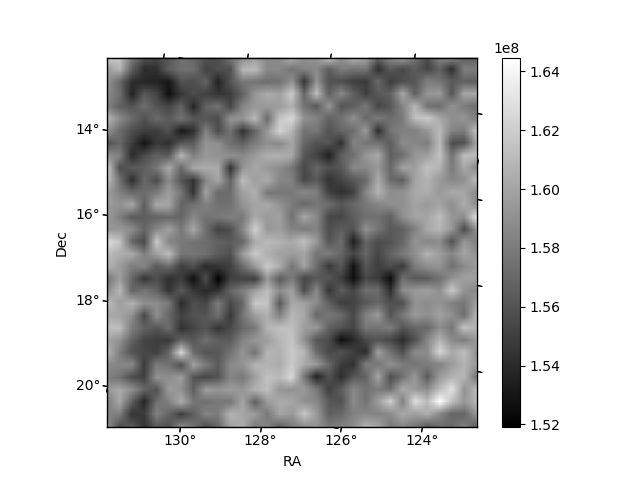
Histogram calculated using DETX and DETY for each event in the final _common_clean file
| Quadrant A | 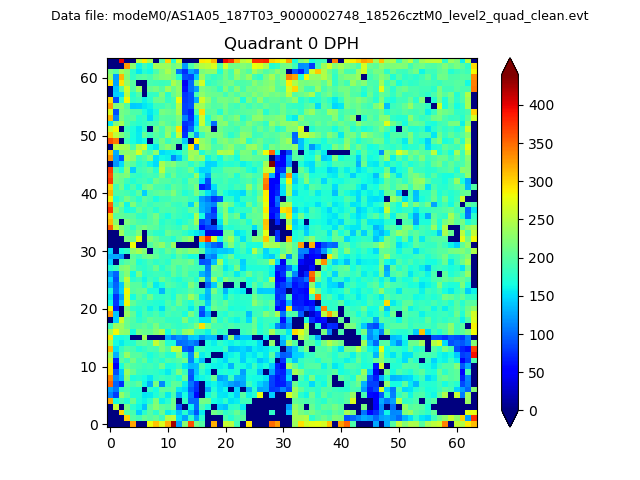 |
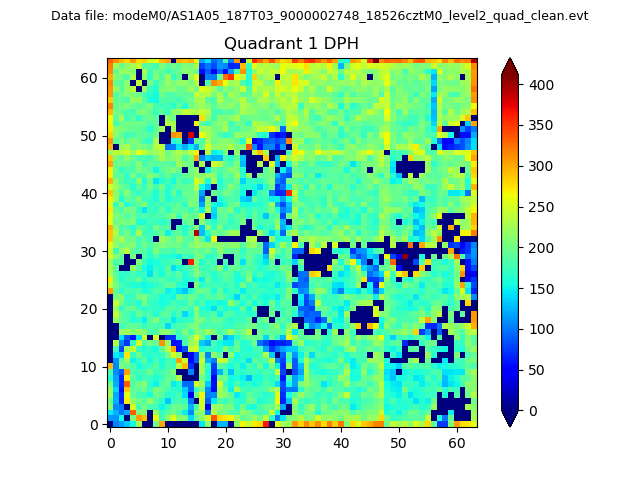 |
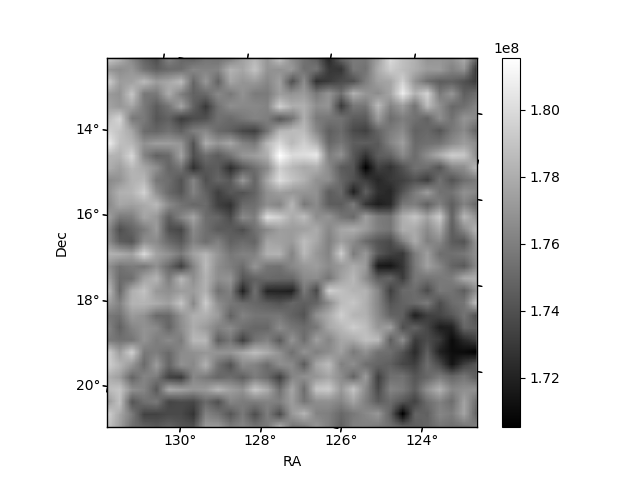
Quadrant B |
|---|---|---|---|
| Quadrant D | 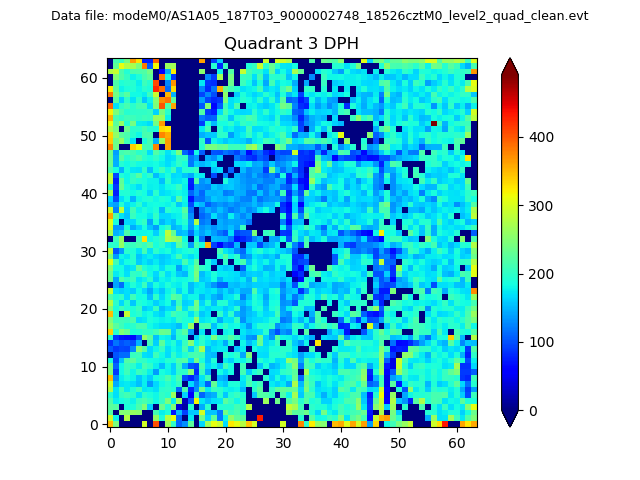 |
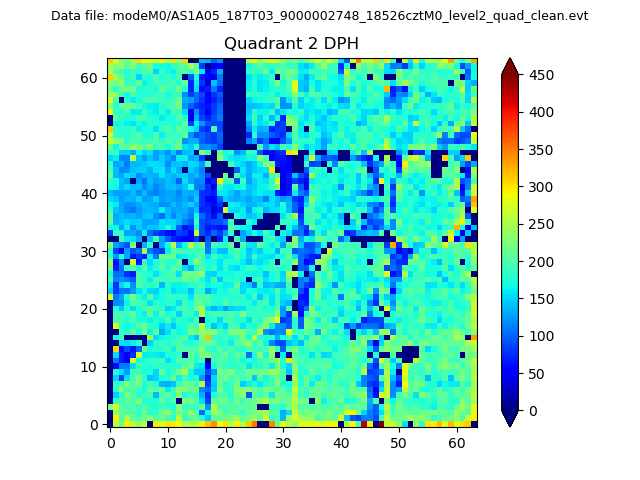 |
Quadrant C |
| Plot type | Count rate plots | Images |
|---|---|---|
| Comparison with Poisson distribution Blue bars denote a histogram of data divided into 1 sec bins. Red curve is a Poisson curve with rate = median count rate of data. |
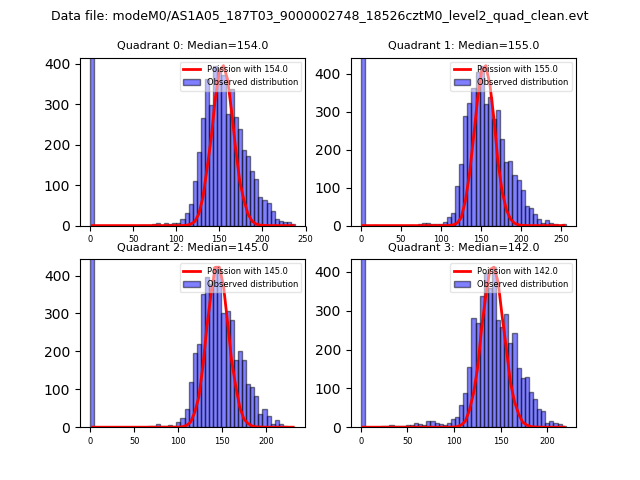 |
 |
| Quadrant-wise count rates Data is divided into 100 sec bins |
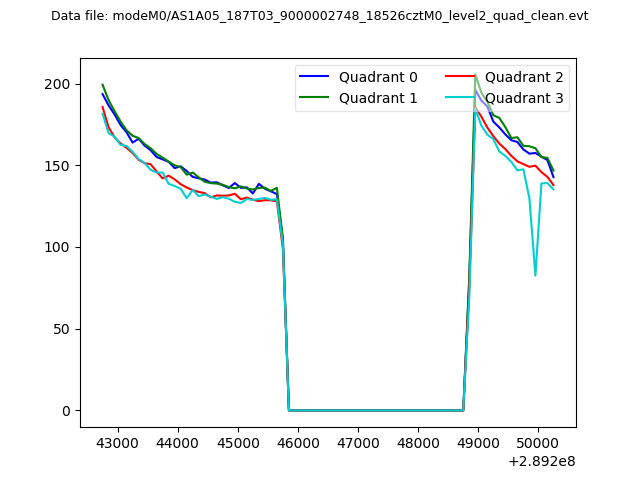 |
|
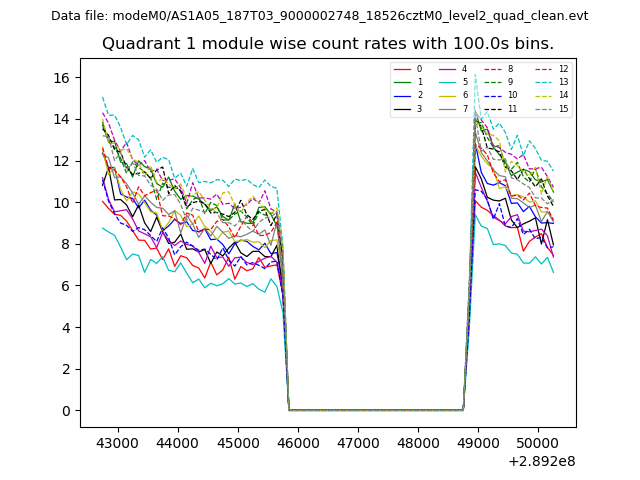
| Module-wise count rates for Quadrant A Data is divided into 100 sec bins |
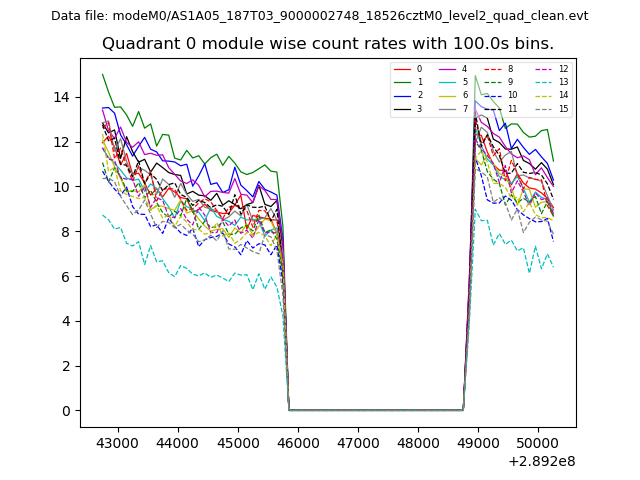 |
 |
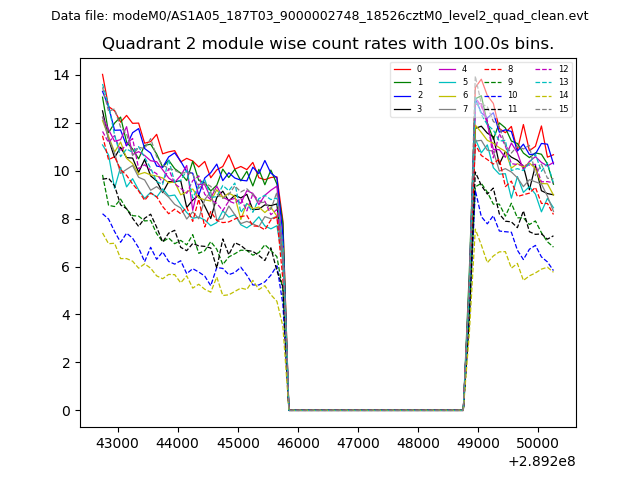
| Module-wise count rates for Quadrant B Data is divided into 100 sec bins |
 |
 |
| Module-wise count rates for Quadrant C Data is divided into 100 sec bins |
 |
 |
| Module-wise count rates for Quadrant D Data is divided into 100 sec bins |
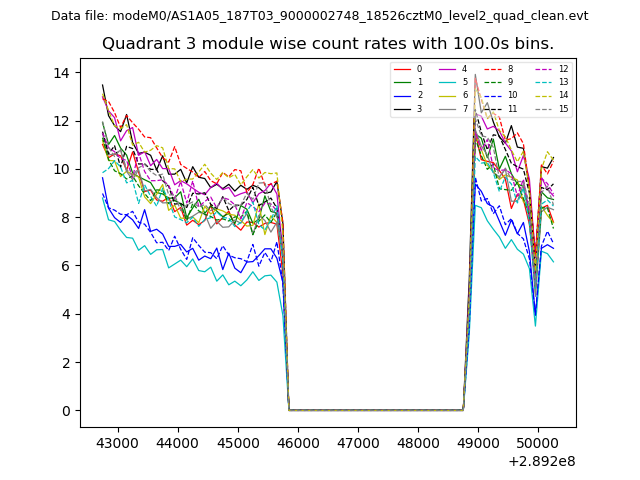 |
 |
| Parameter | Plot |
|---|---|
| CZT HV Monitor | 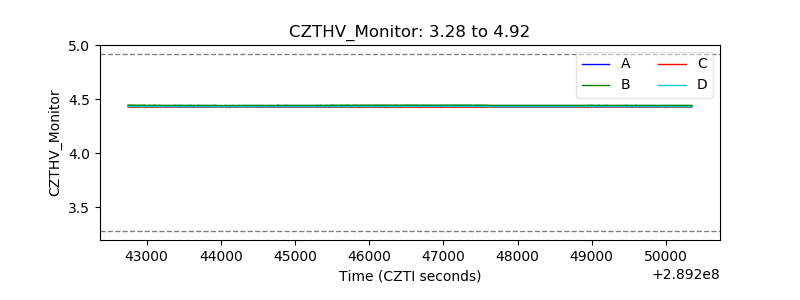 |
| D_VDD | 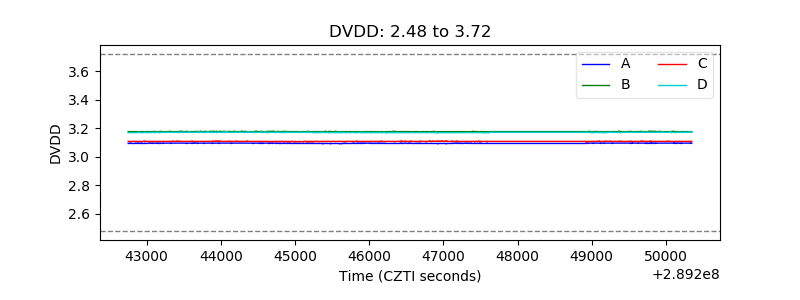 |
| Temperature 1 | 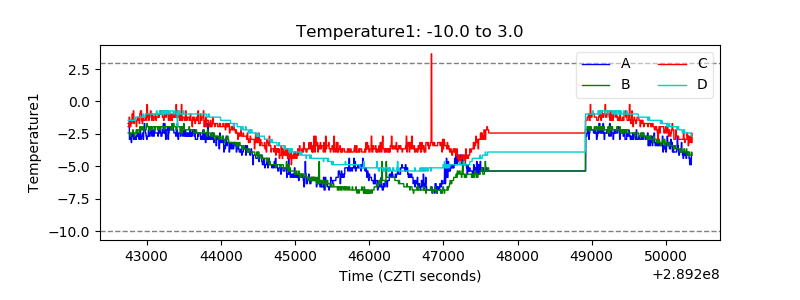 |
| Veto HV Monitor | 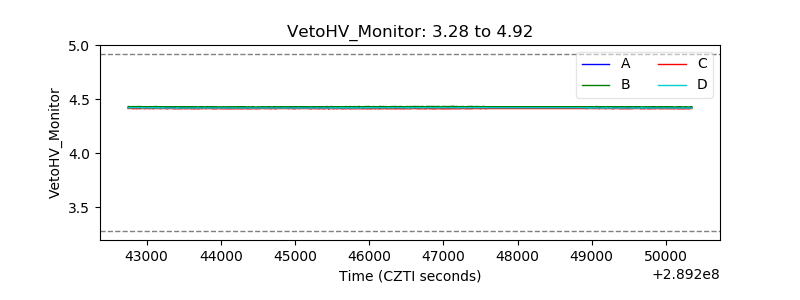 |
| Veto LLD | 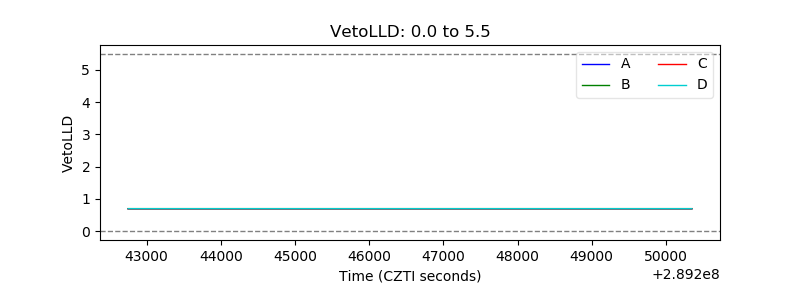 |
| Alpha Counter | 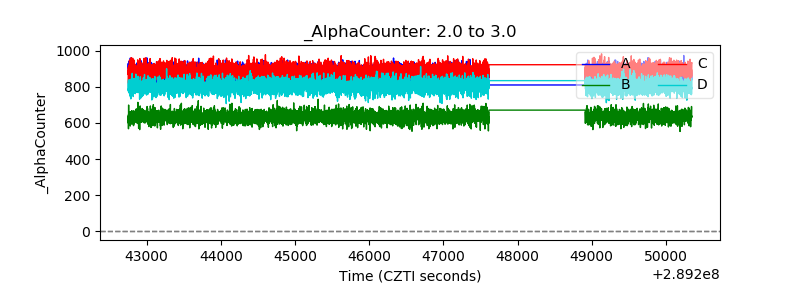 |
| _CPM_Rate |  |
| CZT Counter | 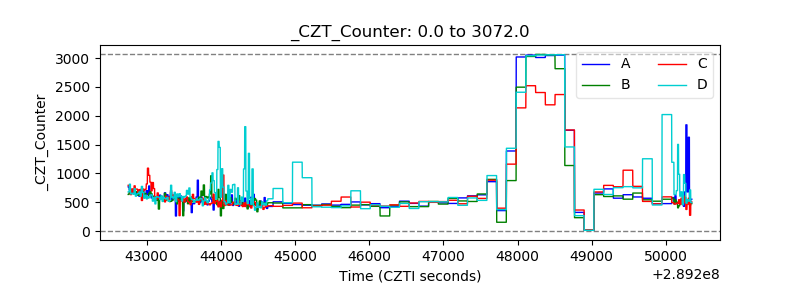 |
| +2.5 Volts monitor |  |
| +5 Volts monitor | 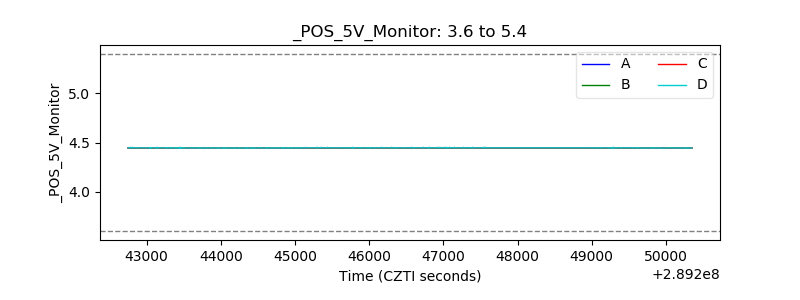 |
| _ROLL_ROT | 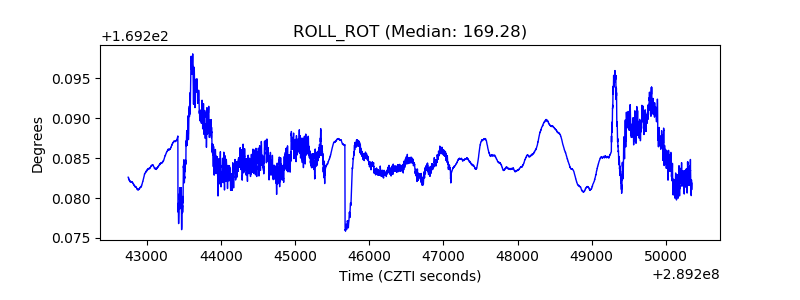 |
| _Roll_DEC | 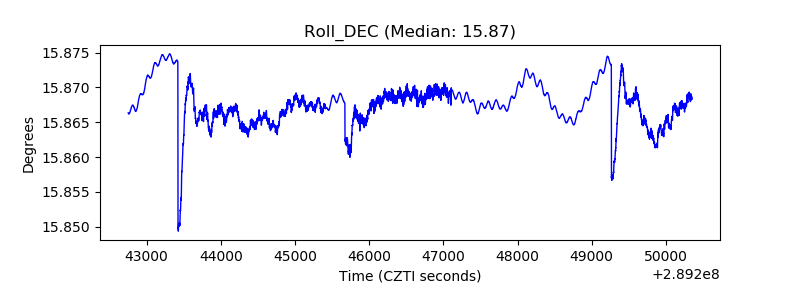 |
| _Roll_RA | 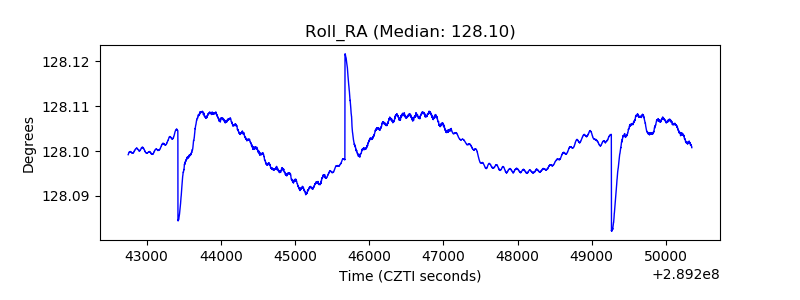 |
| Veto Counter | 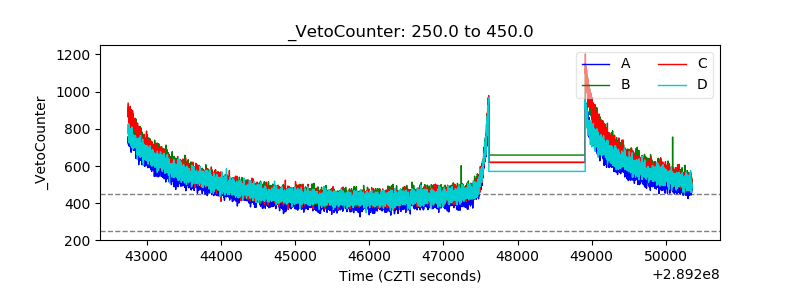 |