| Param | Original file | Final file |
|---|---|---|
| Filename | modeM0/AS1A05_187T03_9000002748_18527cztM0_level2.evt | modeM0/AS1A05_187T03_9000002748_18527cztM0_level2_quad_clean.evt |
| Size (bytes) | 555,629,760 | 94,320,000 |
| Size | 529.9 MB | 90.0 MB |
| Events in quadrant A | 3,341,941 | 642,561 |
| Events in quadrant B | 3,359,616 | 654,470 |
| Events in quadrant C | 3,319,632 | 612,299 |
| Events in quadrant D | 6,382,651 | 510,679 |
| Mode M0 | |||
|---|---|---|---|
| Quadrant | BADHDUFLAG | Total packets | Discarded packets |
| A | 0 | 13831 | 2 |
| B | 0 | 13805 | 2 |
| C | 0 | 13717 | 3 |
| D | 0 | 23271 | 2 |
| Mode SS | |||
|---|---|---|---|
| Quadrant | BADHDUFLAG | Total packets | Discarded packets |
| A | 0 | 128 | 0 |
| B | 0 | 128 | 0 |
| C | 0 | 128 | 0 |
| D | 0 | 128 | 0 |
| Mode M9 | |||
|---|---|---|---|
| Quadrant | BADHDUFLAG | Total packets | Discarded packets |
| A | 0 | 17 | 0 |
| B | 0 | 18 | 0 |
| C | 0 | 18 | 0 |
| D | 0 | 18 | 0 |
| Quadrant | Total seconds | Saturated seconds | Saturation percentage |
|---|---|---|---|
| A | 6242 | 94 | 1.505928% |
| B | 6242 | 84 | 1.345723% |
| C | 6241 | 107 | 1.714469% |
| D | 6241 | 1121 | 17.961865% |
Noise dominated data is calculated using 1-second bins in cleaned event files. If a bin has >2000 counts, and if more than 50% of those come from <1% of pixels, then it is considered to be noise-dominated and hence unusable.
| Quadrant | # 1 sec bins | Bins with >0 counts | Bins with >2000 counts | High rate bins dominated by noise | Noise dominated (total time) | Noise dominated (detector-on time) | Marked lightcurve |
|---|---|---|---|---|---|---|---|
| A | 7582 | 6242 | 11 | 11 | 0.15% | 0.18% | 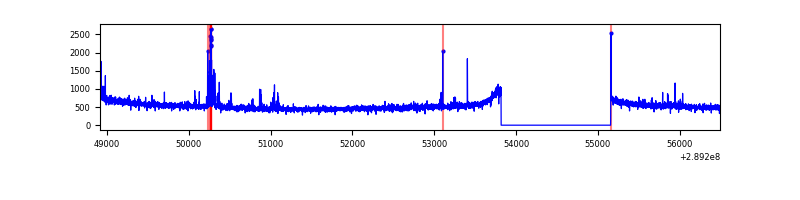 |
| B | 7582 | 6242 | 1 | 1 | 0.01% | 0.02% | 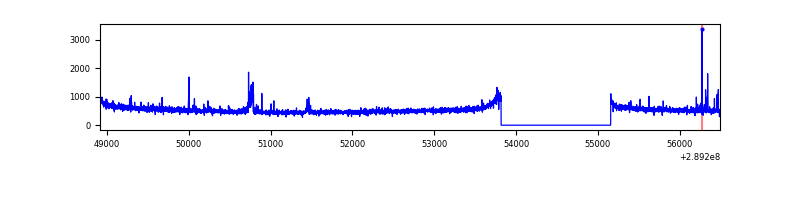 |
| C | 7581 | 6241 | 2 | 2 | 0.03% | 0.03% | 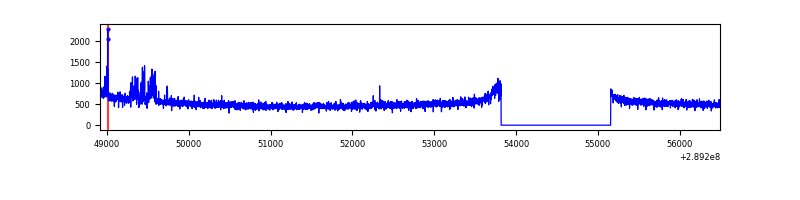 |
| D | 7580 | 6240 | 1010 | 1010 | 13.32% | 16.19% | 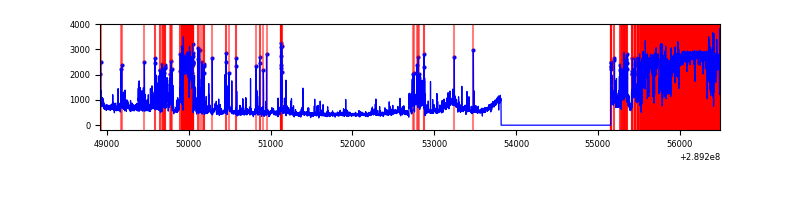 |
Top three noisy pixels from each quadrant. If the there are fewer than three noisy pixels in the level2.evt file, extra rows are filled as -1
| Pixel properties | Quadrant properties | ||||||
|---|---|---|---|---|---|---|---|
| Quadrant | DetID | PixID | Counts | Sigma | Mean | Median | Sigma |
| A | 0 | 13 | 65058 | 384.39 | 837 | 822 | 167.1 |
| A | 15 | 192 | 25657 | 148.61 | 837 | 822 | 167.1 |
| A | 9 | 143 | 14421 | 81.38 | 837 | 822 | 167.1 |
| B | 3 | 64 | 49755 | 313.34 | 835 | 816 | 156.2 |
| B | 4 | 171 | 21022 | 129.37 | 835 | 816 | 156.2 |
| B | 12 | 111 | 17733 | 108.31 | 835 | 816 | 156.2 |
| C | 14 | 238 | 125243 | 675.24 | 795 | 802 | 184.3 |
| C | 3 | 233 | 78472 | 421.45 | 795 | 802 | 184.3 |
| C | 0 | 207 | 14041 | 71.84 | 795 | 802 | 184.3 |
| D | 7 | 238 | 2857825 | 15831.96 | 745 | 725 | 180.5 |
| D | 13 | 168 | 497360 | 2751.99 | 745 | 725 | 180.5 |
| D | 1 | 52 | 94204 | 517.99 | 745 | 725 | 180.5 |
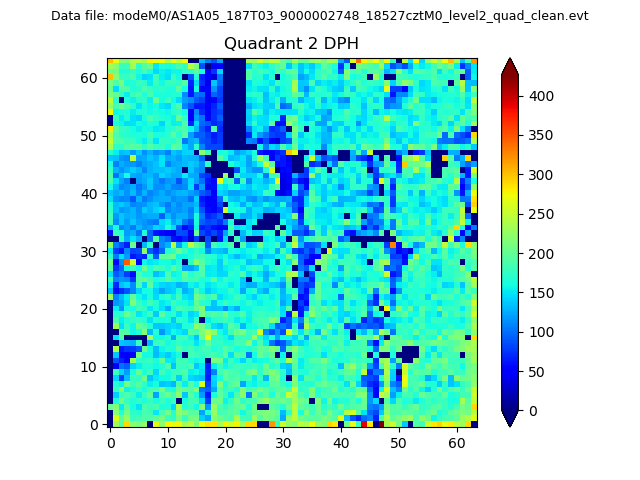
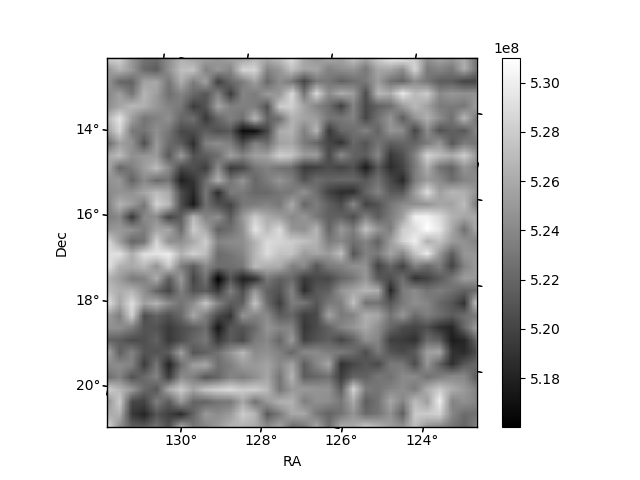
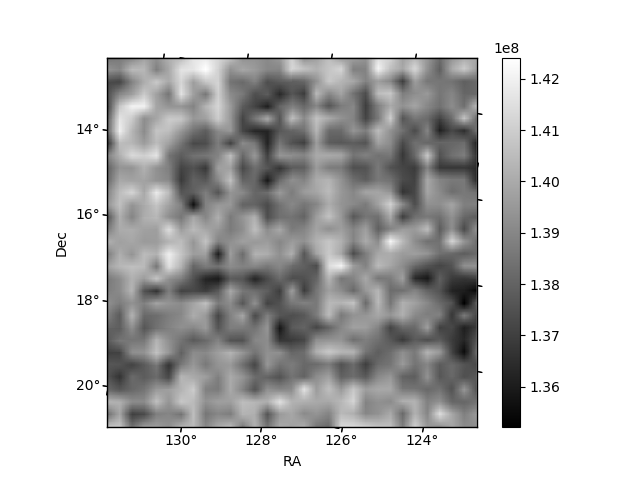
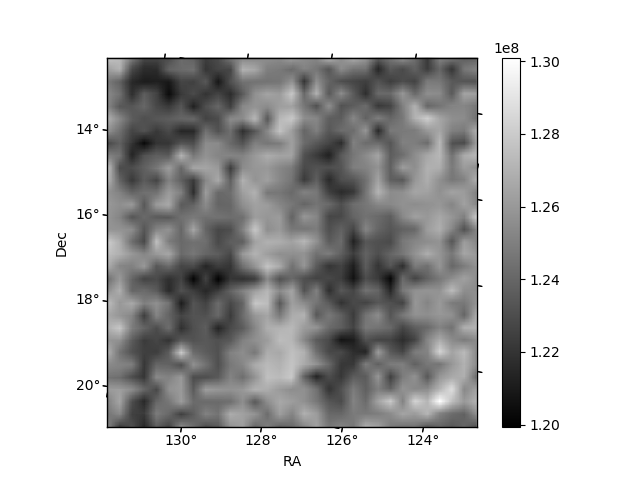
Histogram calculated using DETX and DETY for each event in the final _common_clean file
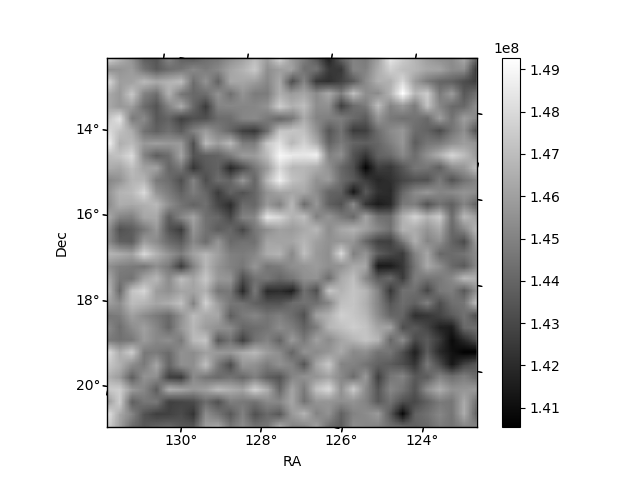
| Quadrant A | 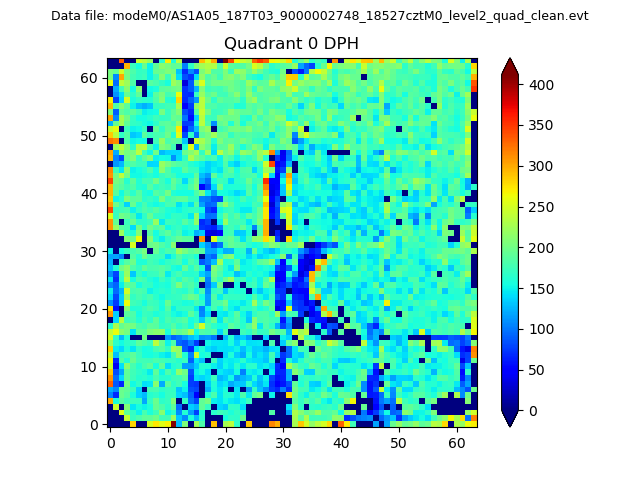 |
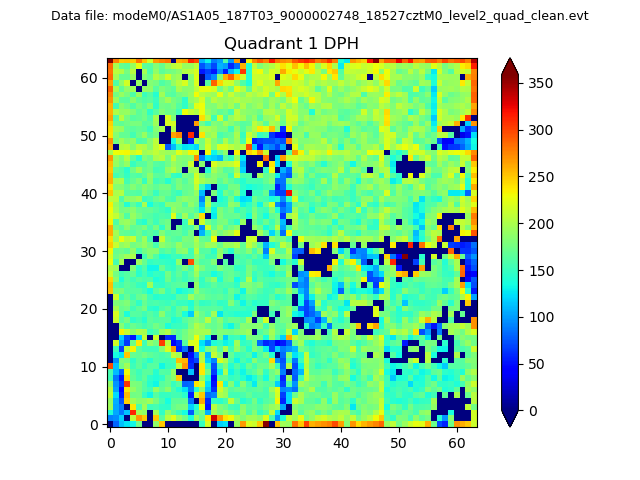 |
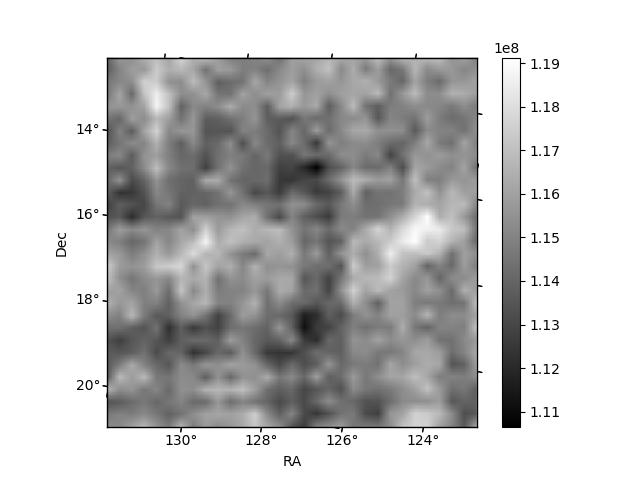
Quadrant B |
|---|---|---|---|
| Quadrant D | 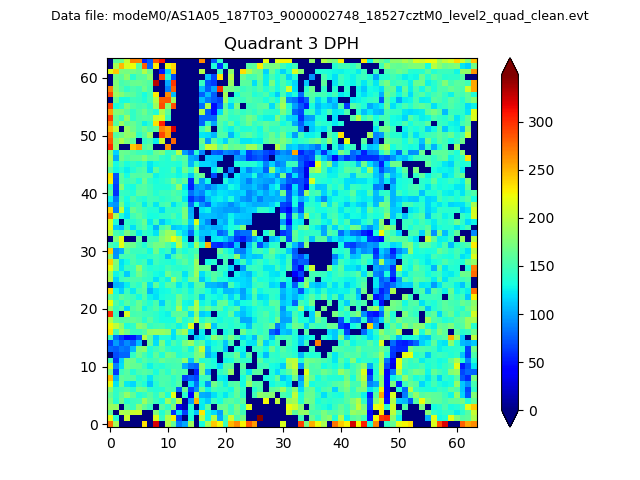 |
 |
Quadrant C |
| Plot type | Count rate plots | Images |
|---|---|---|
| Comparison with Poisson distribution Blue bars denote a histogram of data divided into 1 sec bins. Red curve is a Poisson curve with rate = median count rate of data. |
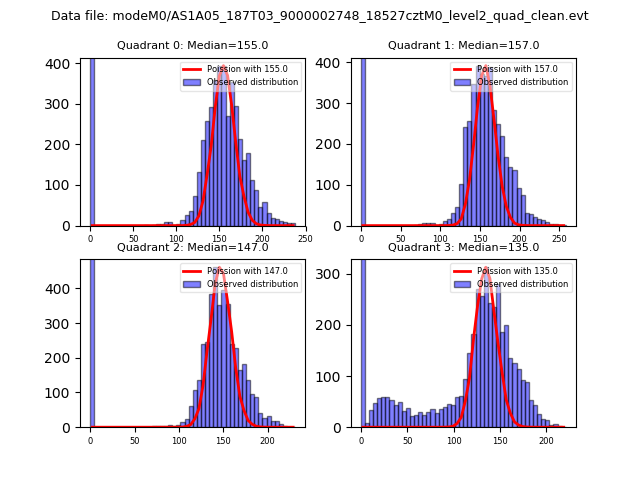 |
 |
| Quadrant-wise count rates Data is divided into 100 sec bins |
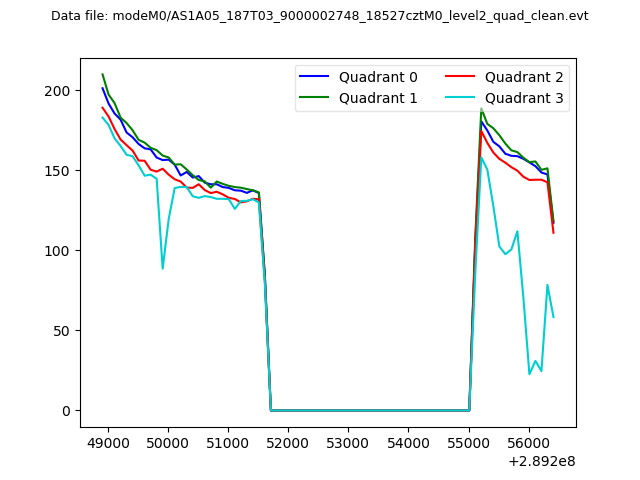 |
|
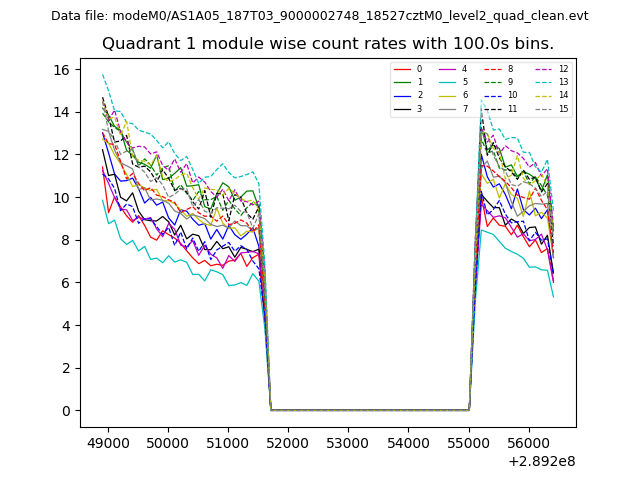
| Module-wise count rates for Quadrant A Data is divided into 100 sec bins |
 |
 |
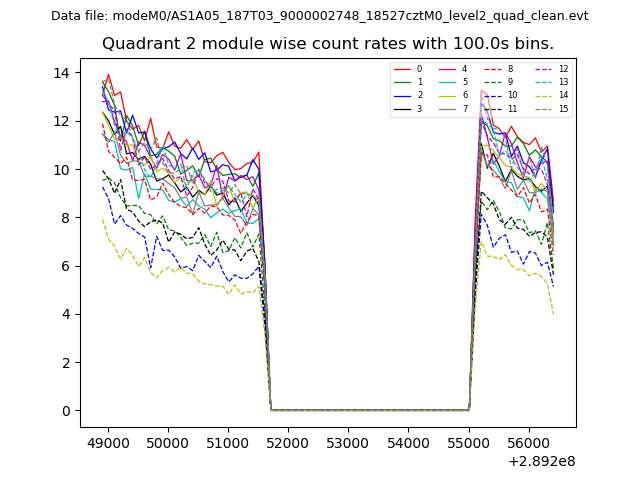
| Module-wise count rates for Quadrant B Data is divided into 100 sec bins |
 |
 |
| Module-wise count rates for Quadrant C Data is divided into 100 sec bins |
 |
 |
| Module-wise count rates for Quadrant D Data is divided into 100 sec bins |
 |
 |
| Parameter | Plot |
|---|---|
| CZT HV Monitor |  |
| D_VDD | 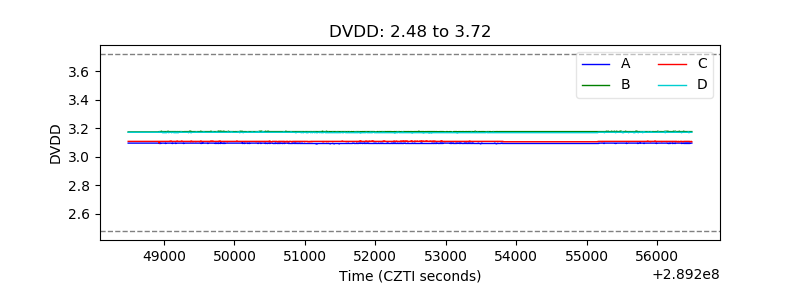 |
| Temperature 1 | 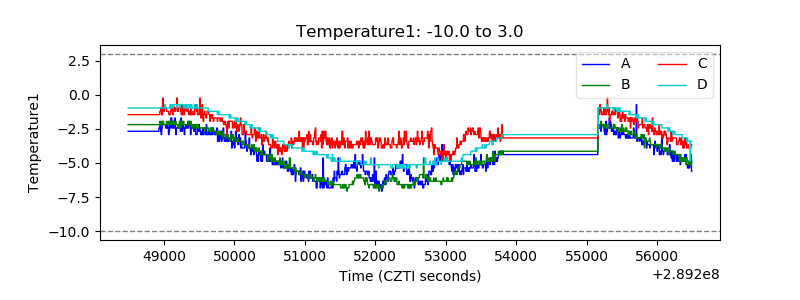 |
| Veto HV Monitor | 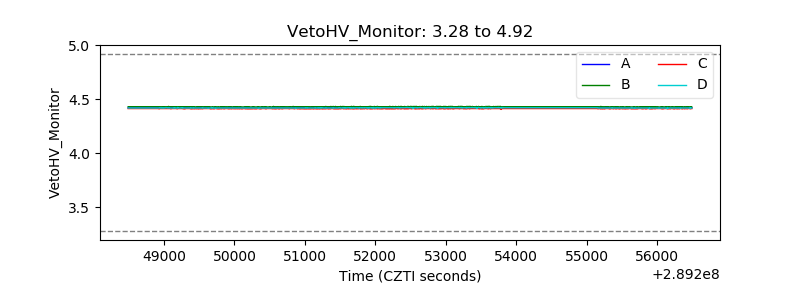 |
| Veto LLD | 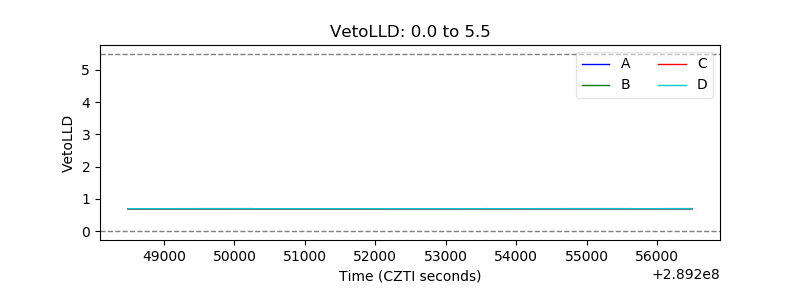 |
| Alpha Counter | 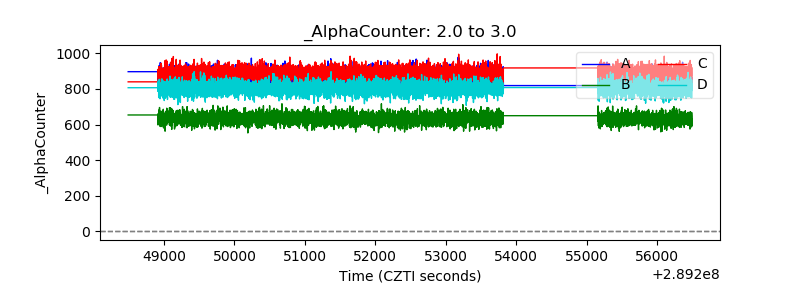 |
| _CPM_Rate | 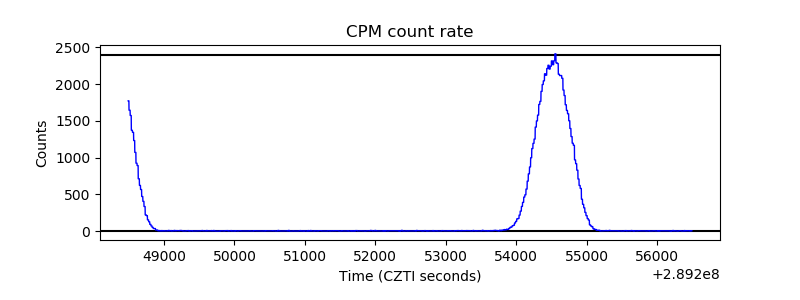 |
| CZT Counter |  |
| +2.5 Volts monitor |  |
| +5 Volts monitor |  |
| _ROLL_ROT |  |
| _Roll_DEC | 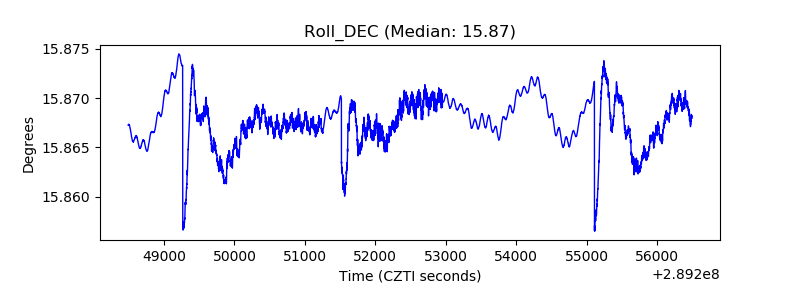 |
| _Roll_RA | 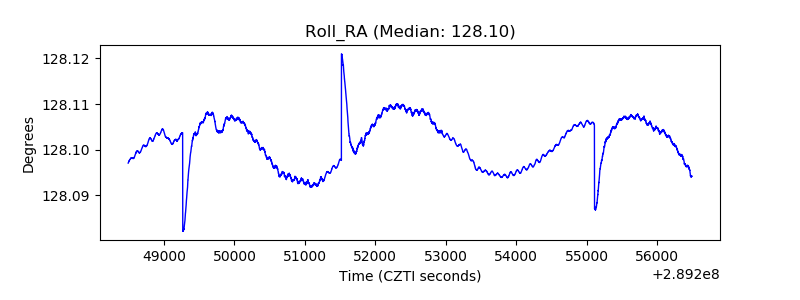 |
| Veto Counter | 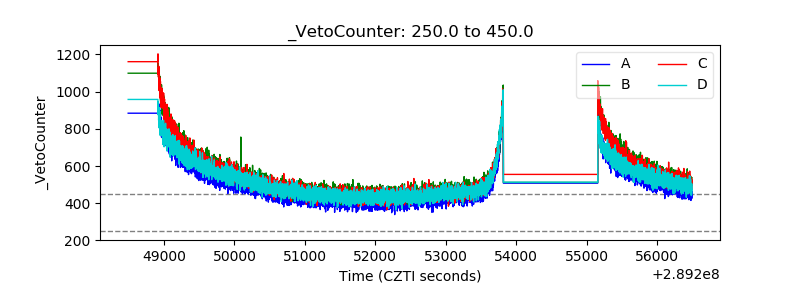 |