| Param | Original file | Final file |
|---|---|---|
| Filename | modeM0/AS1A05_187T03_9000002748_18528cztM0_level2.evt | modeM0/AS1A05_187T03_9000002748_18528cztM0_level2_quad_clean.evt |
| Size (bytes) | 576,414,720 | 84,150,720 |
| Size | 549.7 MB | 80.3 MB |
| Events in quadrant A | 3,152,753 | 573,012 |
| Events in quadrant B | 3,163,838 | 586,933 |
| Events in quadrant C | 3,162,489 | 547,581 |
| Events in quadrant D | 7,562,754 | 412,782 |
| Mode M0 | |||
|---|---|---|---|
| Quadrant | BADHDUFLAG | Total packets | Discarded packets |
| A | 0 | 13153 | 1 |
| B | 0 | 13123 | 1 |
| C | 0 | 13075 | 1 |
| D | 0 | 26633 | 4 |
| Mode SS | |||
|---|---|---|---|
| Quadrant | BADHDUFLAG | Total packets | Discarded packets |
| A | 0 | 126 | 0 |
| B | 0 | 126 | 0 |
| C | 0 | 126 | 0 |
| D | 0 | 126 | 0 |
| Mode M9 | |||
|---|---|---|---|
| Quadrant | BADHDUFLAG | Total packets | Discarded packets |
| A | 0 | 12 | 0 |
| B | 0 | 12 | 0 |
| C | 0 | 12 | 0 |
| D | 0 | 12 | 0 |
| Quadrant | Total seconds | Saturated seconds | Saturation percentage |
|---|---|---|---|
| A | 6114 | 84 | 1.373896% |
| B | 6115 | 92 | 1.504497% |
| C | 6115 | 111 | 1.815209% |
| D | 6114 | 1665 | 27.232581% |
Noise dominated data is calculated using 1-second bins in cleaned event files. If a bin has >2000 counts, and if more than 50% of those come from <1% of pixels, then it is considered to be noise-dominated and hence unusable.
| Quadrant | # 1 sec bins | Bins with >0 counts | Bins with >2000 counts | High rate bins dominated by noise | Noise dominated (total time) | Noise dominated (detector-on time) | Marked lightcurve |
|---|---|---|---|---|---|---|---|
| A | 7399 | 6114 | 8 | 8 | 0.11% | 0.13% | 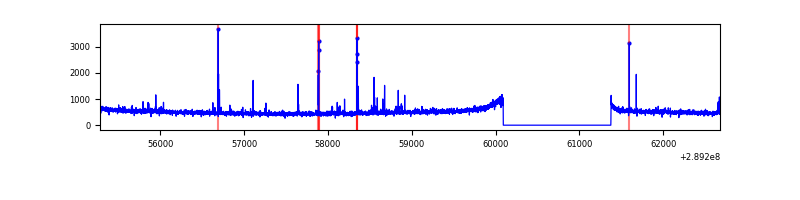 |
| B | 7400 | 6115 | 1 | 1 | 0.01% | 0.02% | 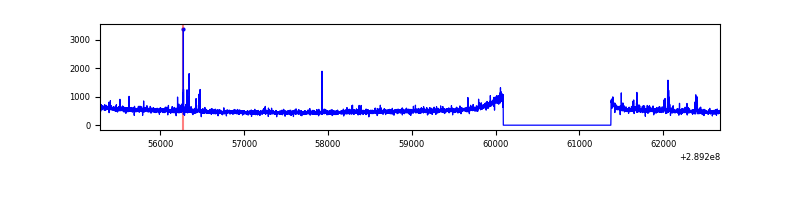 |
| C | 7400 | 6115 | 0 | 0 | 0.00% | 0.00% | 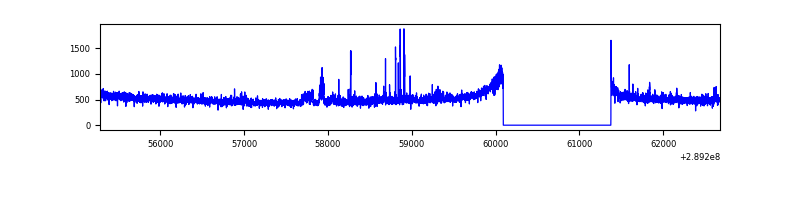 |
| D | 7399 | 6114 | 1584 | 1584 | 21.41% | 25.91% | 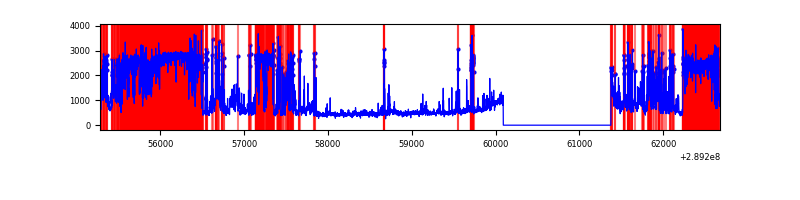 |
Top three noisy pixels from each quadrant. If the there are fewer than three noisy pixels in the level2.evt file, extra rows are filled as -1
| Pixel properties | Quadrant properties | ||||||
|---|---|---|---|---|---|---|---|
| Quadrant | DetID | PixID | Counts | Sigma | Mean | Median | Sigma |
| A | 9 | 143 | 63258 | 390.27 | 791 | 776 | 160.1 |
| A | 15 | 192 | 22609 | 136.37 | 791 | 776 | 160.1 |
| A | 13 | 254 | 10038 | 57.85 | 791 | 776 | 160.1 |
| B | 0 | 197 | 21230 | 136.5 | 793 | 775 | 149.9 |
| B | 12 | 111 | 17280 | 110.14 | 793 | 775 | 149.9 |
| B | 11 | 111 | 15018 | 95.05 | 793 | 775 | 149.9 |
| C | 14 | 238 | 118843 | 669.49 | 756 | 763 | 176.4 |
| C | 9 | 54 | 78457 | 440.51 | 756 | 763 | 176.4 |
| C | 13 | 61 | 5436 | 26.5 | 756 | 763 | 176.4 |
| D | 7 | 238 | 3097314 | 19045.61 | 671 | 652 | 162.6 |
| D | 1 | 52 | 945438 | 5810.78 | 671 | 652 | 162.6 |
| D | 13 | 168 | 865109 | 5316.73 | 671 | 652 | 162.6 |
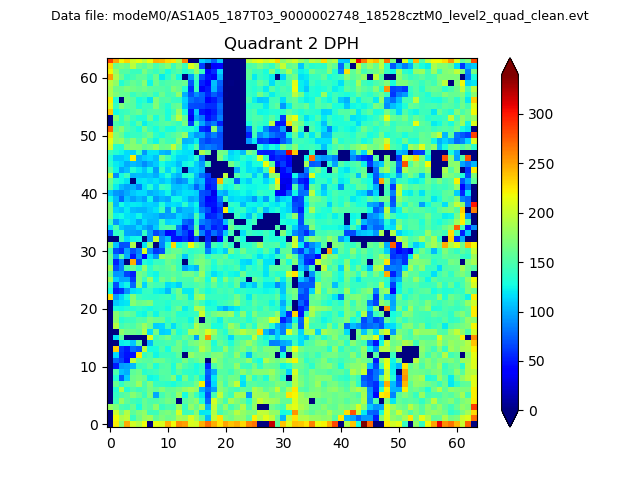
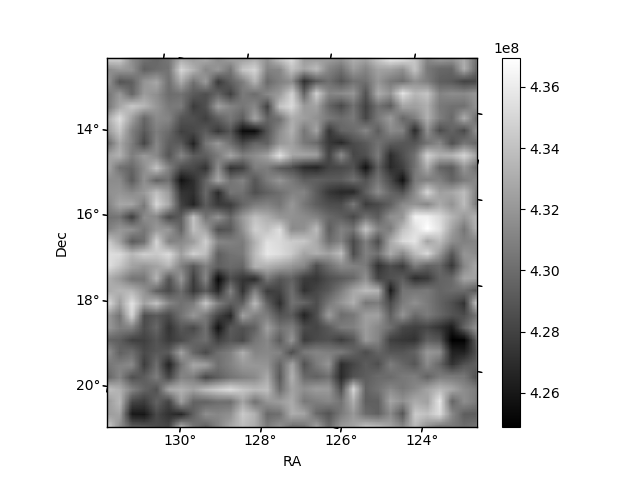
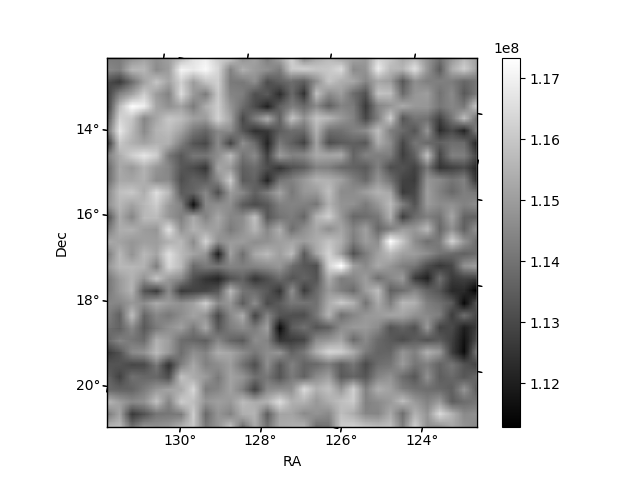
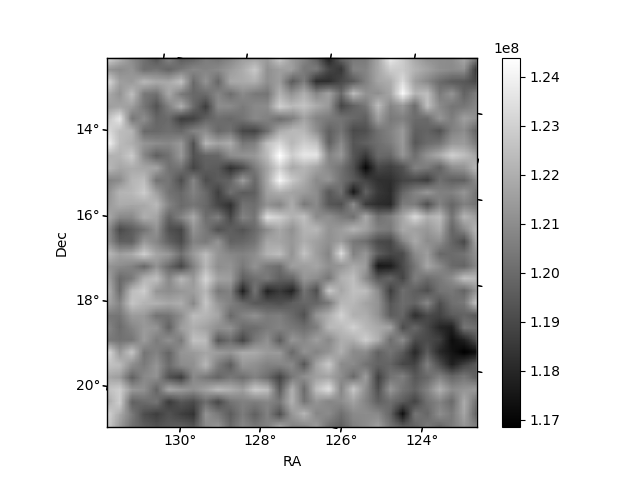
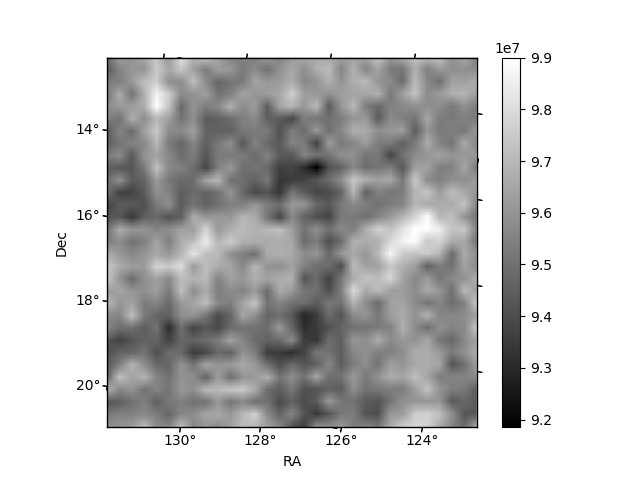
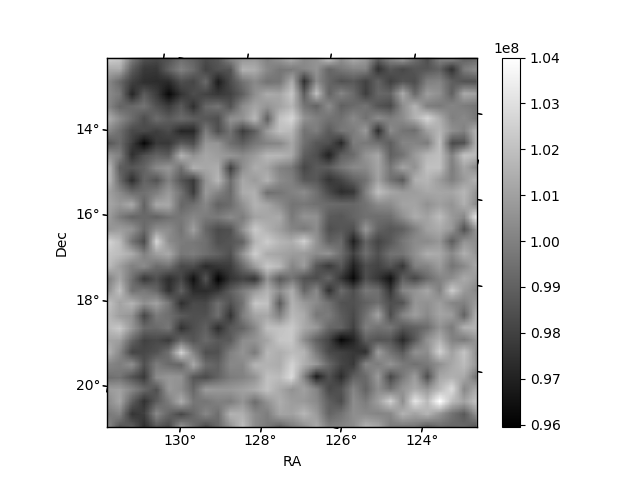
Histogram calculated using DETX and DETY for each event in the final _common_clean file
| Quadrant A | 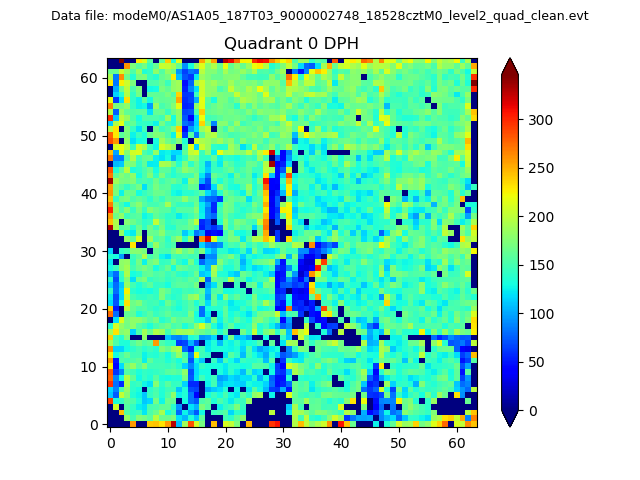 |
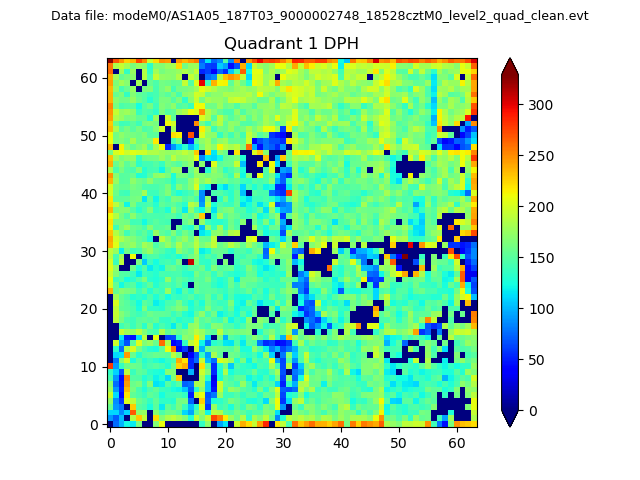 |
Quadrant B |
|---|---|---|---|
| Quadrant D | 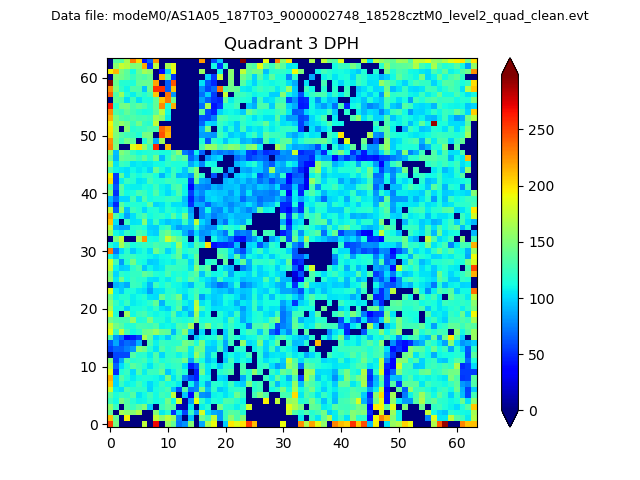 |
 |
Quadrant C |
| Plot type | Count rate plots | Images |
|---|---|---|
| Comparison with Poisson distribution Blue bars denote a histogram of data divided into 1 sec bins. Red curve is a Poisson curve with rate = median count rate of data. |
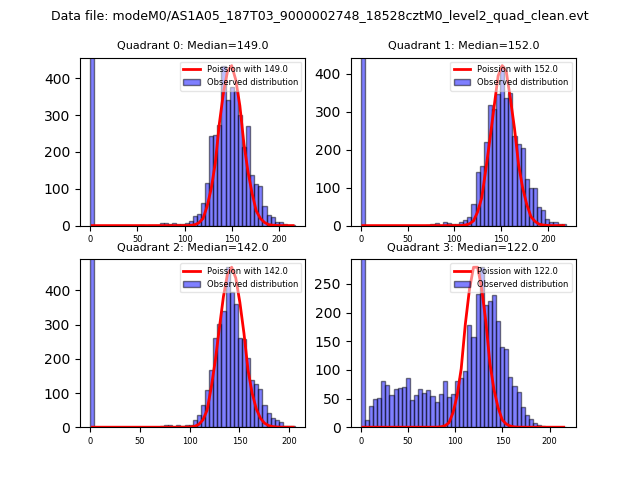 |
 |
| Quadrant-wise count rates Data is divided into 100 sec bins |
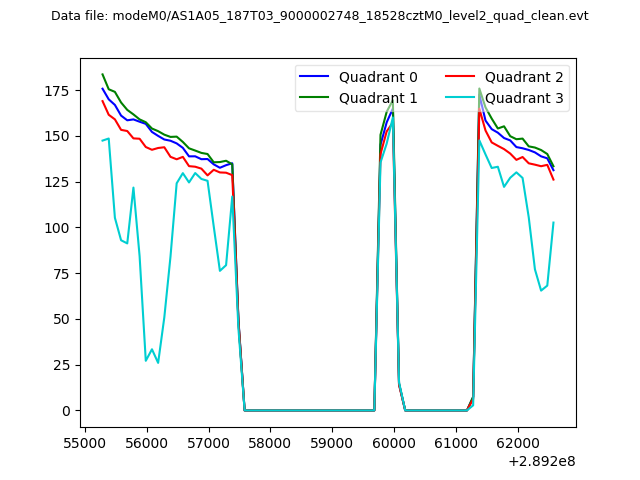 |
|
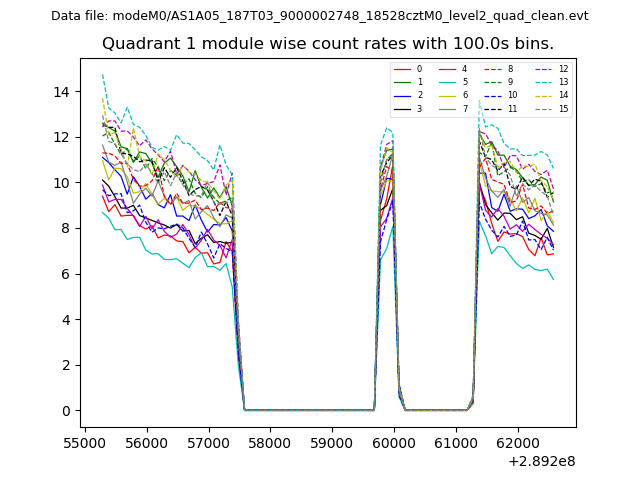
| Module-wise count rates for Quadrant A Data is divided into 100 sec bins |
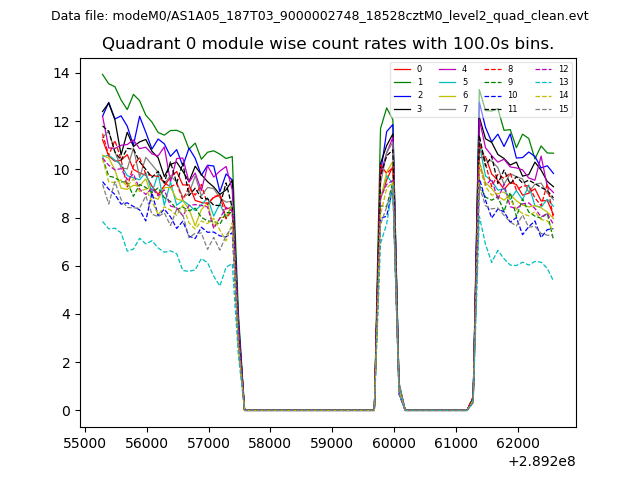 |
 |
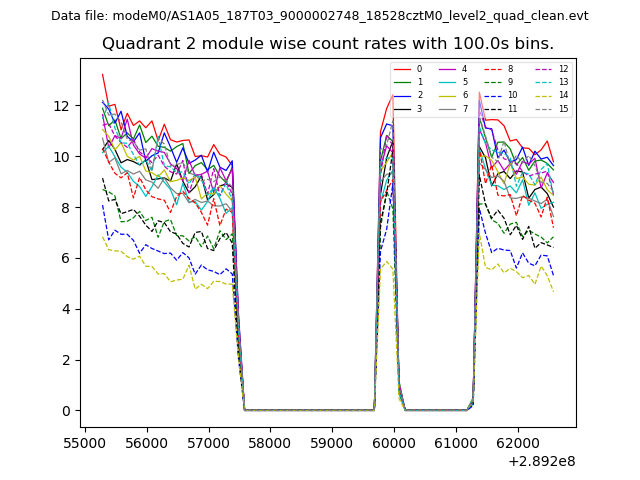
| Module-wise count rates for Quadrant B Data is divided into 100 sec bins |
 |
 |
| Module-wise count rates for Quadrant C Data is divided into 100 sec bins |
 |
 |
| Module-wise count rates for Quadrant D Data is divided into 100 sec bins |
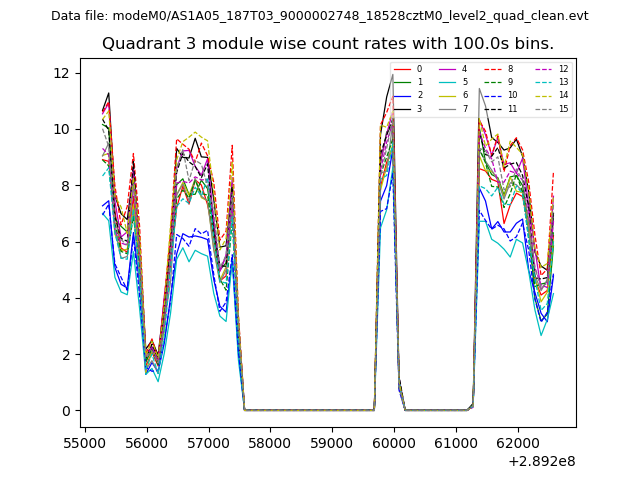 |
 |
| Parameter | Plot |
|---|---|
| CZT HV Monitor | 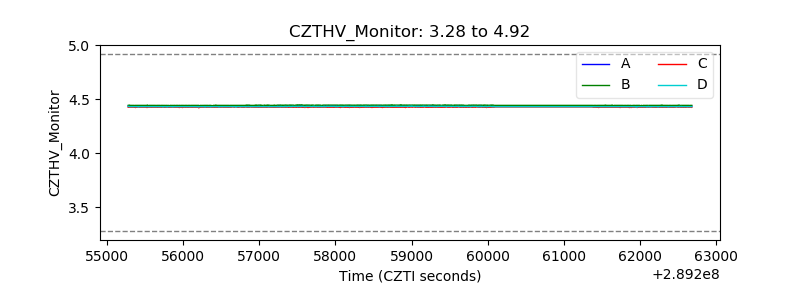 |
| D_VDD | 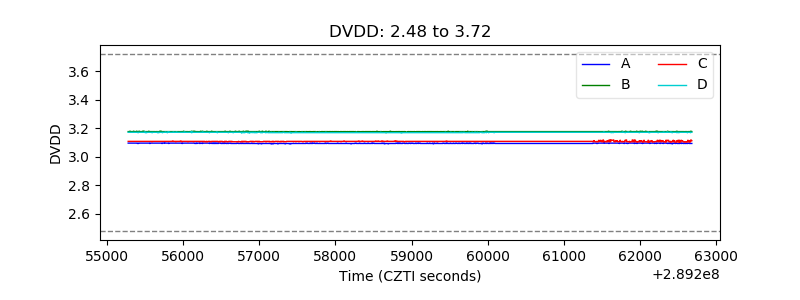 |
| Temperature 1 | 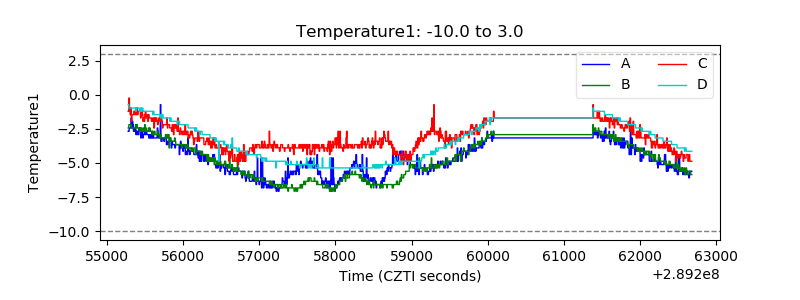 |
| Veto HV Monitor | 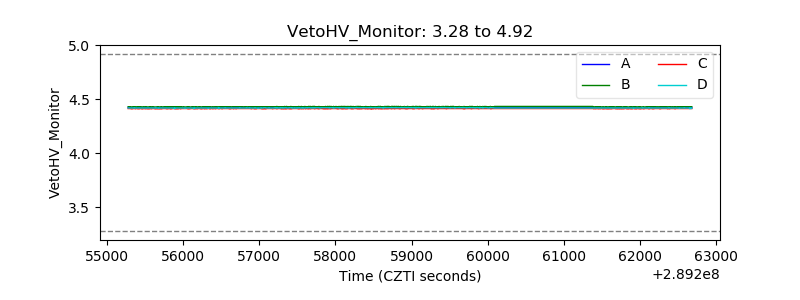 |
| Veto LLD | 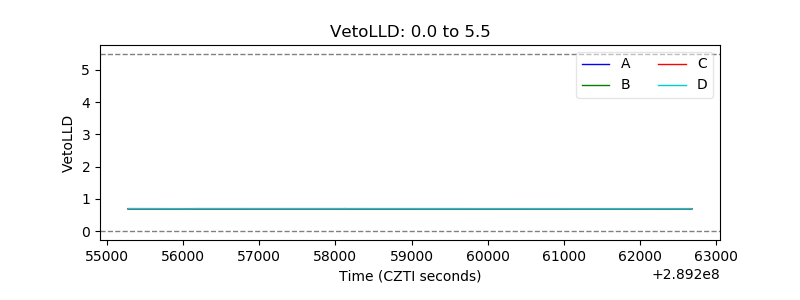 |
| Alpha Counter | 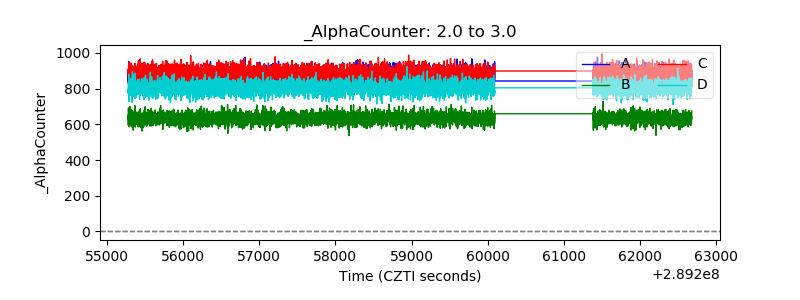 |
| _CPM_Rate | 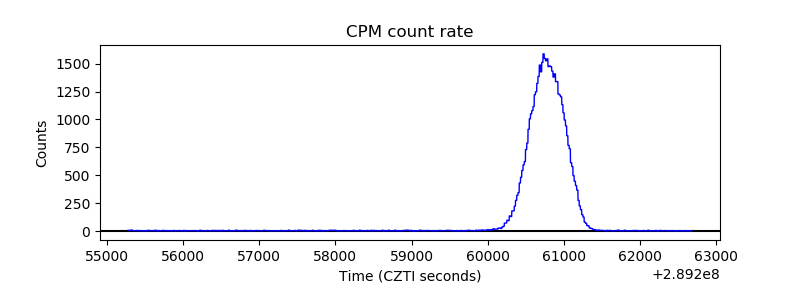 |
| CZT Counter | 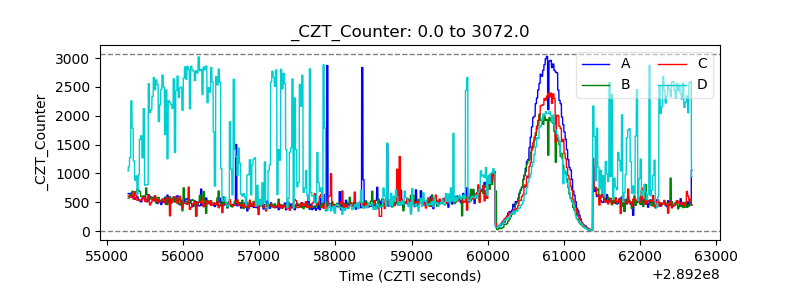 |
| +2.5 Volts monitor |  |
| +5 Volts monitor | 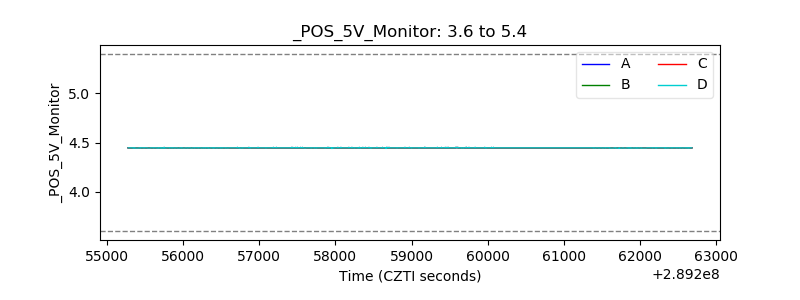 |
| _ROLL_ROT | 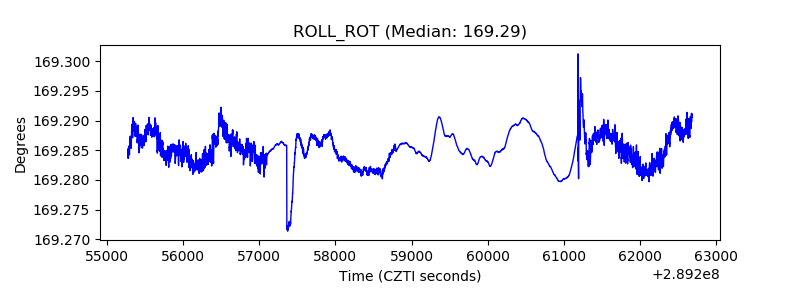 |
| _Roll_DEC | 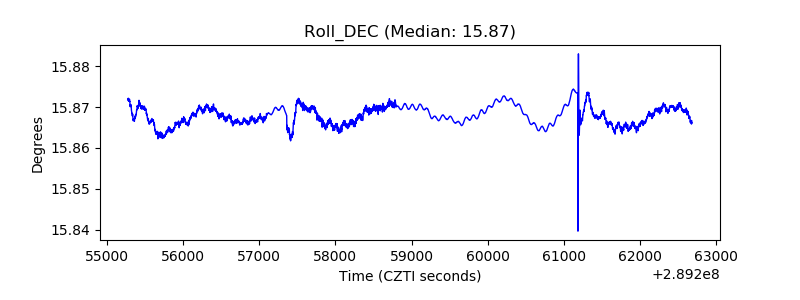 |
| _Roll_RA | 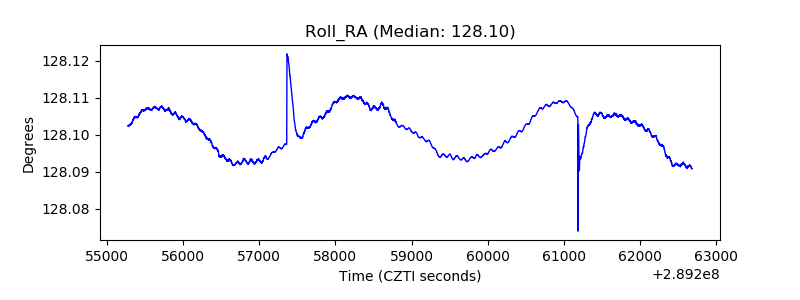 |
| Veto Counter | 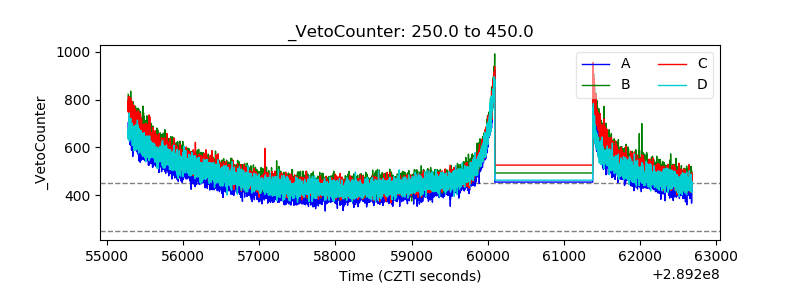 |