| Param | Original file | Final file |
|---|---|---|
| Filename | modeM0/AS1A05_187T03_9000002748_18529cztM0_level2.evt | modeM0/AS1A05_187T03_9000002748_18529cztM0_level2_quad_clean.evt |
| Size (bytes) | 540,233,280 | 89,003,520 |
| Size | 515.2 MB | 84.9 MB |
| Events in quadrant A | 3,176,721 | 581,947 |
| Events in quadrant B | 3,253,488 | 595,813 |
| Events in quadrant C | 3,445,647 | 559,909 |
| Events in quadrant D | 6,048,465 | 507,902 |
| Mode M0 | |||
|---|---|---|---|
| Quadrant | BADHDUFLAG | Total packets | Discarded packets |
| A | 0 | 13607 | 3 |
| B | 0 | 13726 | 3 |
| C | 0 | 14516 | 3 |
| D | 0 | 22427 | 3 |
| Mode SS | |||
|---|---|---|---|
| Quadrant | BADHDUFLAG | Total packets | Discarded packets |
| A | 0 | 132 | 0 |
| B | 0 | 132 | 0 |
| C | 0 | 132 | 0 |
| D | 0 | 132 | 0 |
| Mode M9 | |||
|---|---|---|---|
| Quadrant | BADHDUFLAG | Total packets | Discarded packets |
| A | 0 | 20 | 0 |
| B | 0 | 21 | 0 |
| C | 0 | 21 | 0 |
| D | 0 | 21 | 0 |
| Quadrant | Total seconds | Saturated seconds | Saturation percentage |
|---|---|---|---|
| A | 6439 | 33 | 0.512502% |
| B | 6438 | 42 | 0.652377% |
| C | 6438 | 68 | 1.056229% |
| D | 6438 | 646 | 10.034172% |
Noise dominated data is calculated using 1-second bins in cleaned event files. If a bin has >2000 counts, and if more than 50% of those come from <1% of pixels, then it is considered to be noise-dominated and hence unusable.
| Quadrant | # 1 sec bins | Bins with >0 counts | Bins with >2000 counts | High rate bins dominated by noise | Noise dominated (total time) | Noise dominated (detector-on time) | Marked lightcurve |
|---|---|---|---|---|---|---|---|
| A | 7599 | 6441 | 1 | 1 | 0.01% | 0.02% |  |
| B | 7598 | 6440 | 1 | 1 | 0.01% | 0.02% |  |
| C | 7598 | 6440 | 1 | 1 | 0.01% | 0.02% |  |
| D | 7598 | 6440 | 596 | 596 | 7.84% | 9.25% | 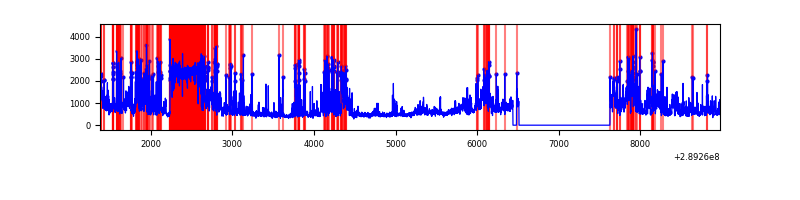 |
Top three noisy pixels from each quadrant. If the there are fewer than three noisy pixels in the level2.evt file, extra rows are filled as -1
| Pixel properties | Quadrant properties | ||||||
|---|---|---|---|---|---|---|---|
| Quadrant | DetID | PixID | Counts | Sigma | Mean | Median | Sigma |
| A | 15 | 191 | 26921 | 159.9 | 801 | 783 | 163.5 |
| A | 0 | 13 | 26701 | 158.55 | 801 | 783 | 163.5 |
| A | 15 | 174 | 20325 | 119.55 | 801 | 783 | 163.5 |
| B | 0 | 197 | 29567 | 187.02 | 805 | 784 | 153.9 |
| B | 15 | 222 | 28817 | 182.15 | 805 | 784 | 153.9 |
| B | 12 | 111 | 17899 | 111.21 | 805 | 784 | 153.9 |
| C | 9 | 54 | 288762 | 1600.69 | 768 | 773 | 179.9 |
| C | 14 | 238 | 119807 | 661.61 | 768 | 773 | 179.9 |
| C | 3 | 233 | 21210 | 113.59 | 768 | 773 | 179.9 |
| D | 13 | 168 | 1174714 | 6409.6 | 746 | 725 | 183.2 |
| D | 1 | 52 | 1024322 | 5588.51 | 746 | 725 | 183.2 |
| D | 7 | 238 | 783139 | 4271.73 | 746 | 725 | 183.2 |
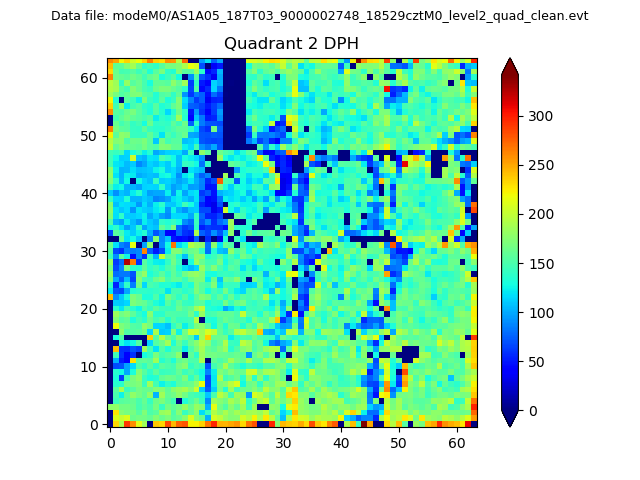
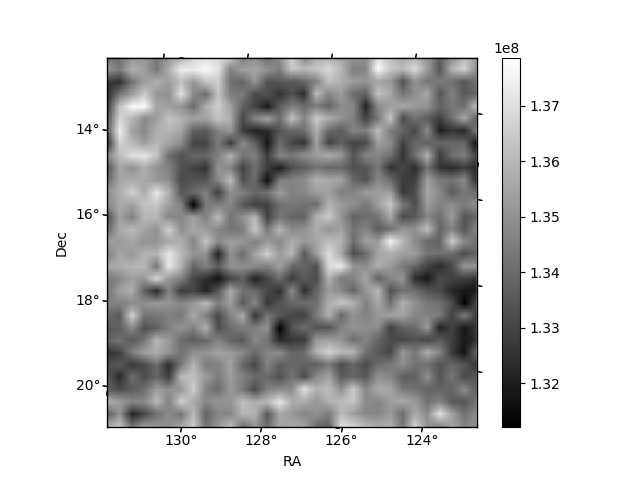
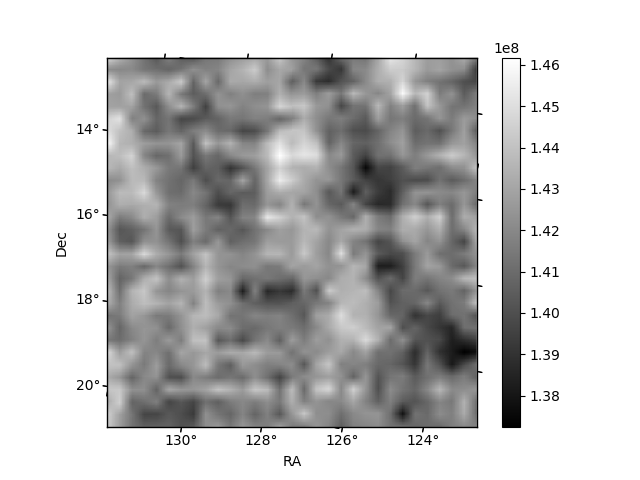
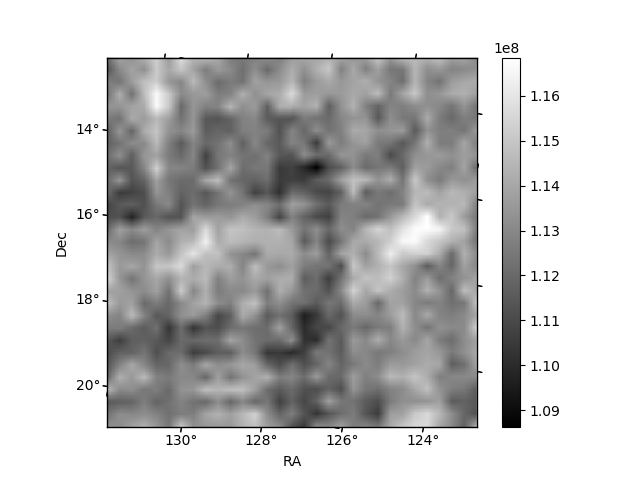
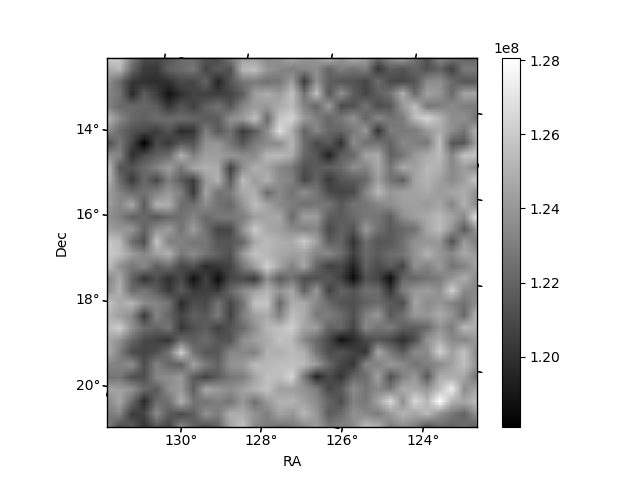
Histogram calculated using DETX and DETY for each event in the final _common_clean file
| Quadrant A | 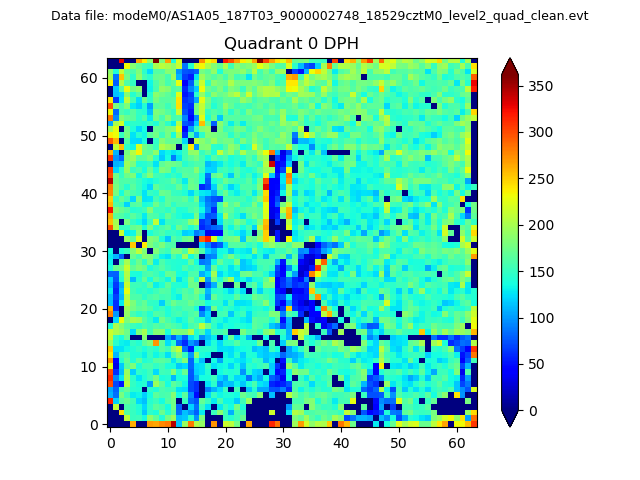 |
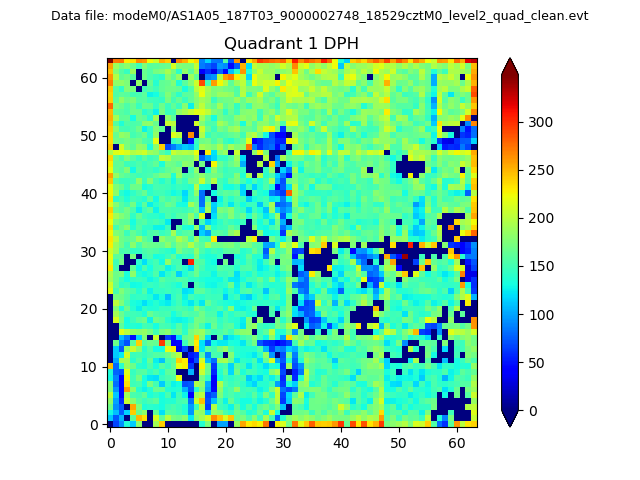 |
Quadrant B |
|---|---|---|---|
| Quadrant D | 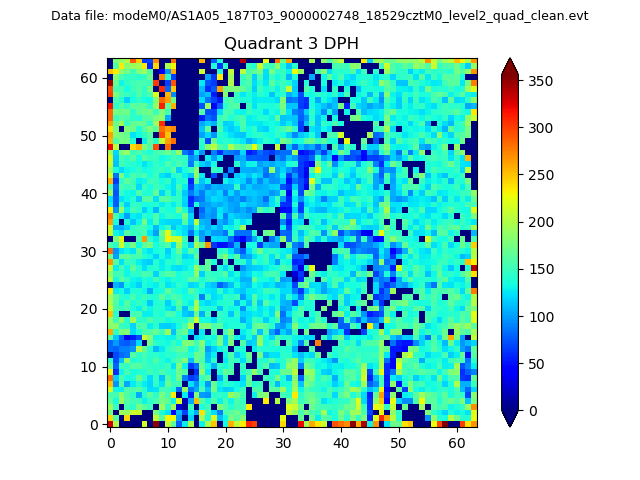 |
 |
Quadrant C |
| Plot type | Count rate plots | Images |
|---|---|---|
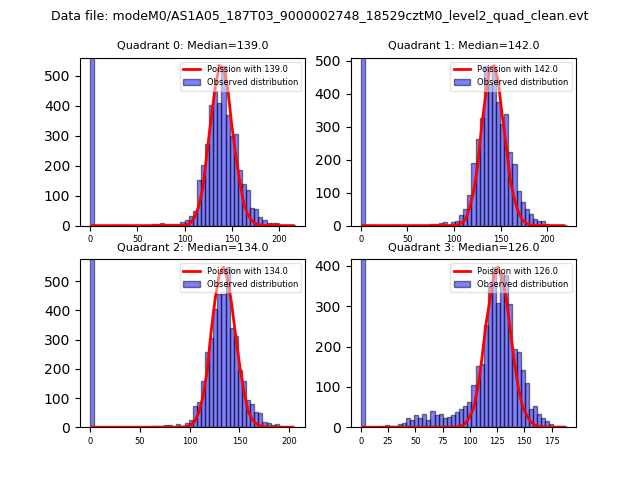
| Comparison with Poisson distribution Blue bars denote a histogram of data divided into 1 sec bins. Red curve is a Poisson curve with rate = median count rate of data. |
 |
 |
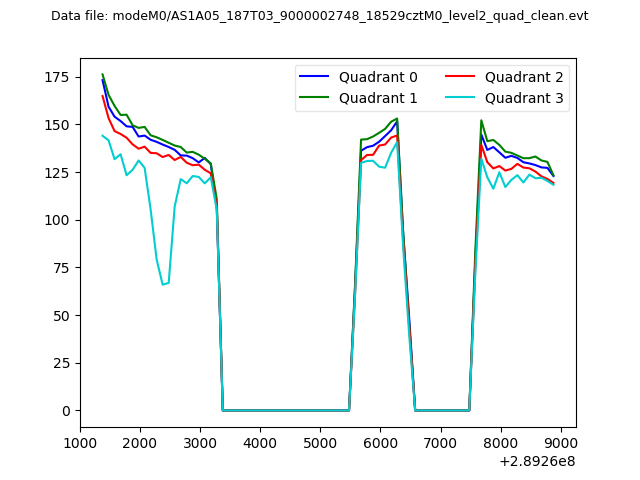
| Quadrant-wise count rates Data is divided into 100 sec bins |
 |
|
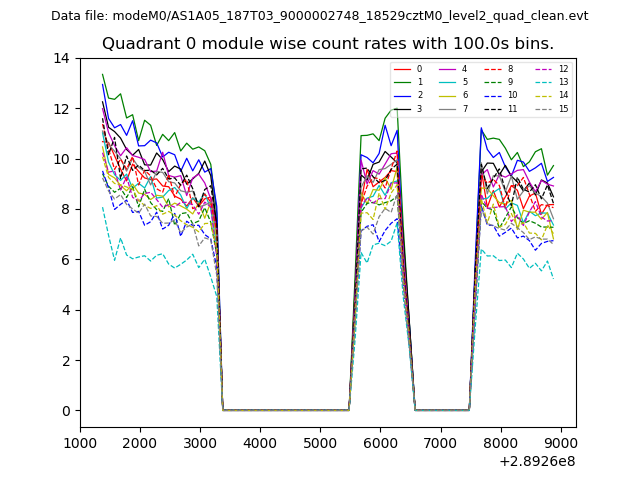
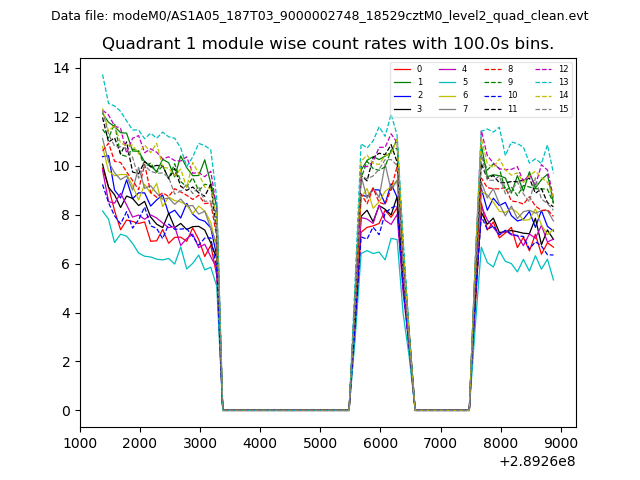
| Module-wise count rates for Quadrant A Data is divided into 100 sec bins |
 |
 |
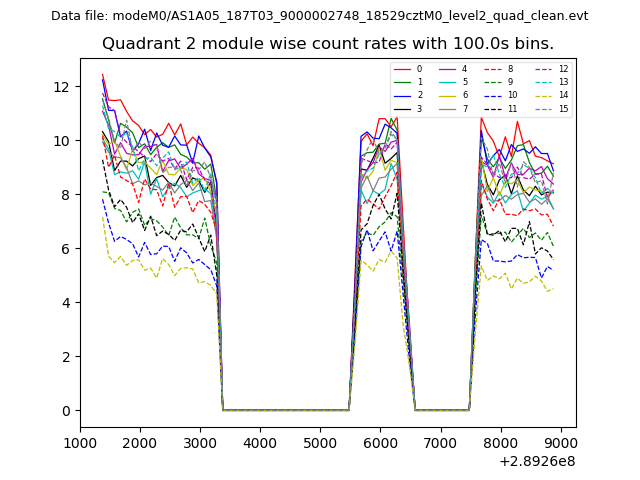
| Module-wise count rates for Quadrant B Data is divided into 100 sec bins |
 |
 |
| Module-wise count rates for Quadrant C Data is divided into 100 sec bins |
 |
 |
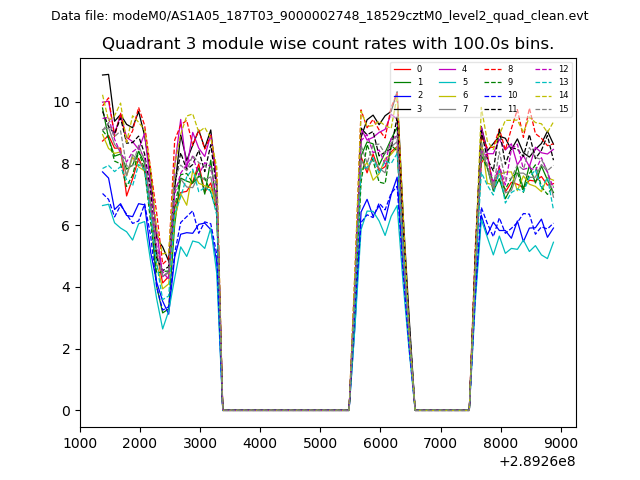
| Module-wise count rates for Quadrant D Data is divided into 100 sec bins |
 |
 |
| Parameter | Plot |
|---|---|
| CZT HV Monitor | 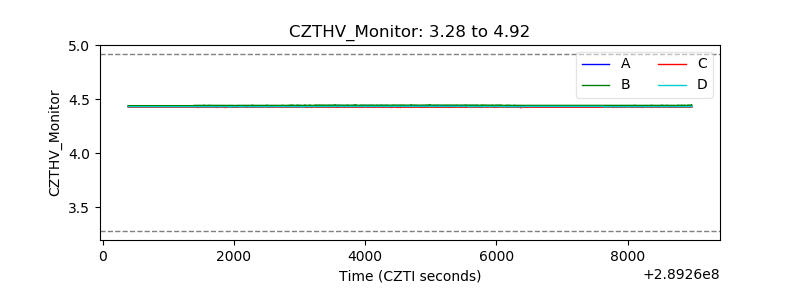 |
| D_VDD | 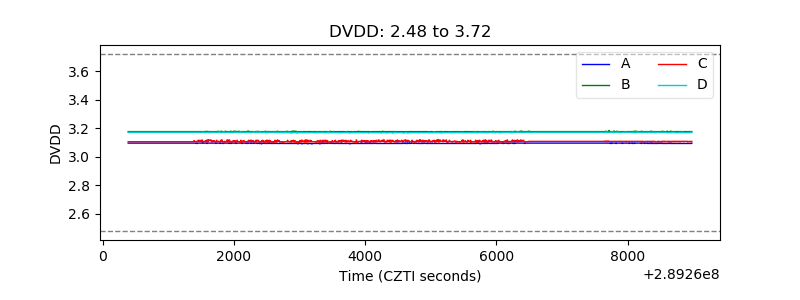 |
| Temperature 1 | 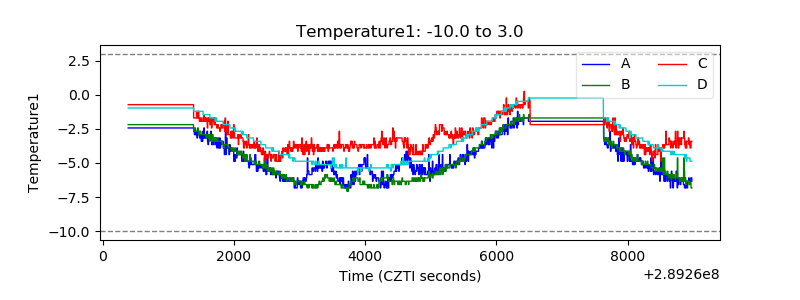 |
| Veto HV Monitor | 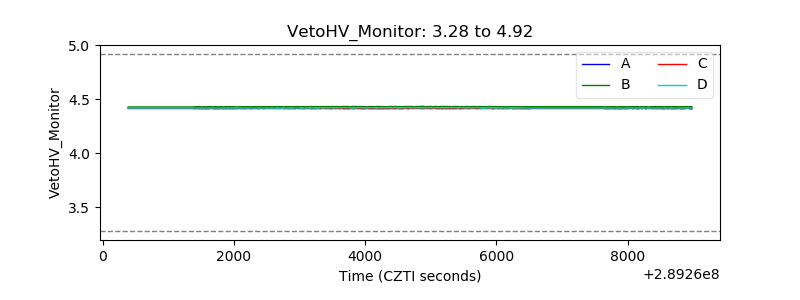 |
| Veto LLD | 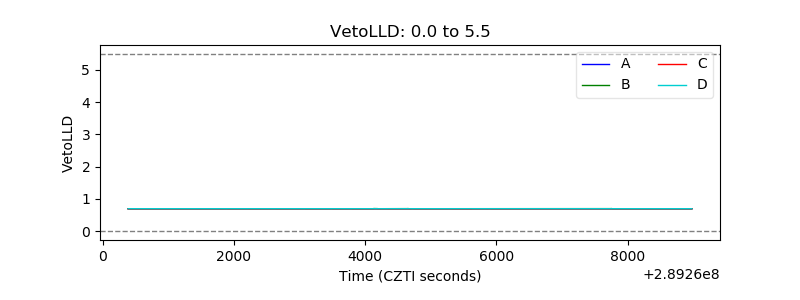 |
| Alpha Counter | 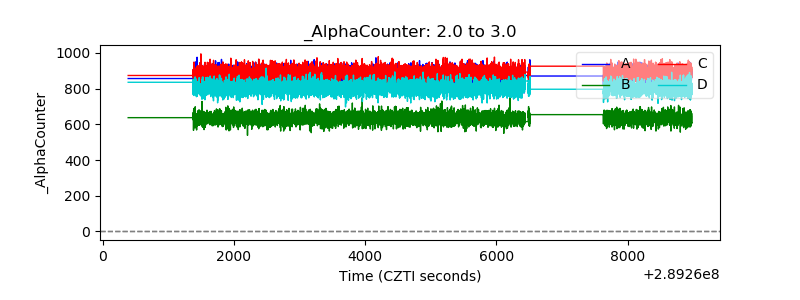 |
| _CPM_Rate | 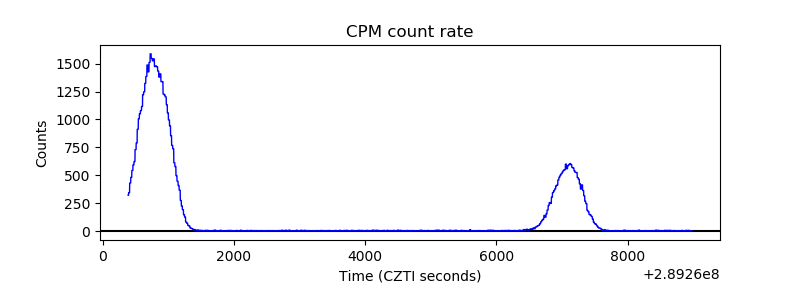 |
| CZT Counter | 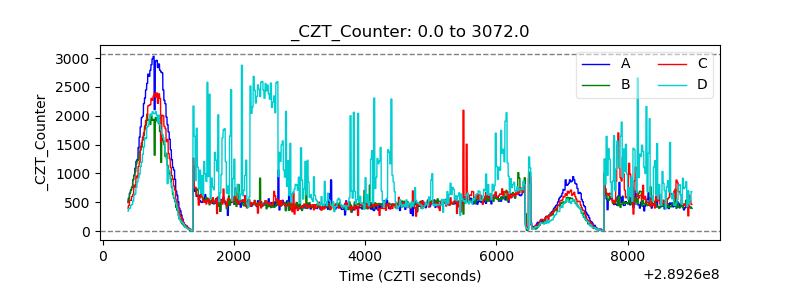 |
| +2.5 Volts monitor |  |
| +5 Volts monitor |  |
| _ROLL_ROT | 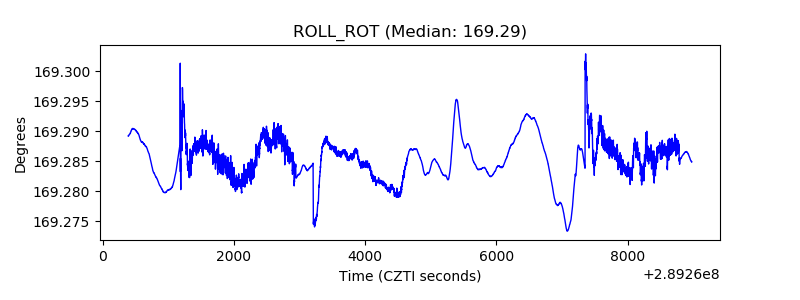 |
| _Roll_DEC | 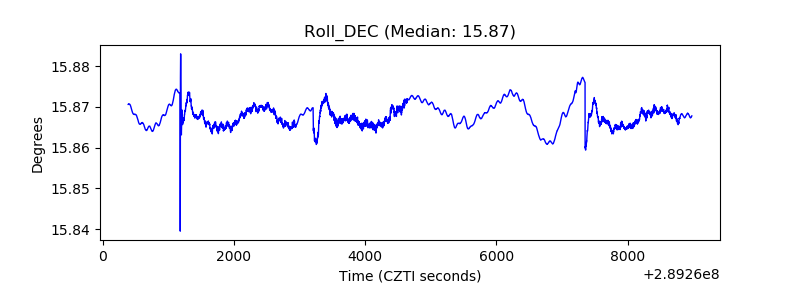 |
| _Roll_RA | 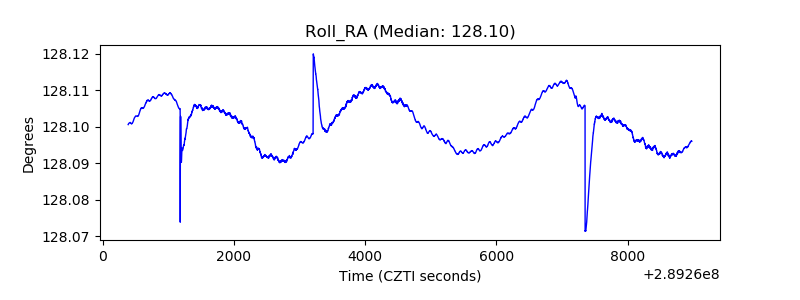 |
| Veto Counter | 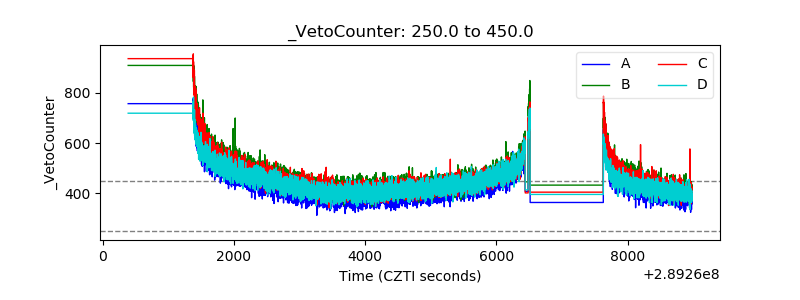 |