| Param | Original file | Final file |
|---|---|---|
| Filename | modeM0/AS1A05_187T03_9000002748_18531cztM0_level2.evt | modeM0/AS1A05_187T03_9000002748_18531cztM0_level2_quad_clean.evt |
| Size (bytes) | 535,141,440 | 89,527,680 |
| Size | 510.4 MB | 85.4 MB |
| Events in quadrant A | 3,521,407 | 564,220 |
| Events in quadrant B | 3,564,015 | 574,092 |
| Events in quadrant C | 3,596,814 | 546,005 |
| Events in quadrant D | 5,036,927 | 526,069 |
| Mode M0 | |||
|---|---|---|---|
| Quadrant | BADHDUFLAG | Total packets | Discarded packets |
| A | 0 | 15211 | 1 |
| B | 0 | 15286 | 1 |
| C | 0 | 15337 | 2 |
| D | 0 | 19990 | 1 |
| Mode SS | |||
|---|---|---|---|
| Quadrant | BADHDUFLAG | Total packets | Discarded packets |
| A | 0 | 146 | 0 |
| B | 0 | 146 | 0 |
| C | 0 | 146 | 0 |
| D | 0 | 146 | 0 |
| Mode M9 | |||
|---|---|---|---|
| Quadrant | BADHDUFLAG | Total packets | Discarded packets |
| A | 0 | 3 | 0 |
| B | 0 | 3 | 0 |
| C | 0 | 3 | 0 |
| D | 0 | 3 | 0 |
| Quadrant | Total seconds | Saturated seconds | Saturation percentage |
|---|---|---|---|
| A | 7188 | 35 | 0.486923% |
| B | 7189 | 85 | 1.182362% |
| C | 7188 | 96 | 1.335559% |
| D | 7188 | 201 | 2.796327% |
Noise dominated data is calculated using 1-second bins in cleaned event files. If a bin has >2000 counts, and if more than 50% of those come from <1% of pixels, then it is considered to be noise-dominated and hence unusable.
| Quadrant | # 1 sec bins | Bins with >0 counts | Bins with >2000 counts | High rate bins dominated by noise | Noise dominated (total time) | Noise dominated (detector-on time) | Marked lightcurve |
|---|---|---|---|---|---|---|---|
| A | 7533 | 7189 | 6 | 6 | 0.08% | 0.08% | 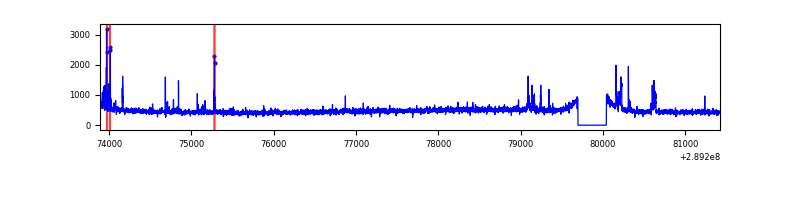 |
| B | 7534 | 7190 | 8 | 8 | 0.11% | 0.11% | 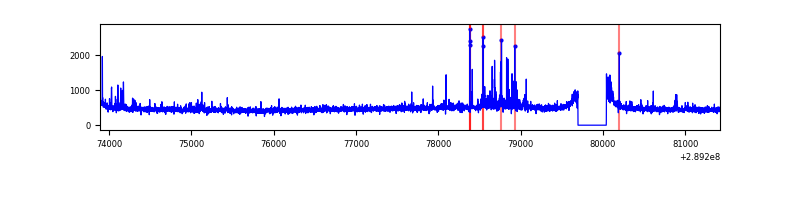 |
| C | 7533 | 7189 | 20 | 20 | 0.27% | 0.28% | 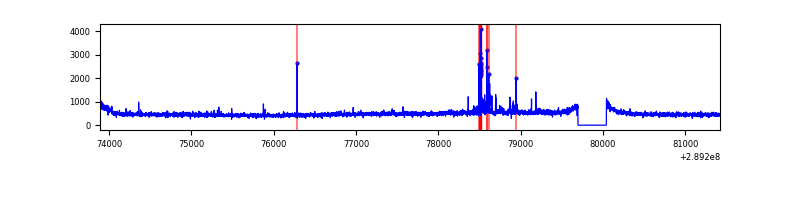 |
| D | 7533 | 7189 | 158 | 158 | 2.10% | 2.20% | 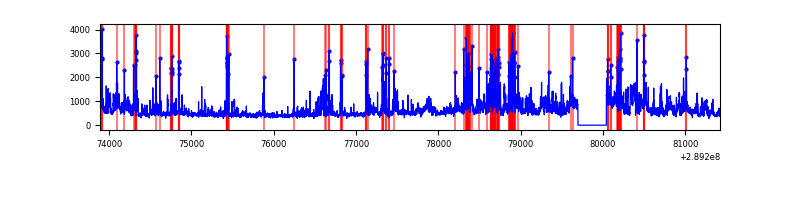 |
Top three noisy pixels from each quadrant. If the there are fewer than three noisy pixels in the level2.evt file, extra rows are filled as -1
| Pixel properties | Quadrant properties | ||||||
|---|---|---|---|---|---|---|---|
| Quadrant | DetID | PixID | Counts | Sigma | Mean | Median | Sigma |
| A | 0 | 13 | 87215 | 488.74 | 864 | 845 | 176.7 |
| A | 15 | 174 | 65218 | 364.27 | 864 | 845 | 176.7 |
| A | 15 | 192 | 18546 | 100.16 | 864 | 845 | 176.7 |
| B | 7 | 220 | 103776 | 611.76 | 867 | 842 | 168.3 |
| B | 0 | 197 | 20487 | 116.75 | 867 | 842 | 168.3 |
| B | 12 | 111 | 20047 | 114.14 | 867 | 842 | 168.3 |
| C | 14 | 238 | 128326 | 652.89 | 828 | 835 | 195.3 |
| C | 3 | 233 | 120244 | 611.5 | 828 | 835 | 195.3 |
| C | 0 | 207 | 107493 | 546.2 | 828 | 835 | 195.3 |
| D | 13 | 168 | 1181642 | 5806.38 | 830 | 805 | 203.4 |
| D | 7 | 238 | 506982 | 2488.96 | 830 | 805 | 203.4 |
| D | 15 | 0 | 96024 | 468.21 | 830 | 805 | 203.4 |
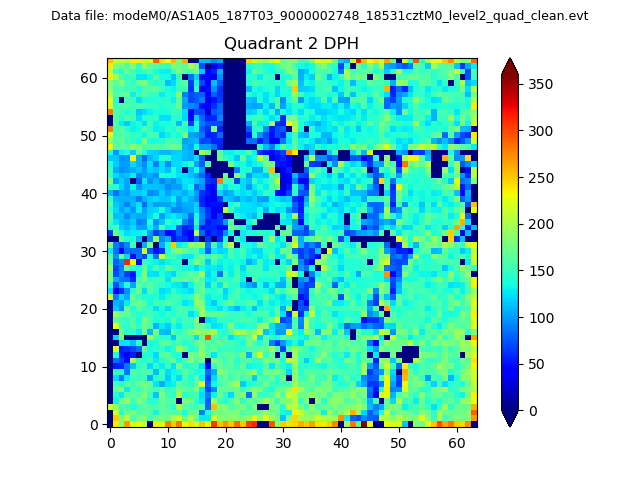
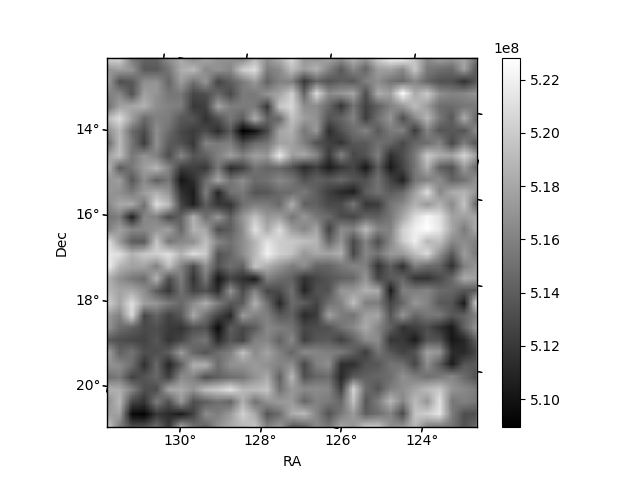
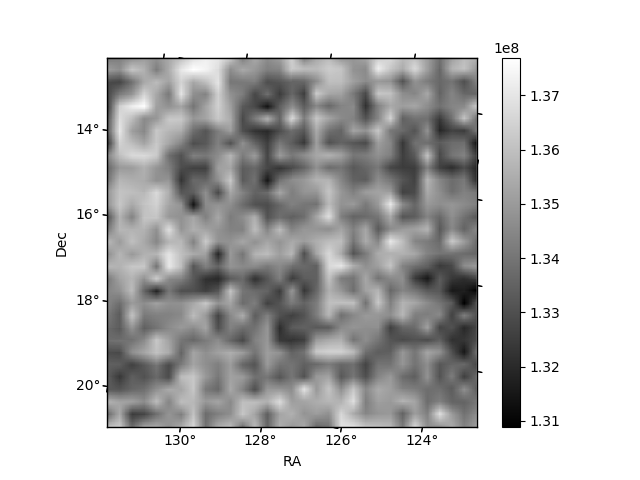
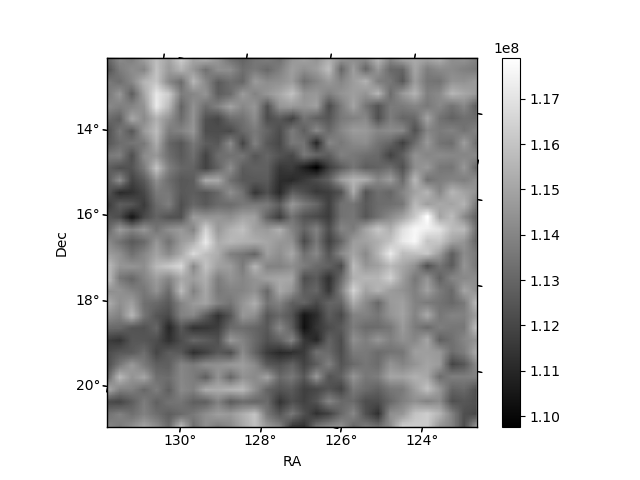
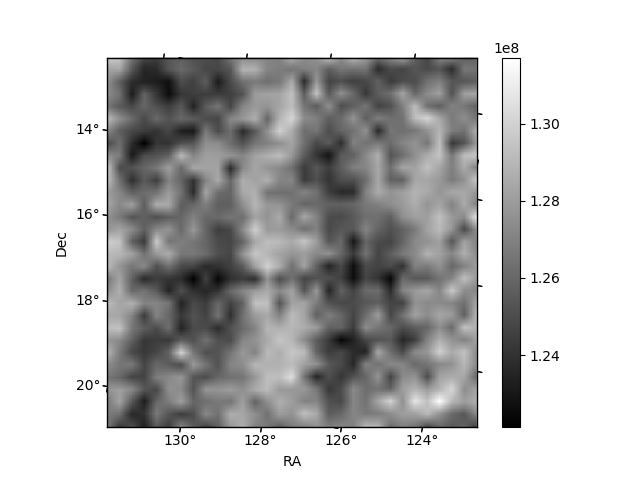
Histogram calculated using DETX and DETY for each event in the final _common_clean file
| Quadrant A | 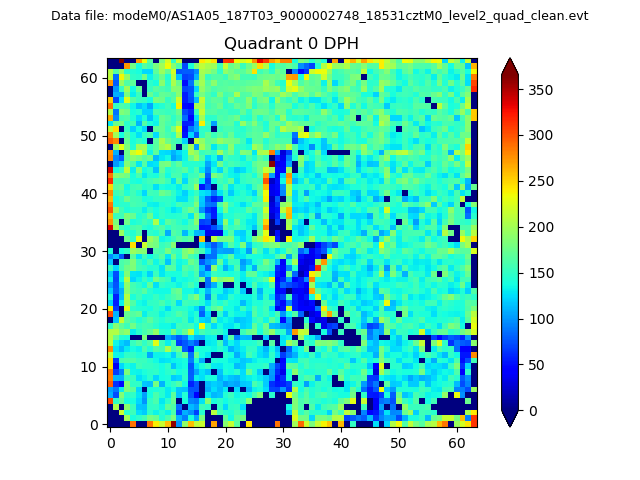 |
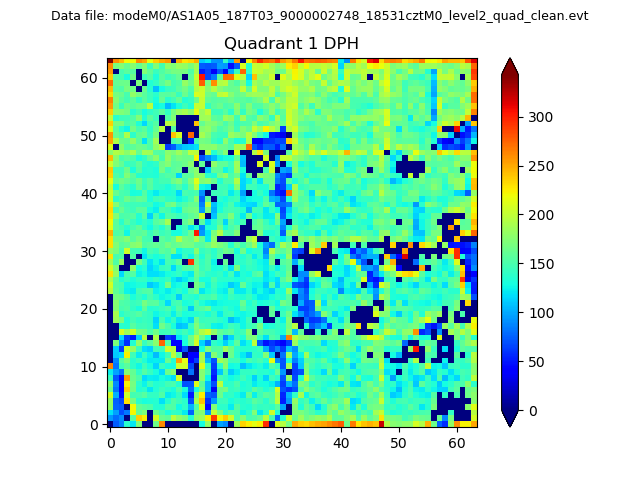 |
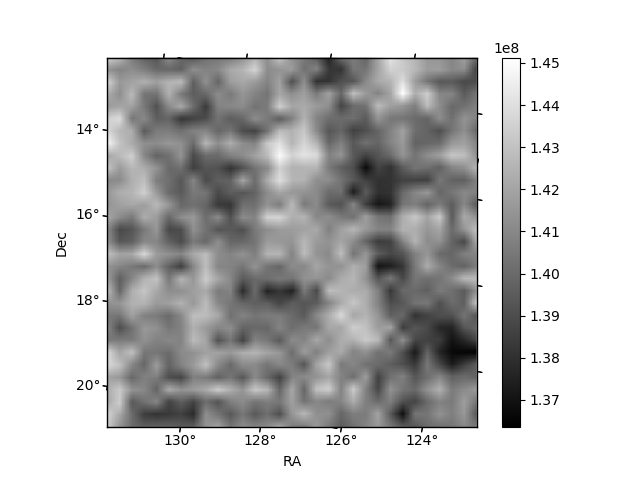
Quadrant B |
|---|---|---|---|
| Quadrant D | 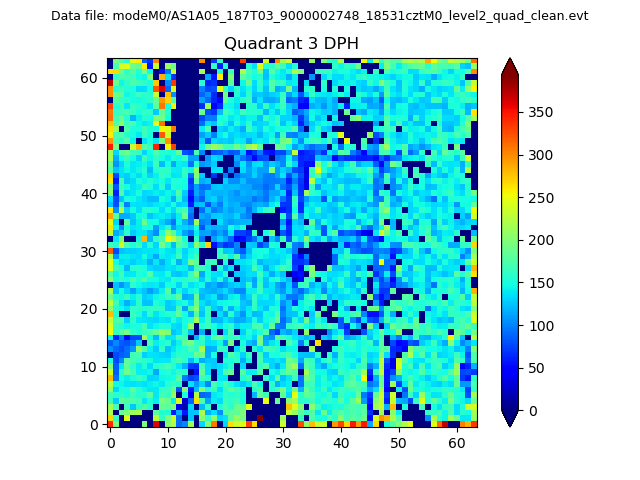 |
 |
Quadrant C |
| Plot type | Count rate plots | Images |
|---|---|---|
| Comparison with Poisson distribution Blue bars denote a histogram of data divided into 1 sec bins. Red curve is a Poisson curve with rate = median count rate of data. |
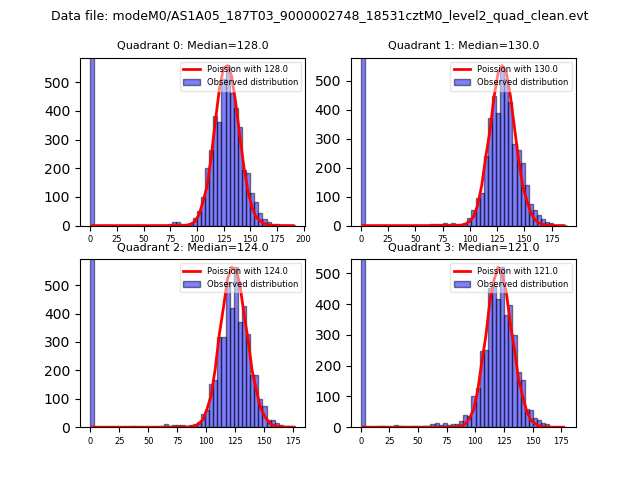 |
 |
| Quadrant-wise count rates Data is divided into 100 sec bins |
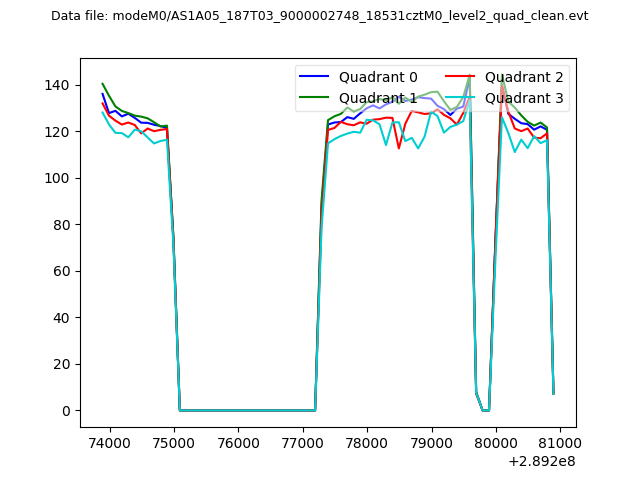 |
|
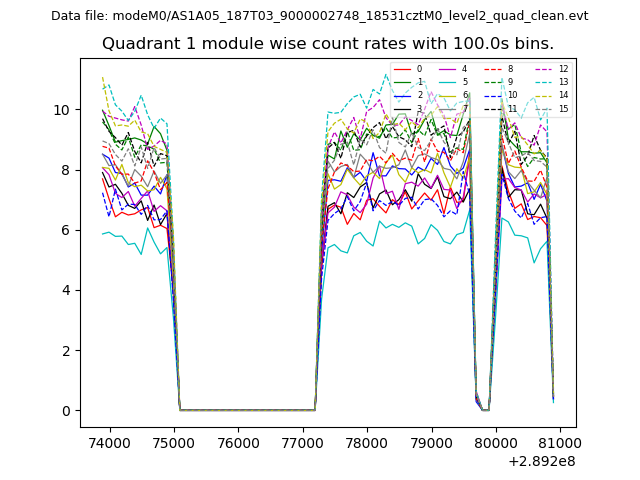
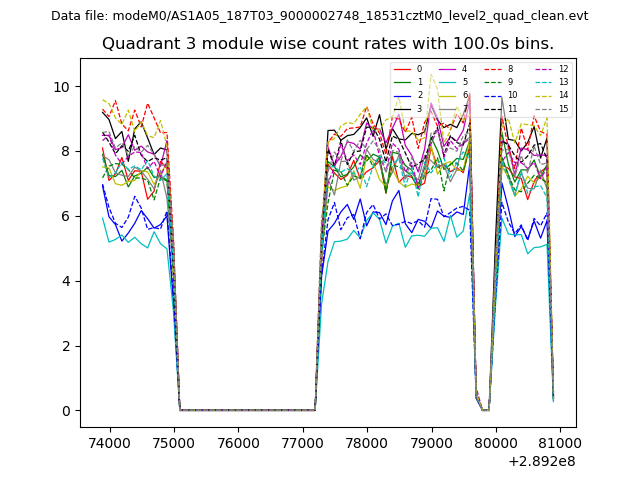
| Module-wise count rates for Quadrant A Data is divided into 100 sec bins |
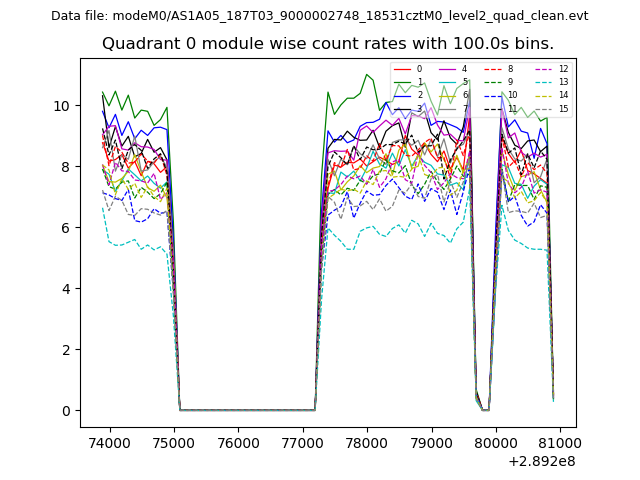 |
 |
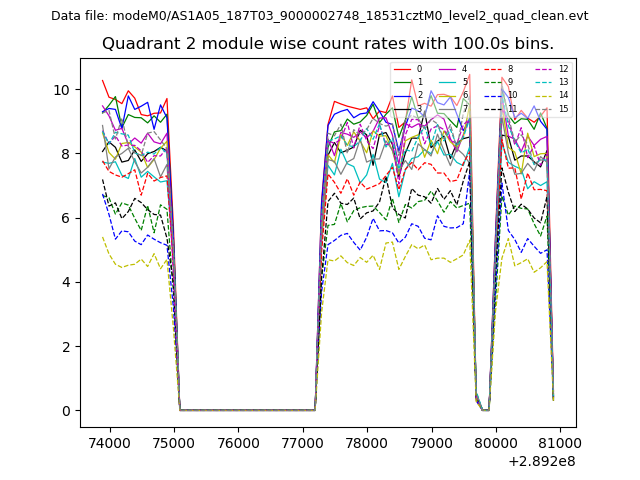
| Module-wise count rates for Quadrant B Data is divided into 100 sec bins |
 |
 |
| Module-wise count rates for Quadrant C Data is divided into 100 sec bins |
 |
 |
| Module-wise count rates for Quadrant D Data is divided into 100 sec bins |
 |
 |
| Parameter | Plot |
|---|---|
| CZT HV Monitor | 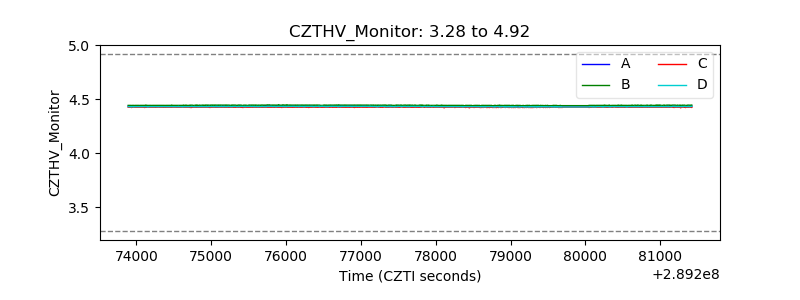 |
| D_VDD | 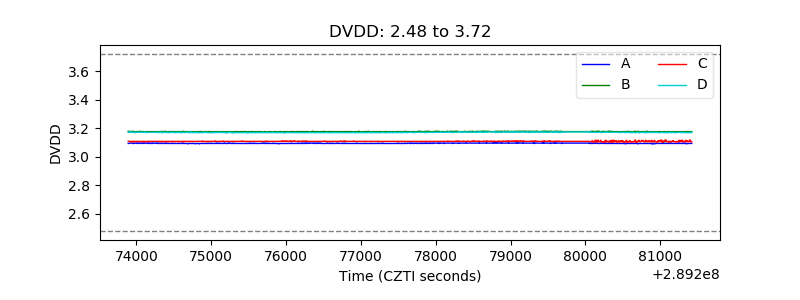 |
| Temperature 1 | 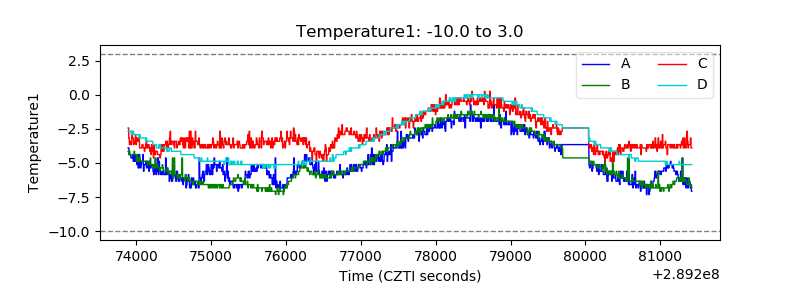 |
| Veto HV Monitor | 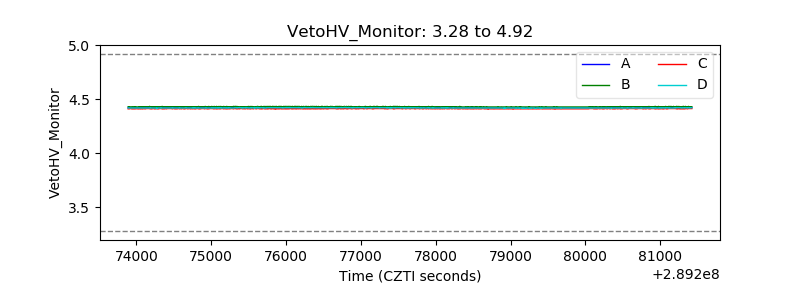 |
| Veto LLD | 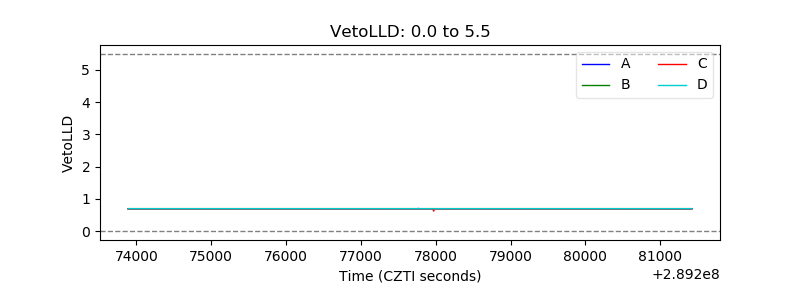 |
| Alpha Counter | 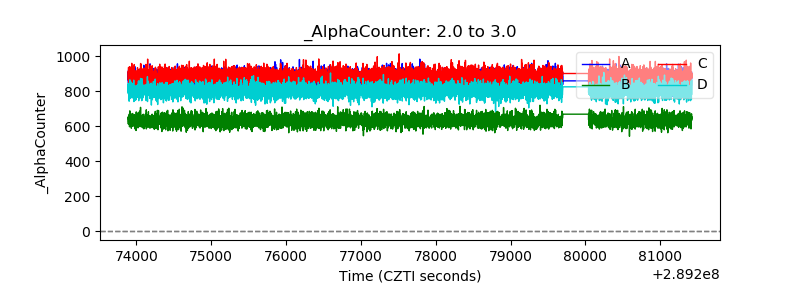 |
| _CPM_Rate | 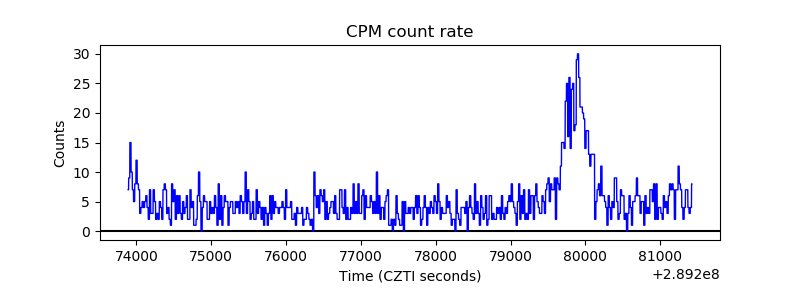 |
| CZT Counter | 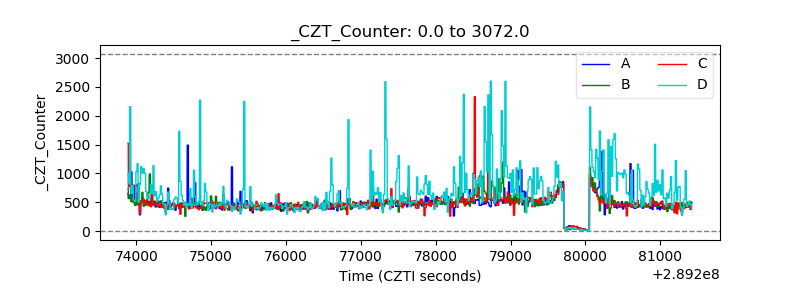 |
| +2.5 Volts monitor | 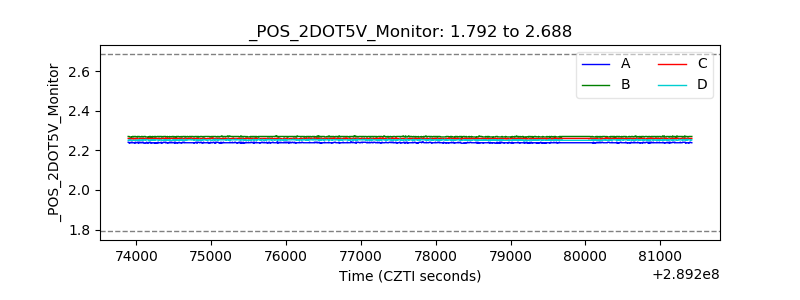 |
| +5 Volts monitor | 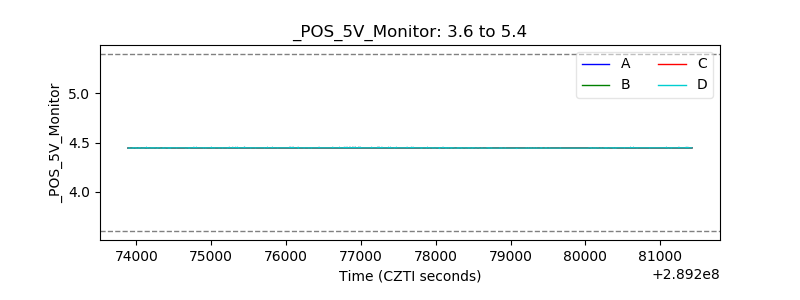 |
| _ROLL_ROT | 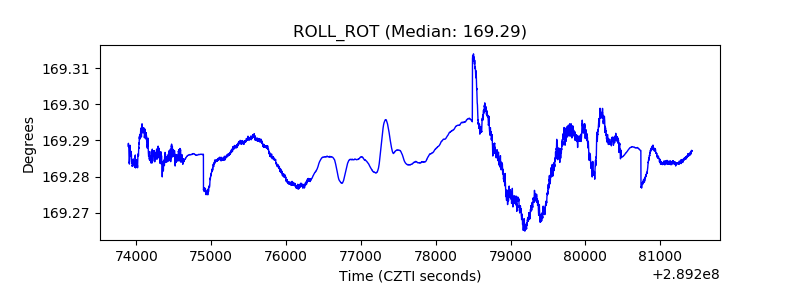 |
| _Roll_DEC | 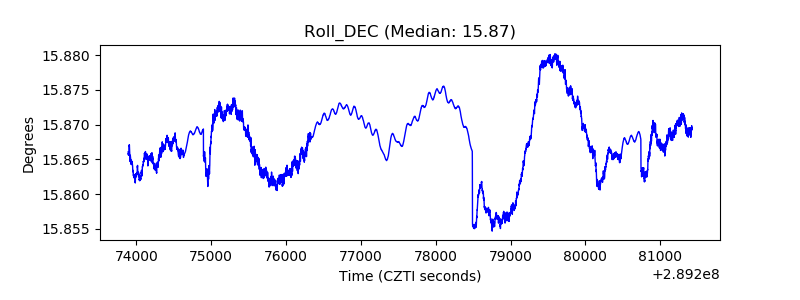 |
| _Roll_RA | 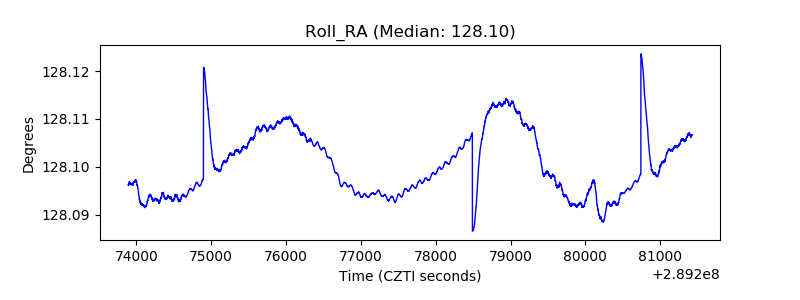 |
| Veto Counter | 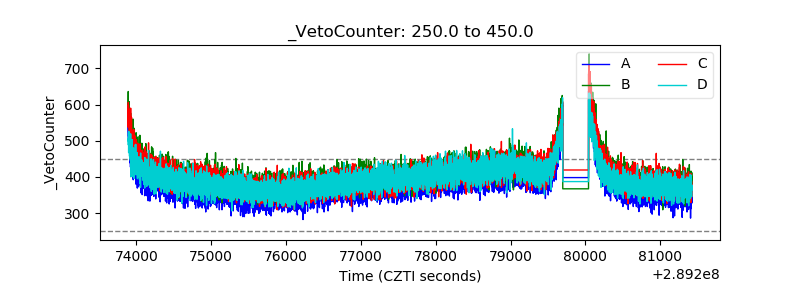 |