| Param | Original file | Final file |
|---|---|---|
| Filename | modeM0/AS1A05_187T03_9000002748_18532cztM0_level2.evt | modeM0/AS1A05_187T03_9000002748_18532cztM0_level2_quad_clean.evt |
| Size (bytes) | 664,300,800 | 100,457,280 |
| Size | 633.5 MB | 95.8 MB |
| Events in quadrant A | 4,133,018 | 632,899 |
| Events in quadrant B | 4,230,559 | 642,576 |
| Events in quadrant C | 4,341,289 | 616,608 |
| Events in quadrant D | 6,854,025 | 575,565 |
| Mode M0 | |||
|---|---|---|---|
| Quadrant | BADHDUFLAG | Total packets | Discarded packets |
| A | 0 | 17717 | 3 |
| B | 0 | 17911 | 2 |
| C | 0 | 18281 | 2 |
| D | 0 | 26100 | 2 |
| Mode SS | |||
|---|---|---|---|
| Quadrant | BADHDUFLAG | Total packets | Discarded packets |
| A | 0 | 170 | 0 |
| B | 0 | 170 | 0 |
| C | 0 | 170 | 0 |
| D | 0 | 170 | 0 |
| Mode M9 | |||
|---|---|---|---|
| Quadrant | BADHDUFLAG | Total packets | Discarded packets |
| A | 0 | 5 | 0 |
| B | 0 | 5 | 0 |
| C | 0 | 5 | 0 |
| D | 0 | 5 | 0 |
| Quadrant | Total seconds | Saturated seconds | Saturation percentage |
|---|---|---|---|
| A | 8259 | 139 | 1.683012% |
| B | 8259 | 215 | 2.603221% |
| C | 8259 | 180 | 2.179441% |
| D | 8260 | 581 | 7.033898% |
Noise dominated data is calculated using 1-second bins in cleaned event files. If a bin has >2000 counts, and if more than 50% of those come from <1% of pixels, then it is considered to be noise-dominated and hence unusable.
| Quadrant | # 1 sec bins | Bins with >0 counts | Bins with >2000 counts | High rate bins dominated by noise | Noise dominated (total time) | Noise dominated (detector-on time) | Marked lightcurve |
|---|---|---|---|---|---|---|---|
| A | 8754 | 8260 | 0 | 0 | 0.00% | 0.00% | 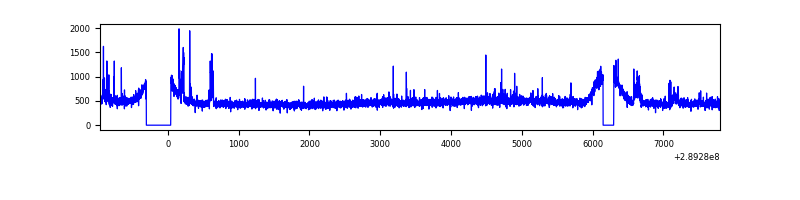 |
| B | 8754 | 8260 | 14 | 14 | 0.16% | 0.17% | 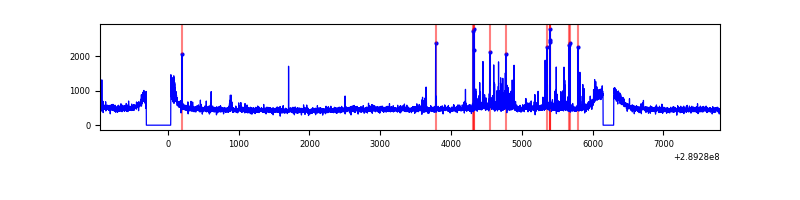 |
| C | 8754 | 8261 | 14 | 14 | 0.16% | 0.17% |  |
| D | 8755 | 8262 | 407 | 407 | 4.65% | 4.93% | 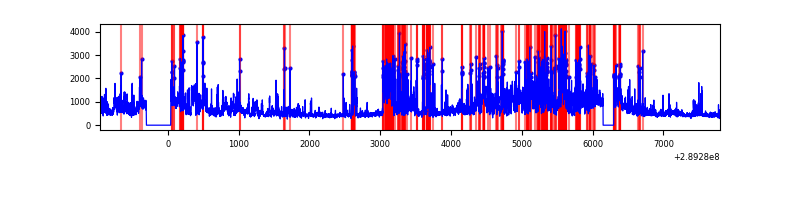 |
Top three noisy pixels from each quadrant. If the there are fewer than three noisy pixels in the level2.evt file, extra rows are filled as -1
| Pixel properties | Quadrant properties | ||||||
|---|---|---|---|---|---|---|---|
| Quadrant | DetID | PixID | Counts | Sigma | Mean | Median | Sigma |
| A | 0 | 13 | 90834 | 430.43 | 1021 | 997 | 208.7 |
| A | 15 | 174 | 70139 | 331.28 | 1021 | 997 | 208.7 |
| A | 15 | 192 | 25686 | 118.29 | 1021 | 997 | 208.7 |
| B | 7 | 220 | 142111 | 701.1 | 1022 | 993 | 201.3 |
| B | 0 | 197 | 25031 | 119.42 | 1022 | 993 | 201.3 |
| B | 12 | 111 | 24287 | 115.73 | 1022 | 993 | 201.3 |
| C | 3 | 233 | 194680 | 831.76 | 980 | 986 | 232.9 |
| C | 0 | 207 | 160845 | 686.46 | 980 | 986 | 232.9 |
| C | 14 | 238 | 150062 | 640.16 | 980 | 986 | 232.9 |
| D | 13 | 168 | 1851064 | 7762.9 | 968 | 937 | 238.3 |
| D | 1 | 52 | 690621 | 2893.83 | 968 | 937 | 238.3 |
| D | 15 | 0 | 342127 | 1431.59 | 968 | 937 | 238.3 |
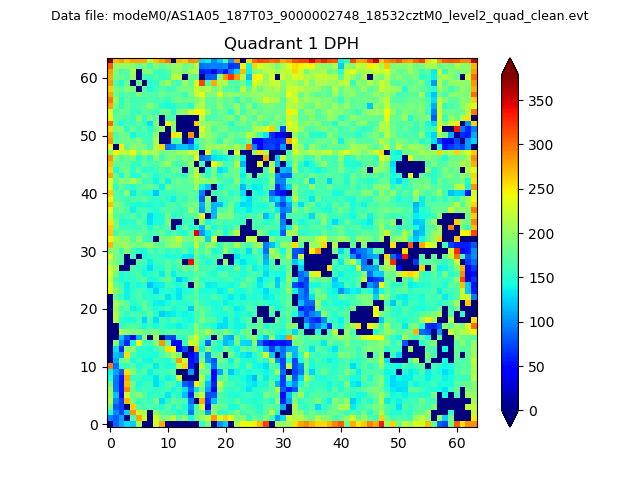
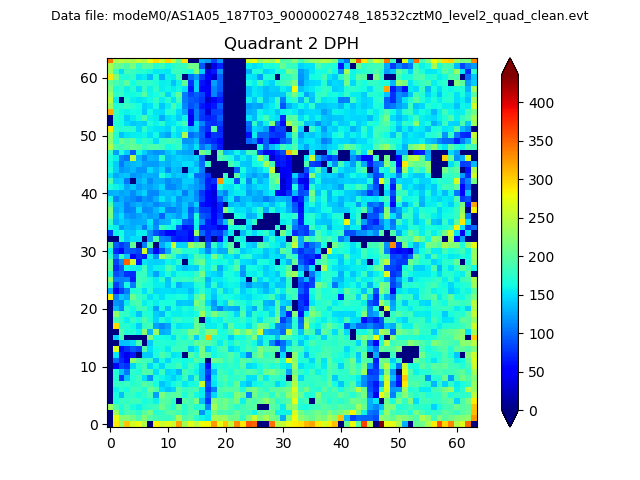
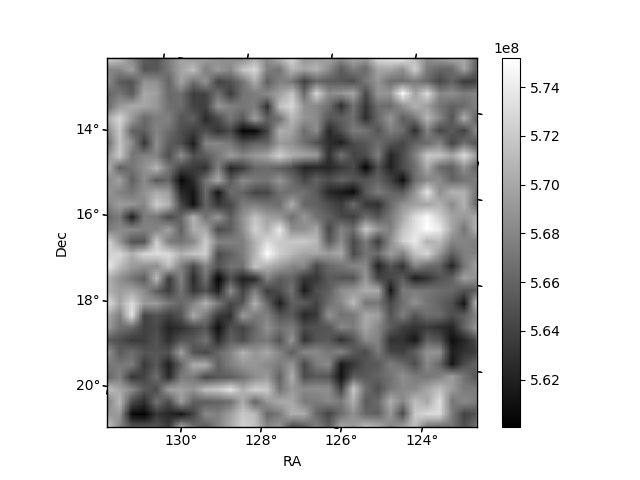
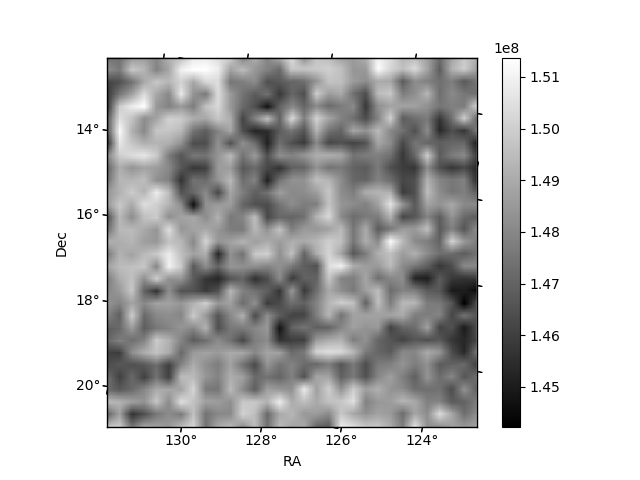
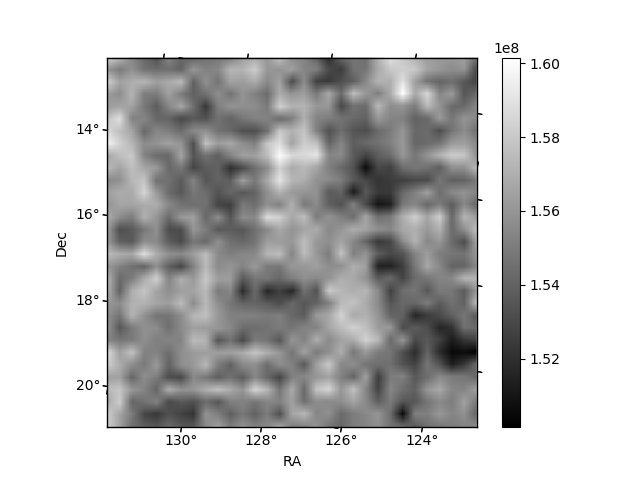
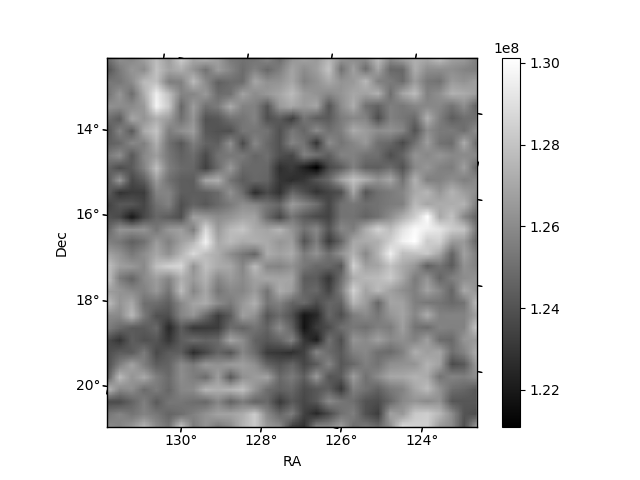
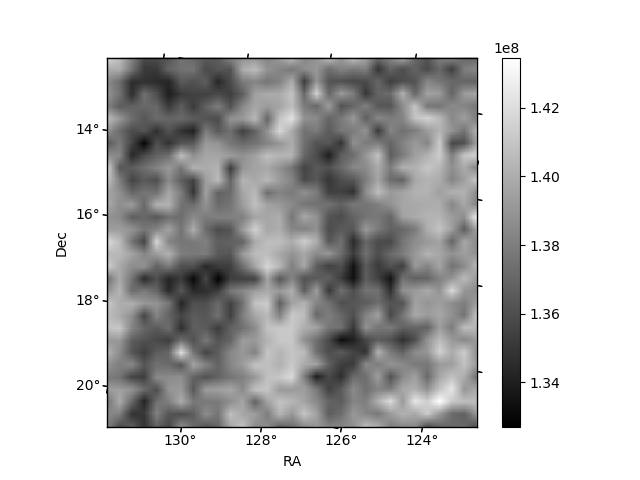
Histogram calculated using DETX and DETY for each event in the final _common_clean file
| Quadrant A | 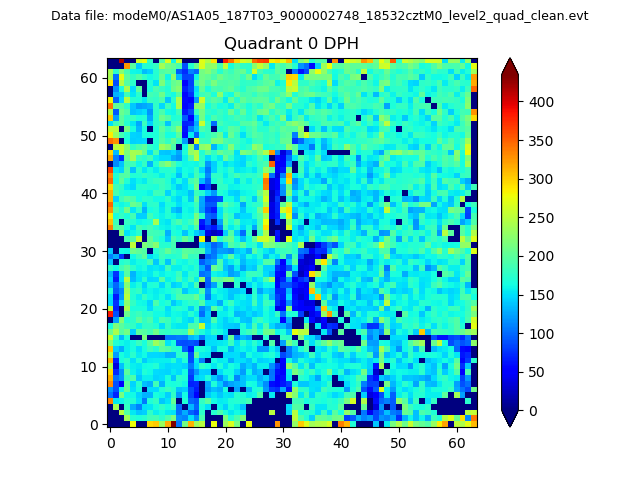 |
 |
Quadrant B |
|---|---|---|---|
| Quadrant D | 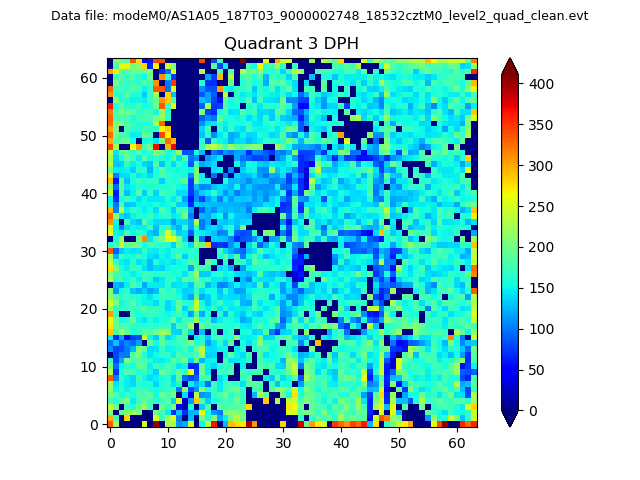 |
 |
Quadrant C |
| Plot type | Count rate plots | Images |
|---|---|---|
| Comparison with Poisson distribution Blue bars denote a histogram of data divided into 1 sec bins. Red curve is a Poisson curve with rate = median count rate of data. |
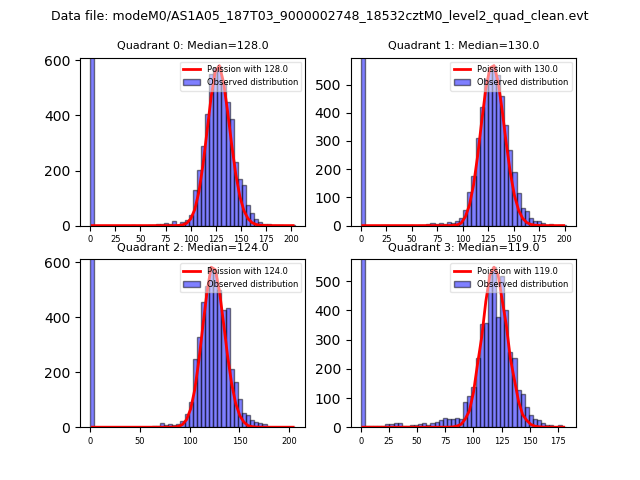 |
 |
| Quadrant-wise count rates Data is divided into 100 sec bins |
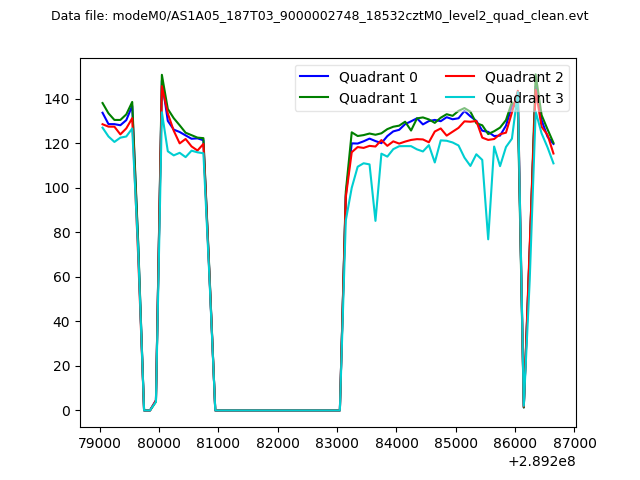 |
|
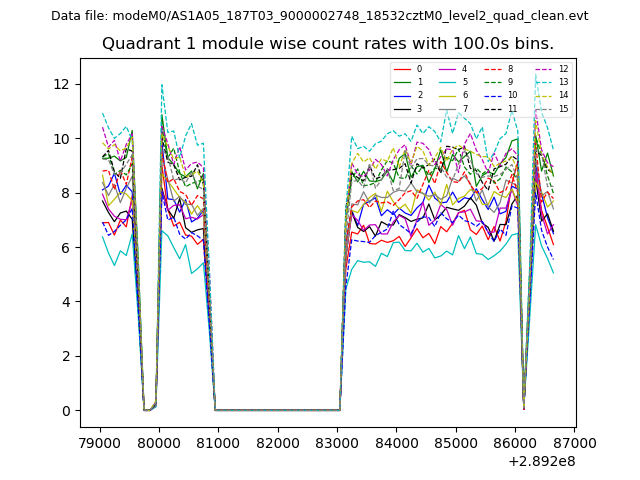
| Module-wise count rates for Quadrant A Data is divided into 100 sec bins |
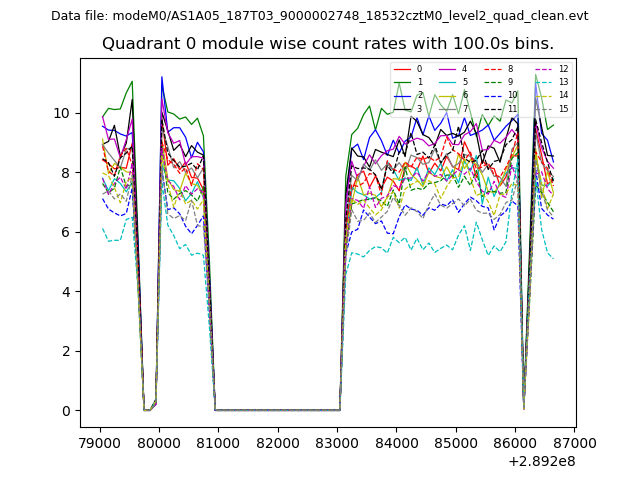 |
 |
| Module-wise count rates for Quadrant B Data is divided into 100 sec bins |
 |
 |
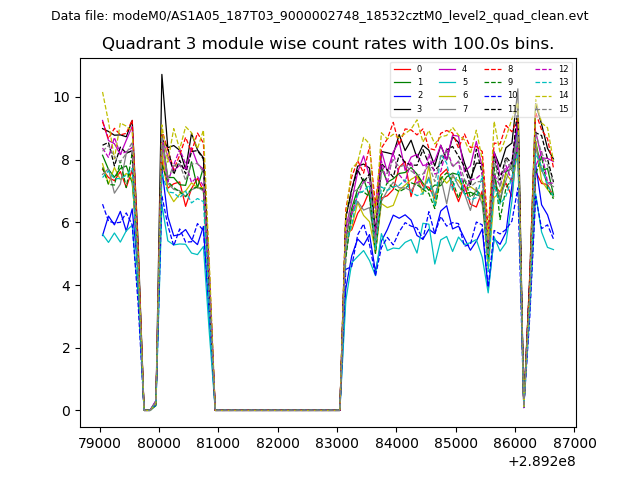
| Module-wise count rates for Quadrant C Data is divided into 100 sec bins |
 |
 |
| Module-wise count rates for Quadrant D Data is divided into 100 sec bins |
 |
 |
| Parameter | Plot |
|---|---|
| CZT HV Monitor | 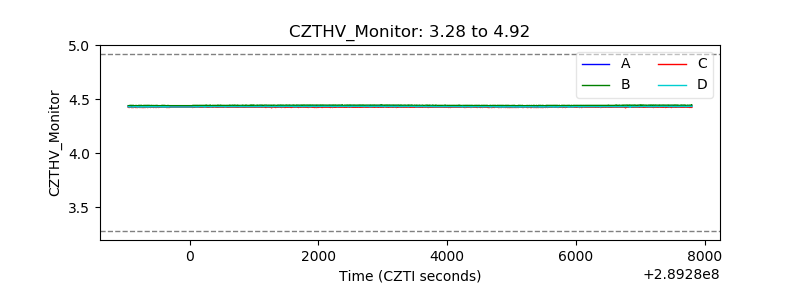 |
| D_VDD | 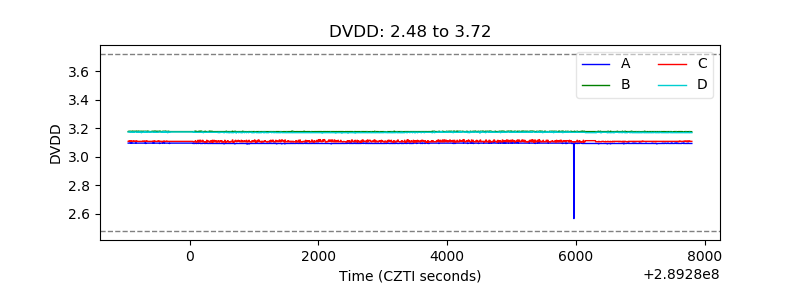 |
| Temperature 1 | 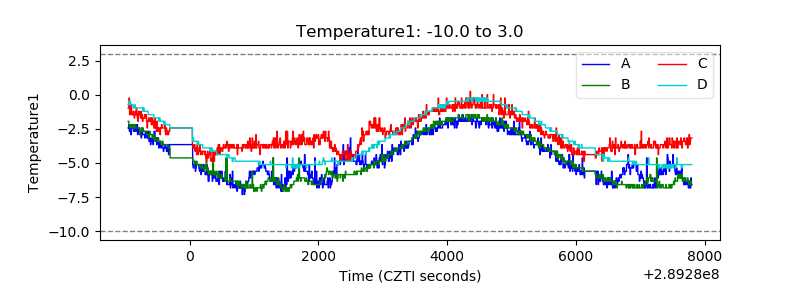 |
| Veto HV Monitor | 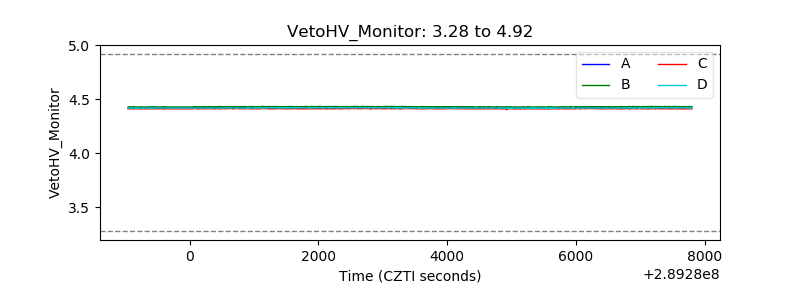 |
| Veto LLD | 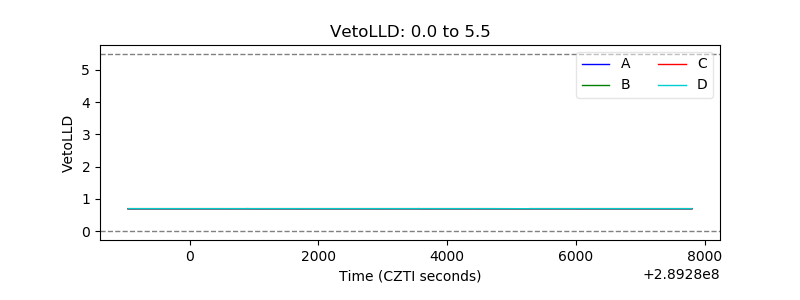 |
| Alpha Counter | 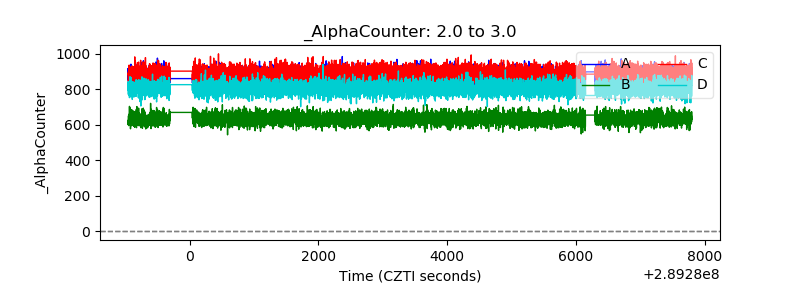 |
| _CPM_Rate | 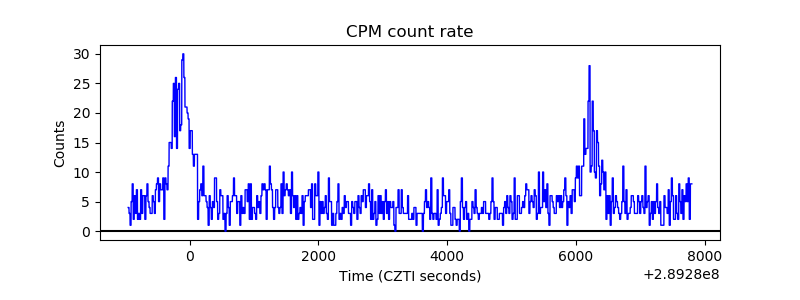 |
| CZT Counter | 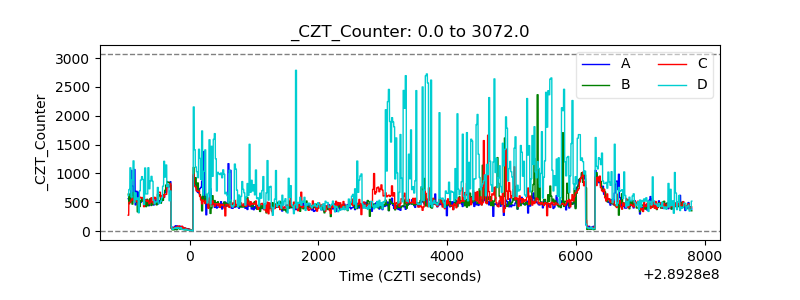 |
| +2.5 Volts monitor | 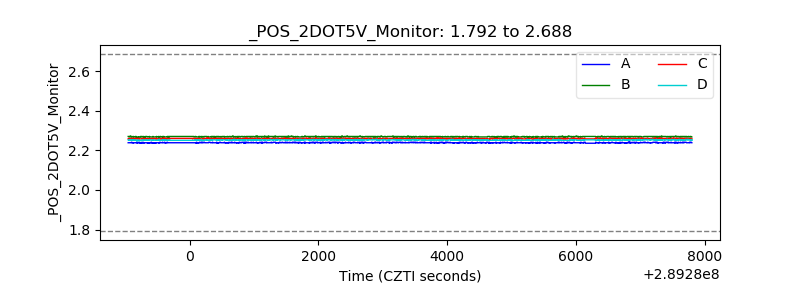 |
| +5 Volts monitor |  |
| _ROLL_ROT | 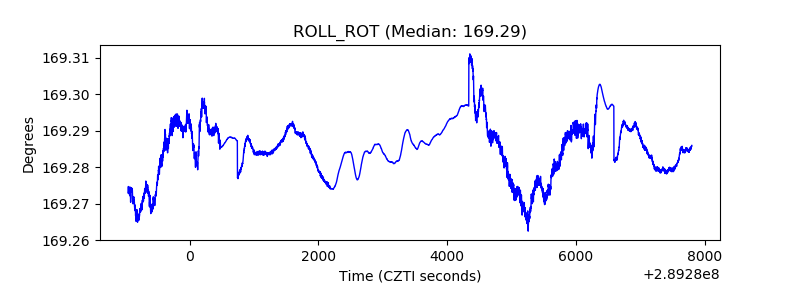 |
| _Roll_DEC | 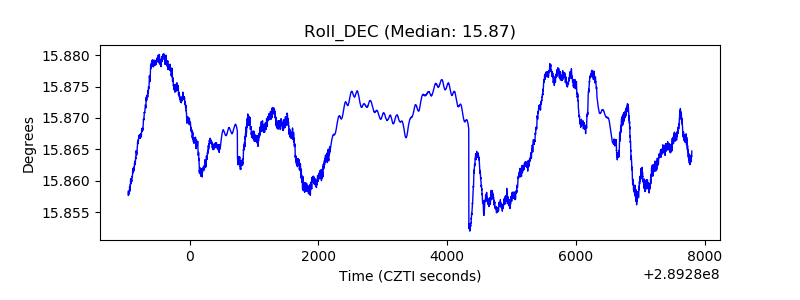 |
| _Roll_RA |  |
| Veto Counter | 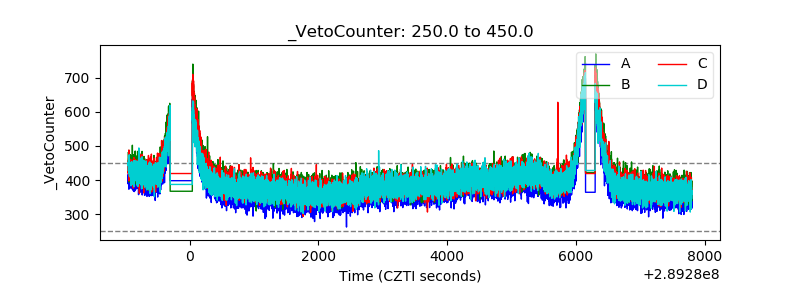 |