| Param | Original file | Final file |
|---|---|---|
| Filename | modeM0/AS1A05_187T03_9000002748_18533cztM0_level2.evt | modeM0/AS1A05_187T03_9000002748_18533cztM0_level2_quad_clean.evt |
| Size (bytes) | 377,193,600 | 52,914,240 |
| Size | 359.7 MB | 50.5 MB |
| Events in quadrant A | 2,367,197 | 325,763 |
| Events in quadrant B | 2,390,000 | 329,626 |
| Events in quadrant C | 2,321,424 | 317,753 |
| Events in quadrant D | 4,013,888 | 287,760 |
| Mode M0 | |||
|---|---|---|---|
| Quadrant | BADHDUFLAG | Total packets | Discarded packets |
| A | 0 | 10291 | 1 |
| B | 0 | 10301 | 1 |
| C | 0 | 10162 | 1 |
| D | 0 | 15290 | 1 |
| Mode SS | |||
|---|---|---|---|
| Quadrant | BADHDUFLAG | Total packets | Discarded packets |
| A | 0 | 98 | 0 |
| B | 0 | 98 | 0 |
| C | 0 | 98 | 0 |
| D | 0 | 98 | 0 |
| Mode M9 | |||
|---|---|---|---|
| Quadrant | BADHDUFLAG | Total packets | Discarded packets |
| A | 0 | 2 | 0 |
| B | 0 | 2 | 0 |
| C | 0 | 2 | 0 |
| D | 0 | 2 | 0 |
| Quadrant | Total seconds | Saturated seconds | Saturation percentage |
|---|---|---|---|
| A | 4860 | 113 | 2.325103% |
| B | 4860 | 148 | 3.045267% |
| C | 4860 | 114 | 2.345679% |
| D | 4861 | 561 | 11.540835% |
Noise dominated data is calculated using 1-second bins in cleaned event files. If a bin has >2000 counts, and if more than 50% of those come from <1% of pixels, then it is considered to be noise-dominated and hence unusable.
| Quadrant | # 1 sec bins | Bins with >0 counts | Bins with >2000 counts | High rate bins dominated by noise | Noise dominated (total time) | Noise dominated (detector-on time) | Marked lightcurve |
|---|---|---|---|---|---|---|---|
| A | 5010 | 4860 | 0 | 0 | 0.00% | 0.00% | 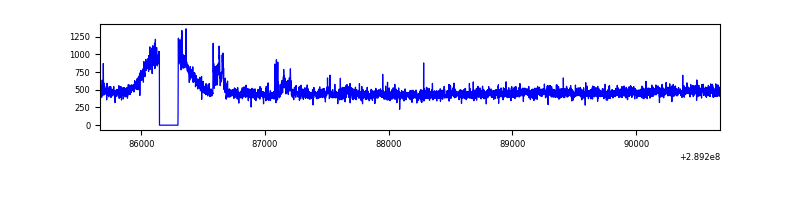 |
| B | 5010 | 4860 | 2 | 2 | 0.04% | 0.04% | 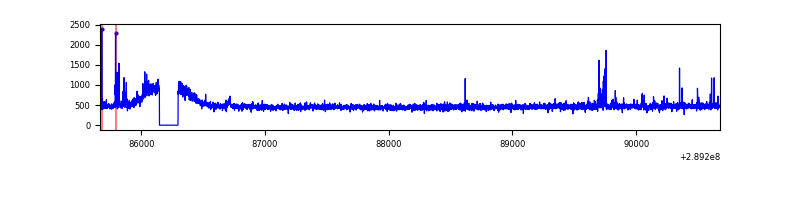 |
| C | 5010 | 4861 | 0 | 0 | 0.00% | 0.00% | 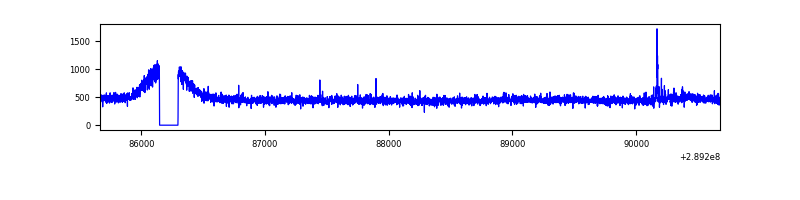 |
| D | 5011 | 4862 | 434 | 434 | 8.66% | 8.93% | 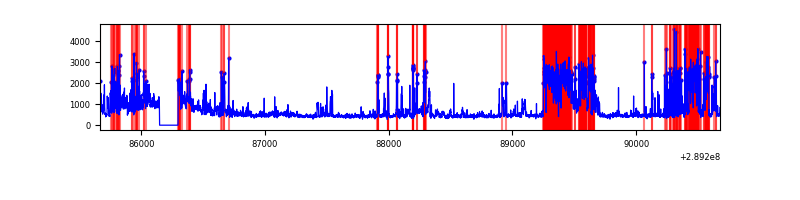 |
Top three noisy pixels from each quadrant. If the there are fewer than three noisy pixels in the level2.evt file, extra rows are filled as -1
| Pixel properties | Quadrant properties | ||||||
|---|---|---|---|---|---|---|---|
| Quadrant | DetID | PixID | Counts | Sigma | Mean | Median | Sigma |
| A | 0 | 13 | 56407 | 450.25 | 596 | 579 | 124.0 |
| A | 13 | 254 | 7676 | 57.23 | 596 | 579 | 124.0 |
| A | 0 | 226 | 5205 | 37.31 | 596 | 579 | 124.0 |
| B | 4 | 80 | 16583 | 135.53 | 595 | 580 | 118.1 |
| B | 0 | 197 | 16425 | 134.2 | 595 | 580 | 118.1 |
| B | 12 | 111 | 14269 | 115.94 | 595 | 580 | 118.1 |
| C | 14 | 238 | 86866 | 630.94 | 569 | 572 | 136.8 |
| C | 0 | 207 | 14392 | 101.04 | 569 | 572 | 136.8 |
| C | 13 | 61 | 3986 | 24.96 | 569 | 572 | 136.8 |
| D | 7 | 238 | 833194 | 6038.91 | 555 | 537 | 137.9 |
| D | 1 | 52 | 397953 | 2882.29 | 555 | 537 | 137.9 |
| D | 13 | 168 | 392565 | 2843.21 | 555 | 537 | 137.9 |
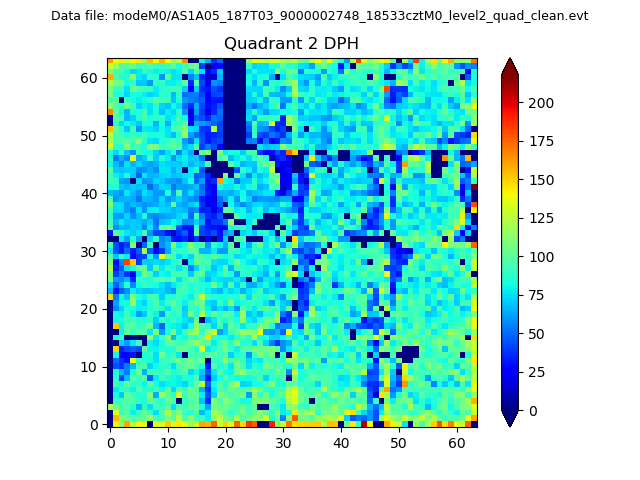
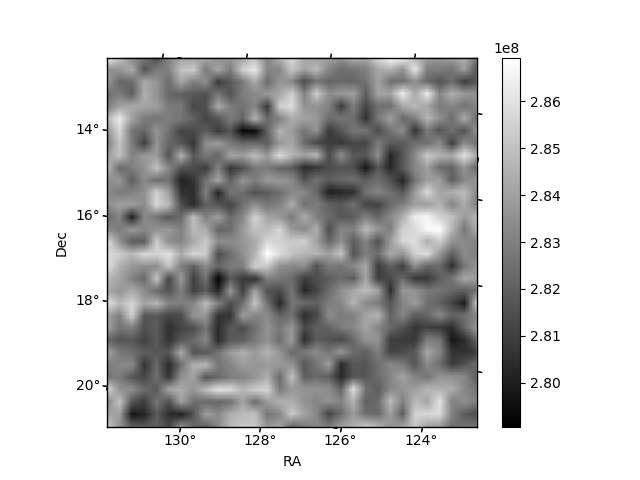
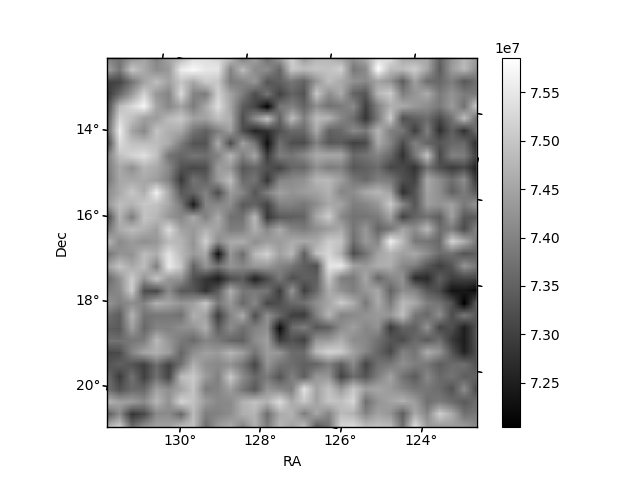
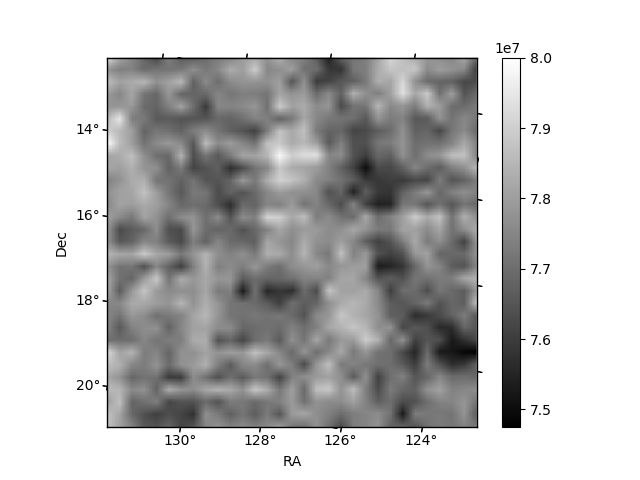
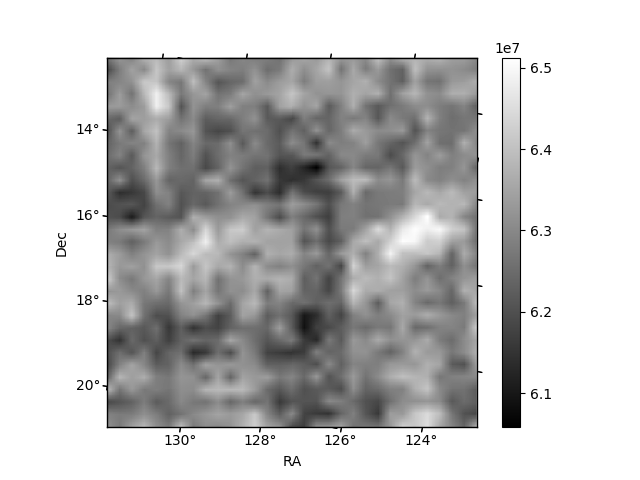
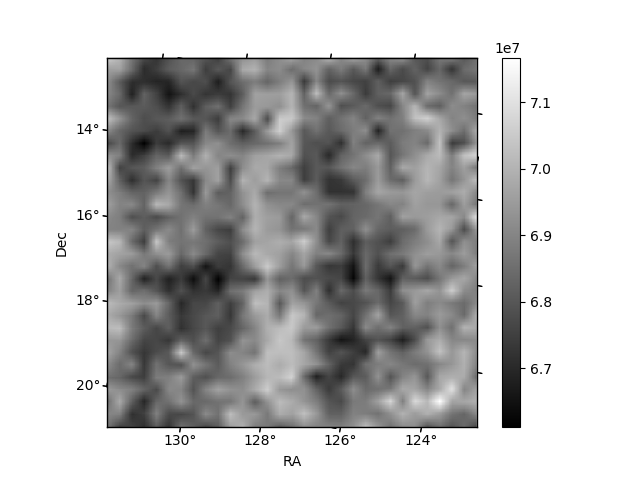
Histogram calculated using DETX and DETY for each event in the final _common_clean file
| Quadrant A | 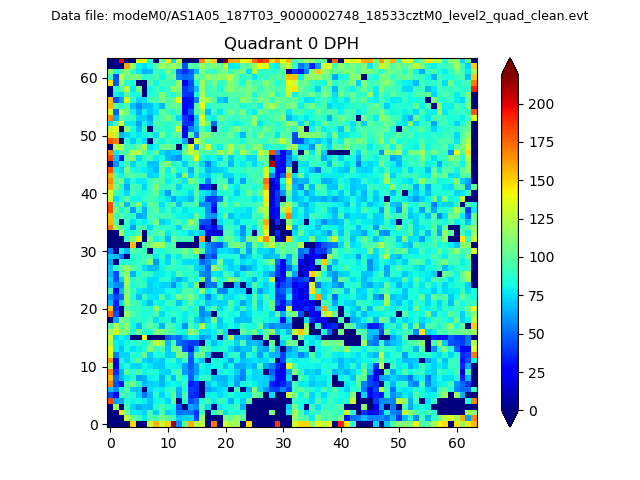 |
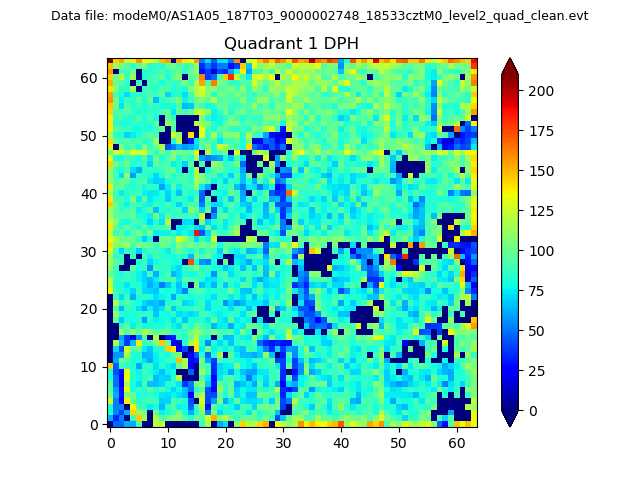 |
Quadrant B |
|---|---|---|---|
| Quadrant D | 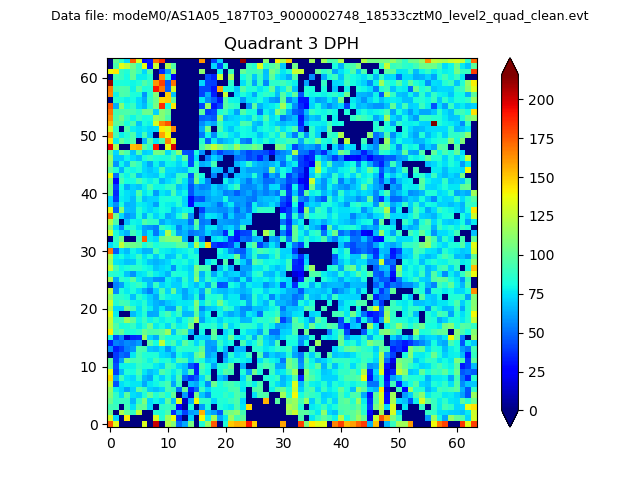 |
 |
Quadrant C |
| Plot type | Count rate plots | Images |
|---|---|---|
| Comparison with Poisson distribution Blue bars denote a histogram of data divided into 1 sec bins. Red curve is a Poisson curve with rate = median count rate of data. |
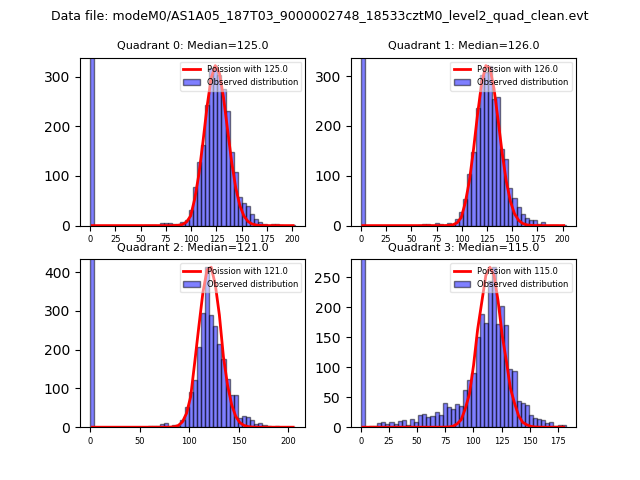 |
 |
| Quadrant-wise count rates Data is divided into 100 sec bins |
 |
|
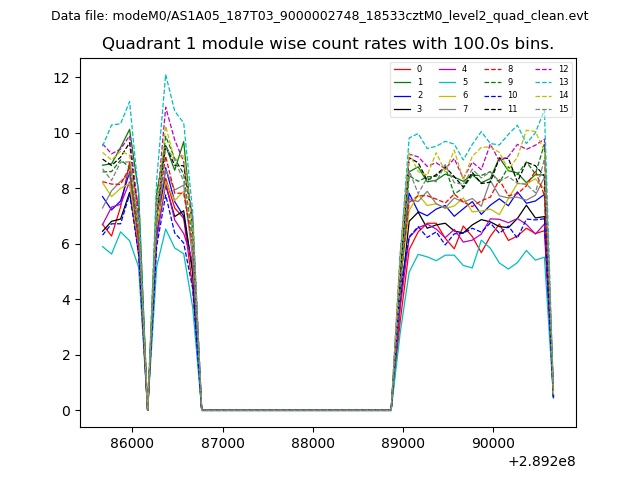
| Module-wise count rates for Quadrant A Data is divided into 100 sec bins |
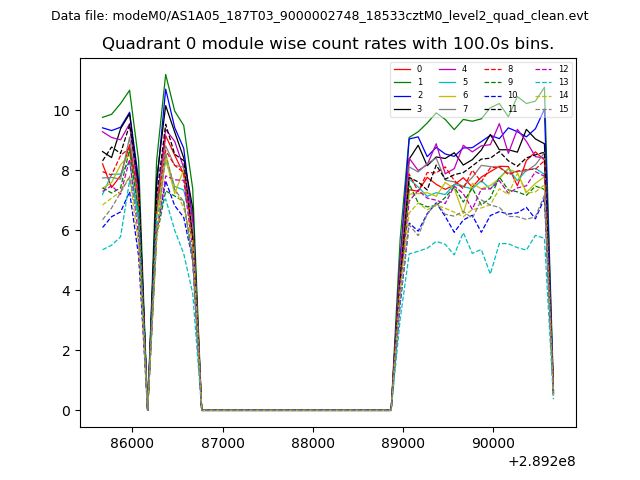 |
 |
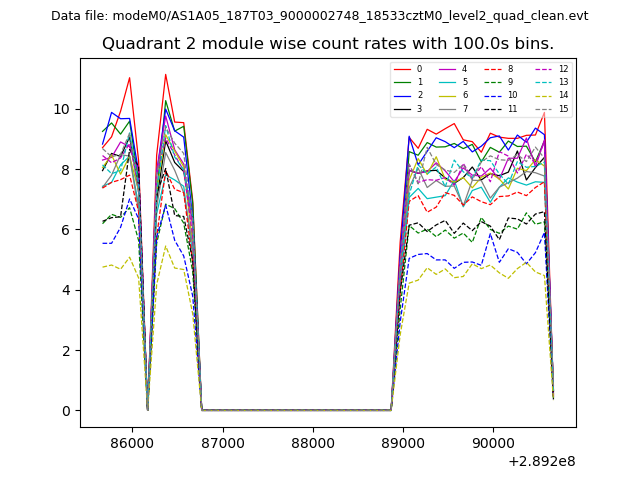
| Module-wise count rates for Quadrant B Data is divided into 100 sec bins |
 |
 |
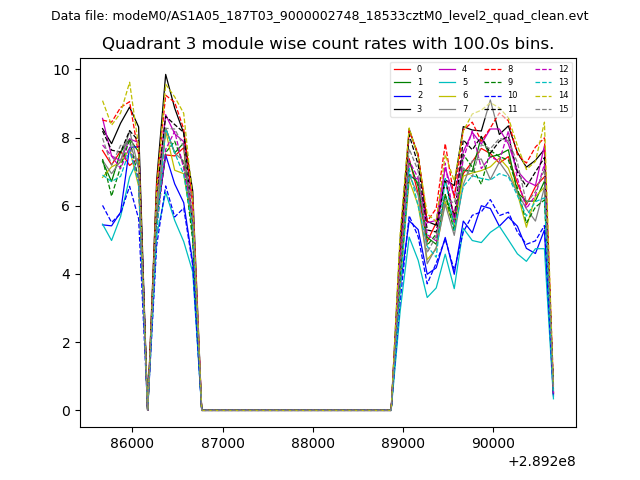
| Module-wise count rates for Quadrant C Data is divided into 100 sec bins |
 |
 |
| Module-wise count rates for Quadrant D Data is divided into 100 sec bins |
 |
 |
| Parameter | Plot |
|---|---|
| CZT HV Monitor | 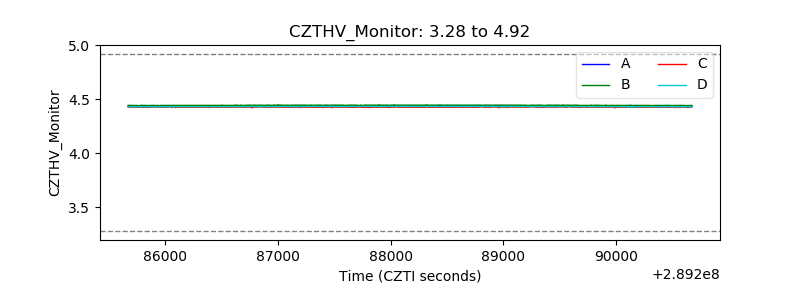 |
| D_VDD | 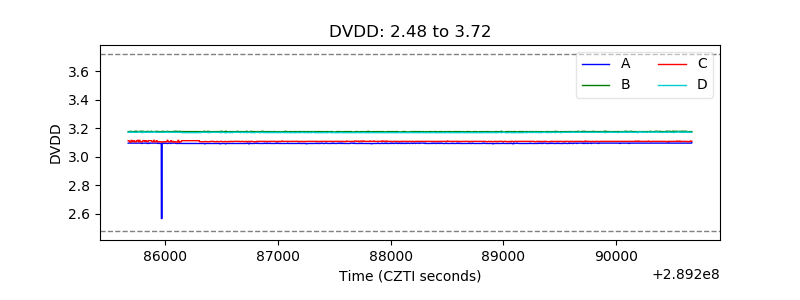 |
| Temperature 1 | 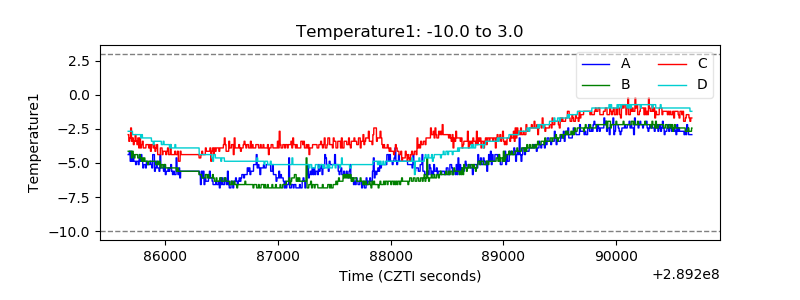 |
| Veto HV Monitor |  |
| Veto LLD |  |
| Alpha Counter | 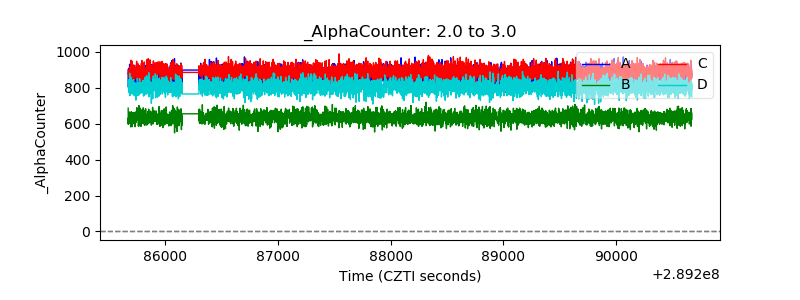 |
| _CPM_Rate | 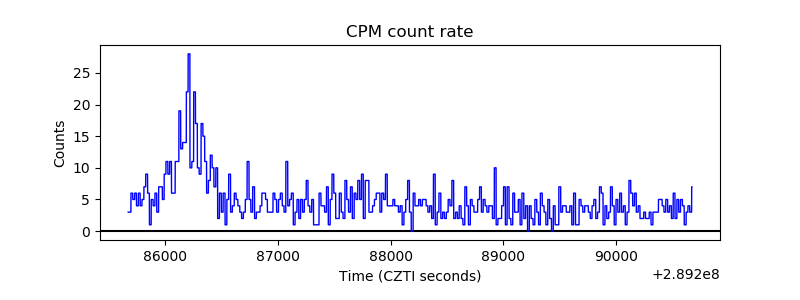 |
| CZT Counter | 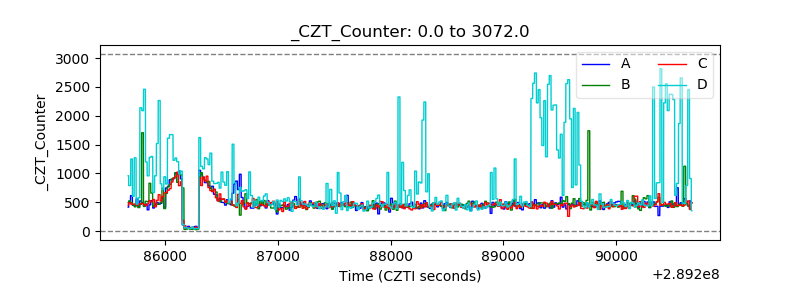 |
| +2.5 Volts monitor | 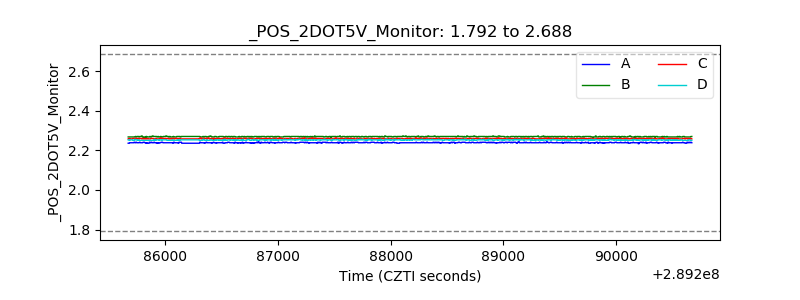 |
| +5 Volts monitor |  |
| _ROLL_ROT | 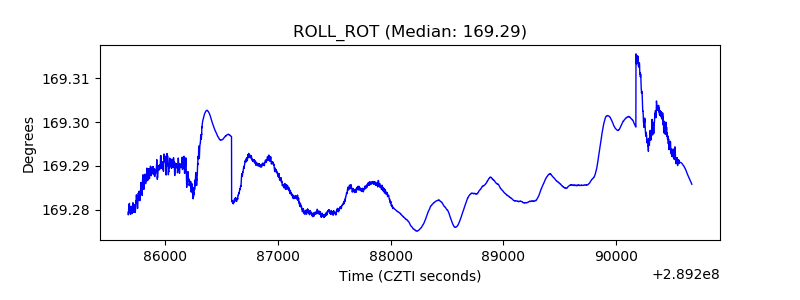 |
| _Roll_DEC |  |
| _Roll_RA | 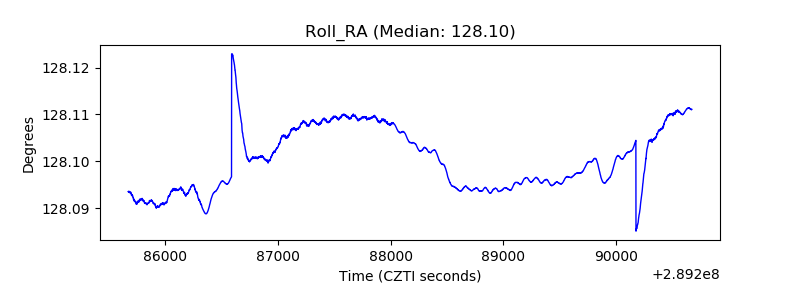 |
| Veto Counter | 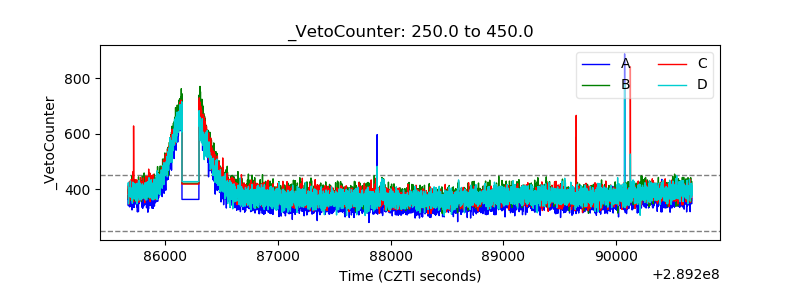 |