| Param | Original file | Final file |
|---|---|---|
| Filename | modeM0/AS1A05_212T07_9000002746cztM0_level2.fits | modeM0/AS1A05_212T07_9000002746cztM0_level2_quad_clean.evt |
| Size (bytes) | 187,637,760 | 194,693,760 |
| Size | 178.9 MB | 185.7 MB |
| Events in quadrant A | 1,144,618 | 1,174,239 |
| Events in quadrant B | 1,116,350 | 1,193,495 |
| Events in quadrant C | 1,131,016 | 1,148,510 |
| Events in quadrant D | 972,734 | 1,061,727 |
| Mode M9 | |||
|---|---|---|---|
| Quadrant | BADHDUFLAG | Total packets | Discarded packets |
| A | 0 | 38 | 0 |
| B | 0 | 38 | 0 |
| C | 0 | 38 | 0 |
| D | 0 | 38 | 0 |
| Mode M0 | |||
|---|---|---|---|
| Quadrant | BADHDUFLAG | Total packets | Discarded packets |
| A | 0 | 41641 | 0 |
| B | 0 | 40553 | 0 |
| C | 0 | 39918 | 0 |
| D | 0 | 44196 | 0 |
| Mode SS | |||
|---|---|---|---|
| Quadrant | BADHDUFLAG | Total packets | Discarded packets |
| A | 0 | 392 | 0 |
| B | 0 | 392 | 0 |
| C | 0 | 392 | 0 |
| D | 0 | 392 | 0 |
| Quadrant | Total seconds | Saturated seconds | Saturation percentage |
|---|---|---|---|
| A | 19126 | 311 | 1.626059% |
| B | 19126 | 242 | 1.265293% |
| C | 19126 | 282 | 1.474433% |
| D | 19126 | 569 | 2.975008% |
Noise dominated data is calculated using 1-second bins in cleaned event files. If a bin has >2000 counts, and if more than 50% of those come from <1% of pixels, then it is considered to be noise-dominated and hence unusable.
| Quadrant | # 1 sec bins | Bins with >0 counts | Bins with >2000 counts | High rate bins dominated by noise | Noise dominated (total time) | Noise dominated (detector-on time) | Marked lightcurve |
|---|---|---|---|---|---|---|---|
| A | 22976 | 19112 | 0 | 0 | 0.00% | 0.00% | 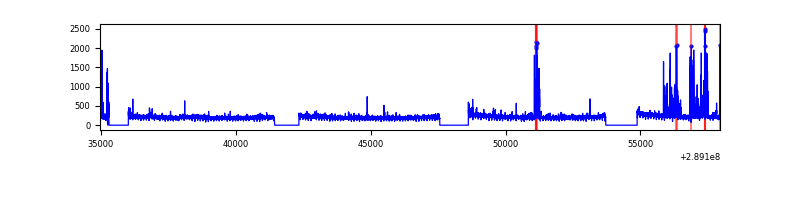 |
| B | 22976 | 19122 | 0 | 0 | 0.00% | 0.00% | 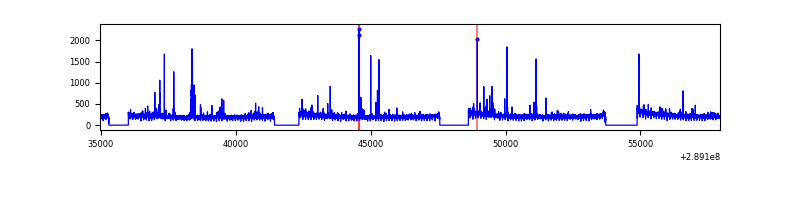 |
| C | 22975 | 19121 | 0 | 0 | 0.00% | 0.00% | 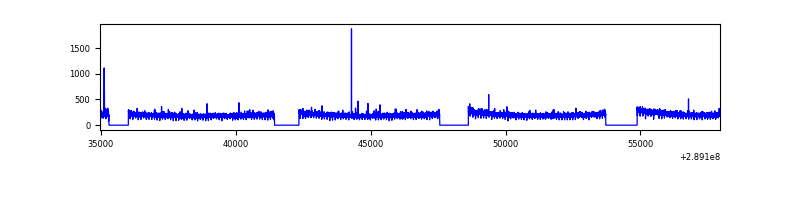 |
| D | 22976 | 19121 | 0 | 0 | 0.00% | 0.00% | 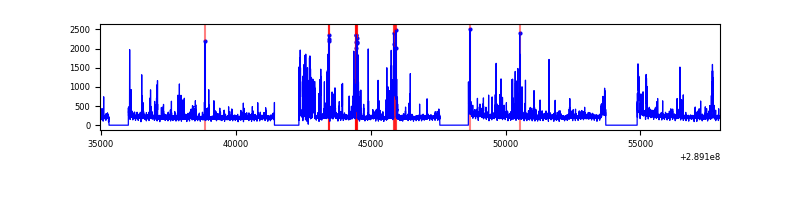 |
Top three noisy pixels from each quadrant. If the there are fewer than three noisy pixels in the level2.evt file, extra rows are filled as -1
| Pixel properties | Quadrant properties | ||||||
|---|---|---|---|---|---|---|---|
| Quadrant | DetID | PixID | Counts | Sigma | Mean | Median | Sigma |
| A | 0 | 29 | 985 | 9.43 | 298 | 280 | 74.8 |
| A | 7 | 110 | 911 | 8.44 | 298 | 280 | 74.8 |
| A | 9 | 19 | 864 | 7.81 | 298 | 280 | 74.8 |
| B | 2 | 9 | 911 | 10.27 | 295 | 282 | 61.2 |
| B | 2 | 8 | 780 | 8.13 | 295 | 282 | 61.2 |
| B | 5 | 128 | 728 | 7.28 | 295 | 282 | 61.2 |
| C | 1 | 81 | 908 | 8.0 | 298 | 278 | 78.7 |
| C | 1 | 80 | 871 | 7.53 | 298 | 278 | 78.7 |
| C | 12 | 241 | 792 | 6.53 | 298 | 278 | 78.7 |
| D | 10 | 190 | 727 | 6.2 | 277 | 251 | 76.7 |
| D | 10 | 189 | 698 | 5.83 | 277 | 251 | 76.7 |
| D | 6 | 231 | 683 | 5.63 | 277 | 251 | 76.7 |
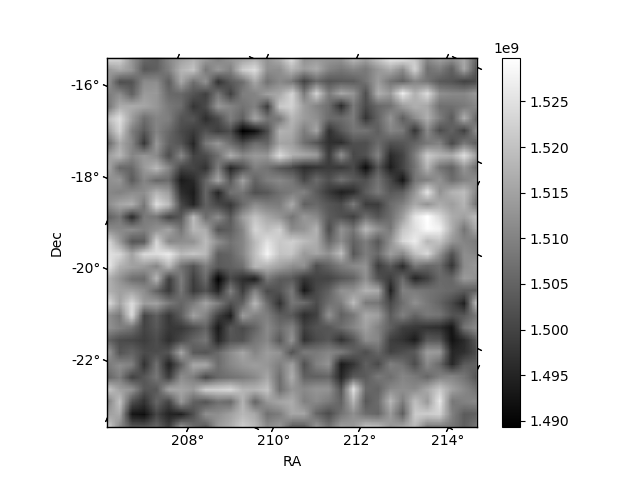
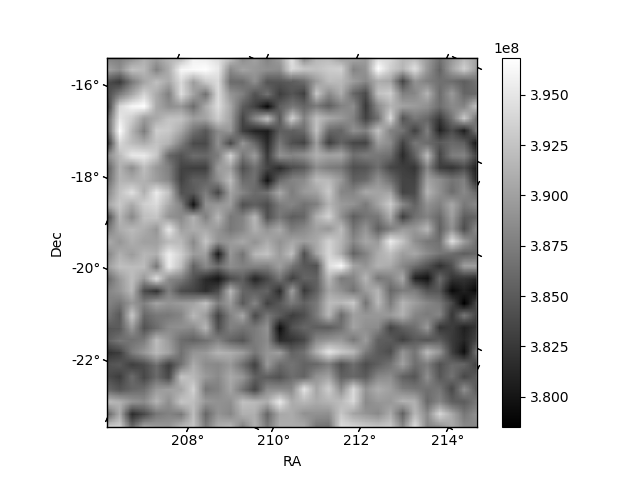
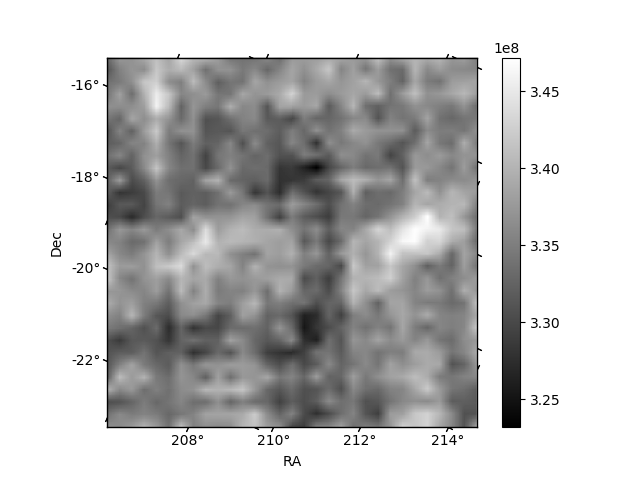
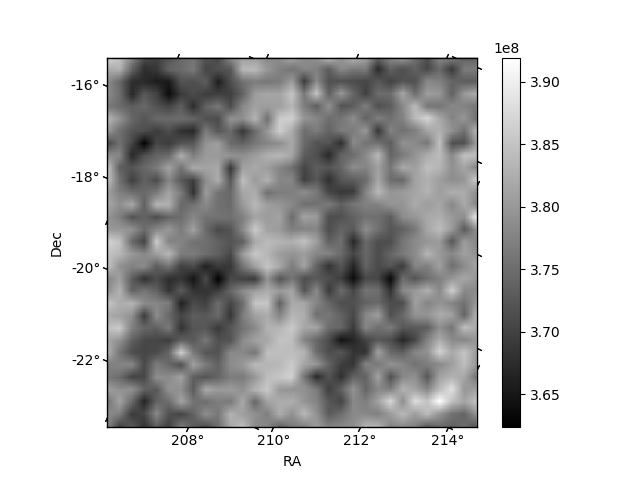
Histogram calculated using DETX and DETY for each event in the final _common_clean file
| Quadrant A | 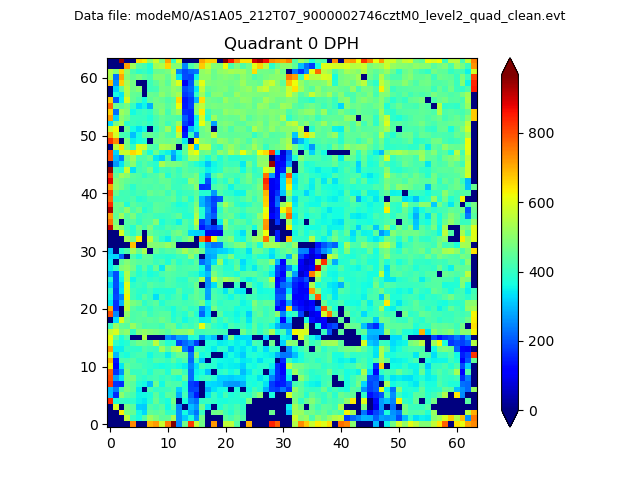 |
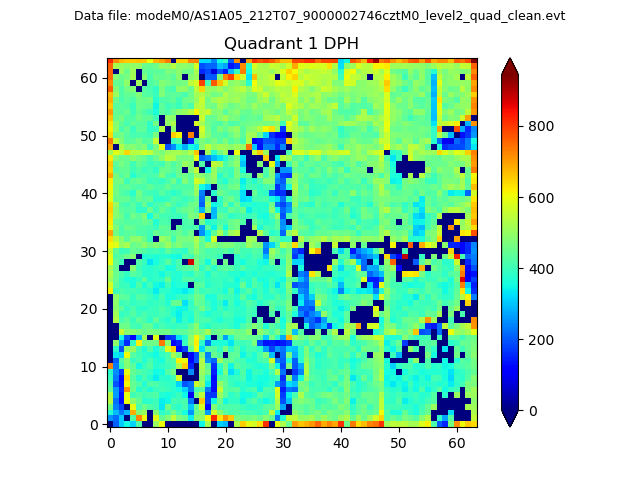 |
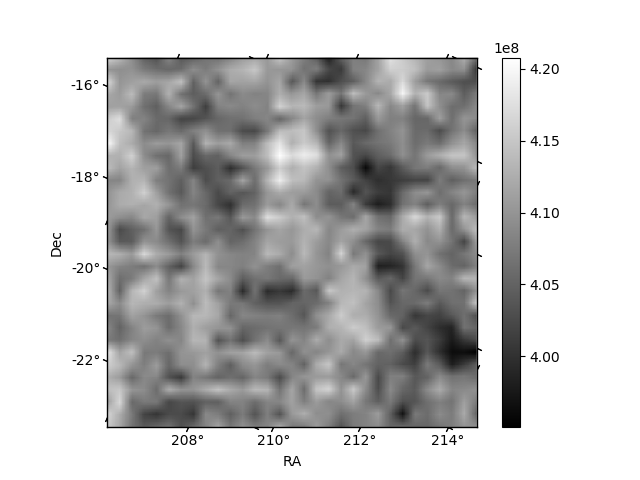
Quadrant B |
|---|---|---|---|
| Quadrant D | 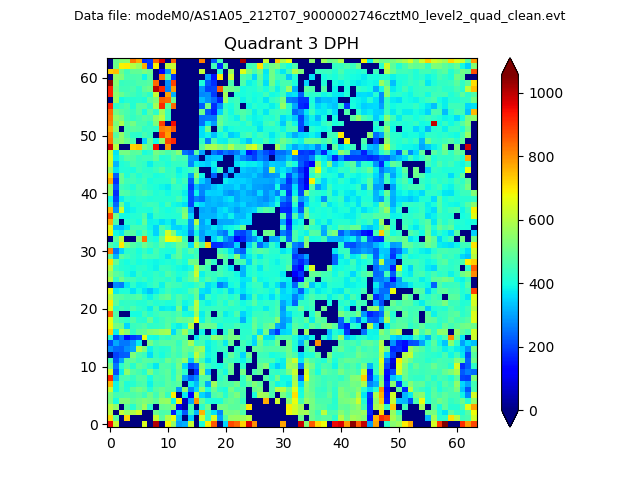 |
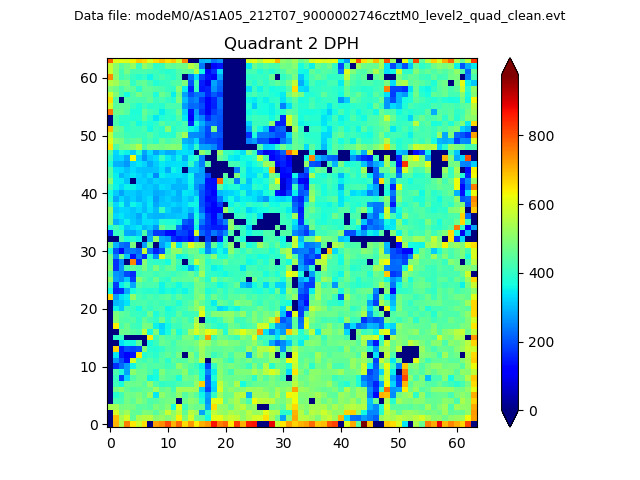 |
Quadrant C |
| Plot type | Count rate plots | Images |
|---|---|---|
| Comparison with Poisson distribution Blue bars denote a histogram of data divided into 1 sec bins. Red curve is a Poisson curve with rate = median count rate of data. |
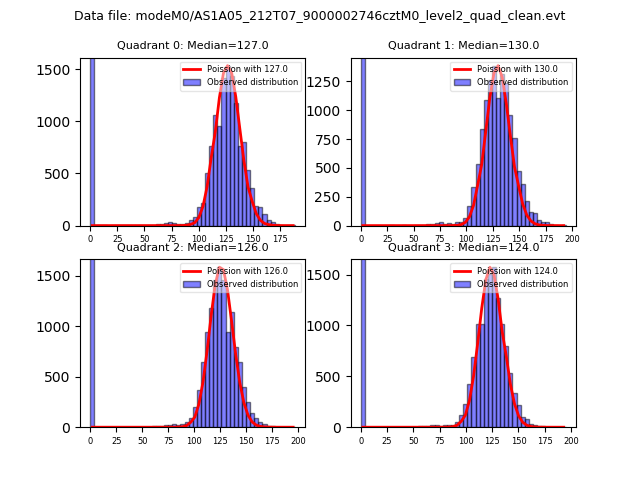 |
 |
| Quadrant-wise count rates Data is divided into 100 sec bins |
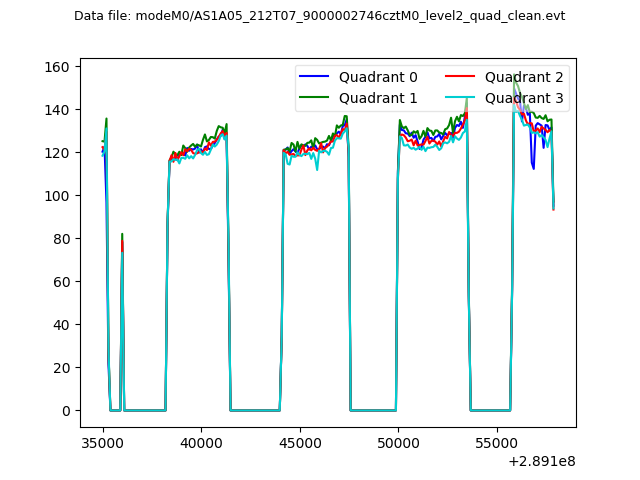 |
|
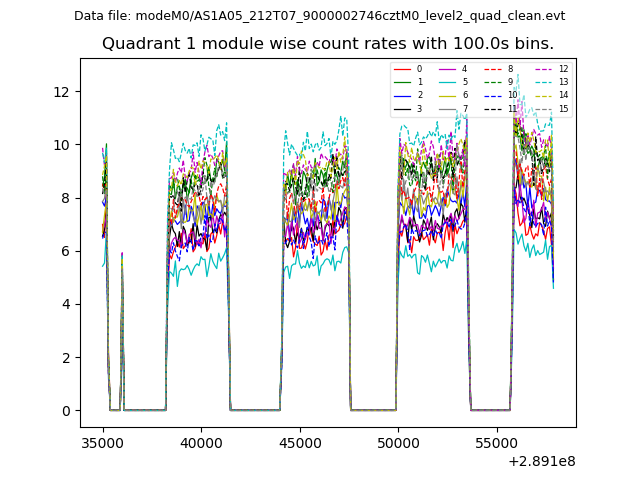
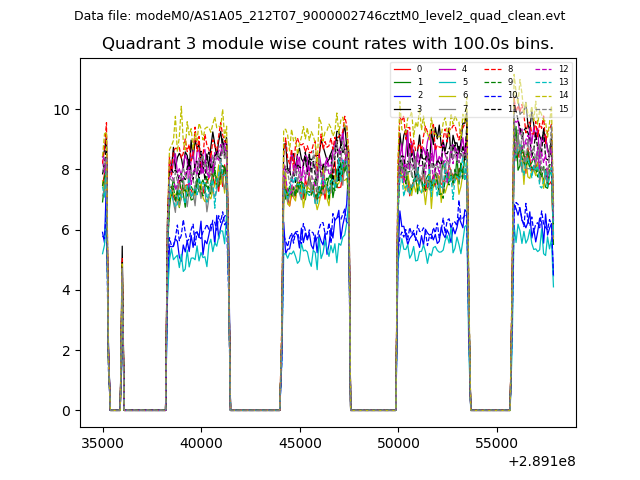
| Module-wise count rates for Quadrant A Data is divided into 100 sec bins |
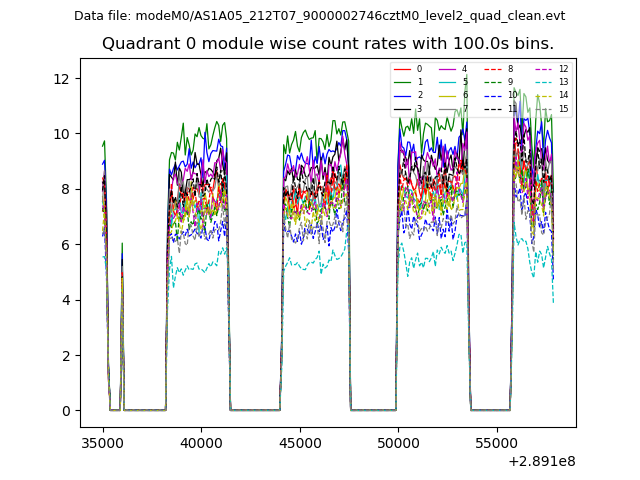 |
 |
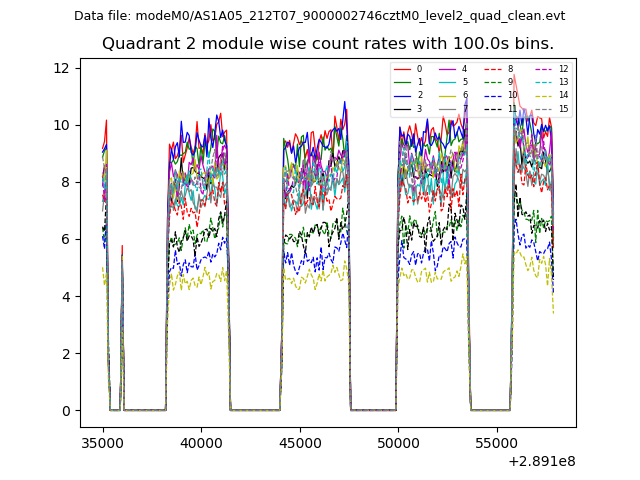
| Module-wise count rates for Quadrant B Data is divided into 100 sec bins |
 |
 |
| Module-wise count rates for Quadrant C Data is divided into 100 sec bins |
 |
 |
| Module-wise count rates for Quadrant D Data is divided into 100 sec bins |
 |
 |
| Parameter | Plot |
|---|---|
| CZT HV Monitor | 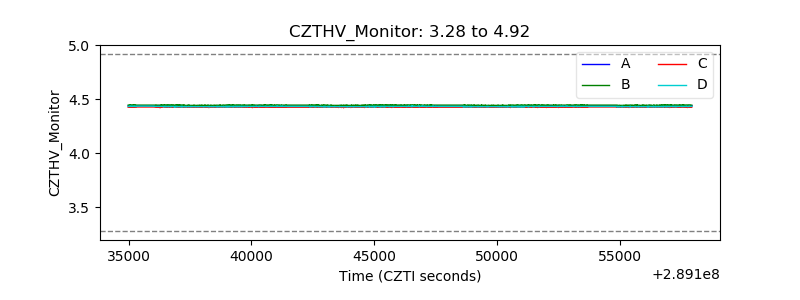 |
| D_VDD | 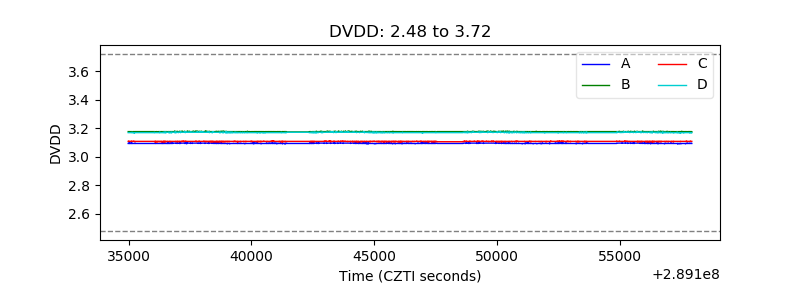 |
| Temperature 1 | 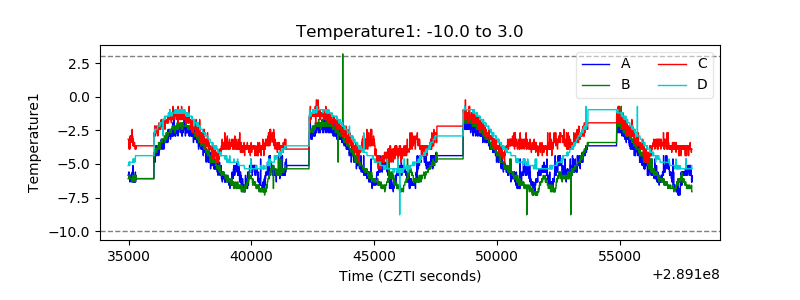 |
| Veto HV Monitor | 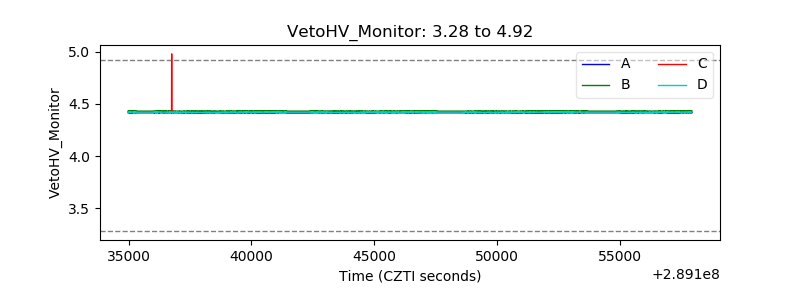 |
| Veto LLD | 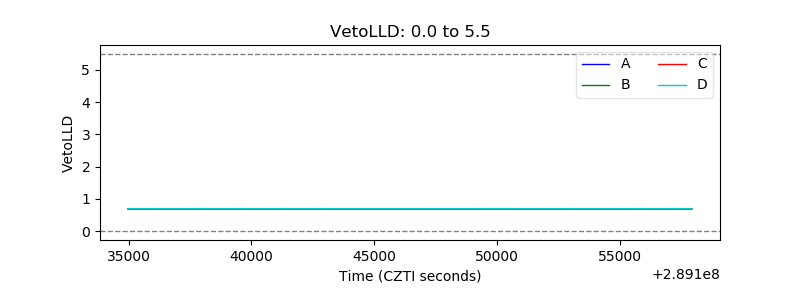 |
| Alpha Counter | 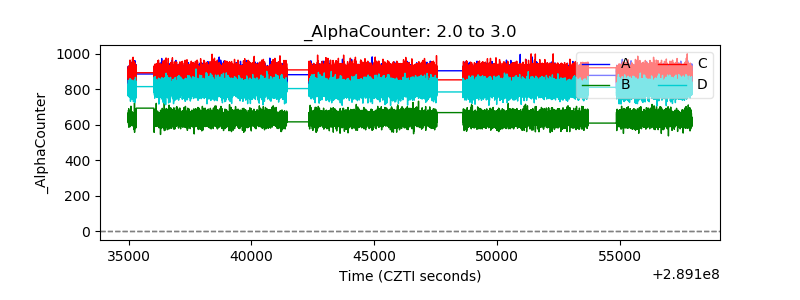 |
| _CPM_Rate | 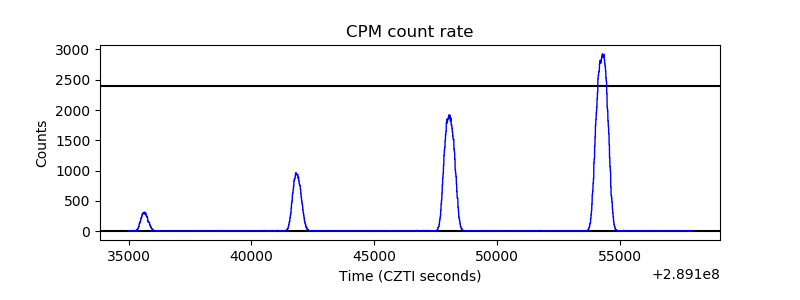 |
| CZT Counter | 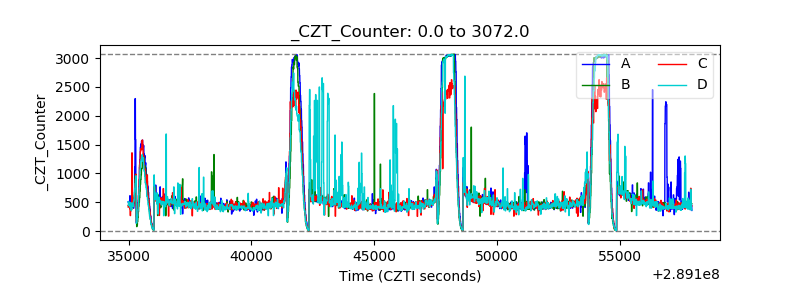 |
| +2.5 Volts monitor | 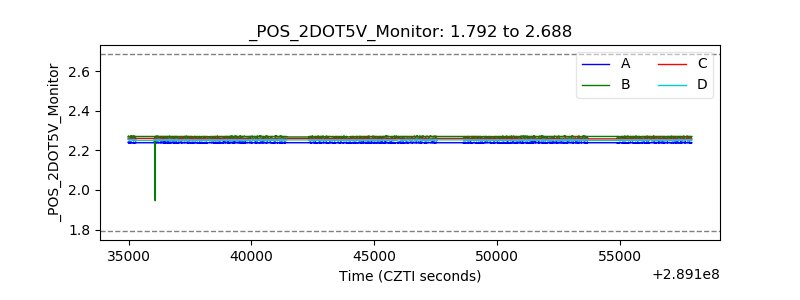 |
| +5 Volts monitor | 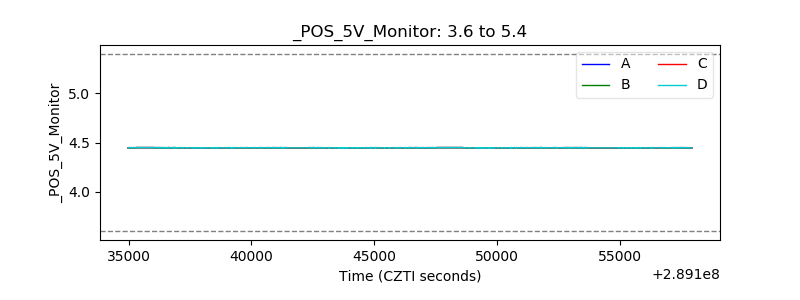 |
| _ROLL_ROT | 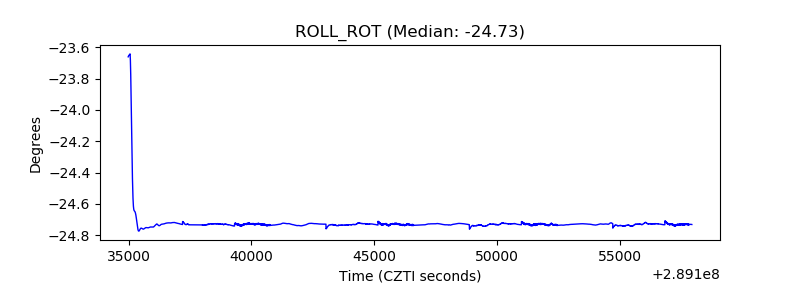 |
| _Roll_DEC | 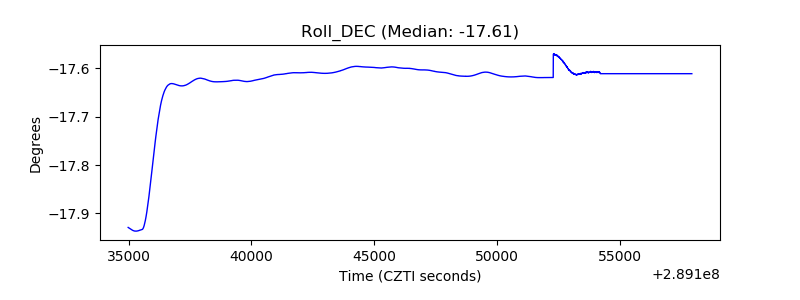 |
| _Roll_RA | 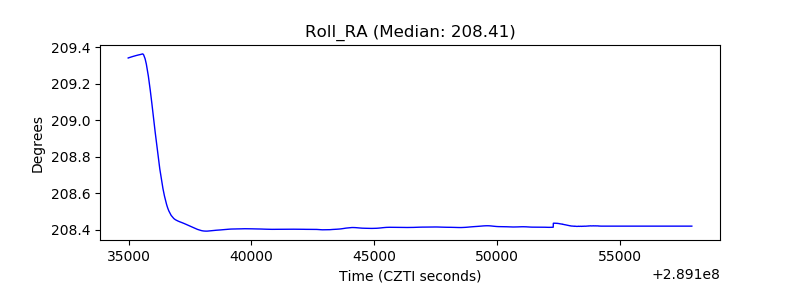 |
| Veto Counter | 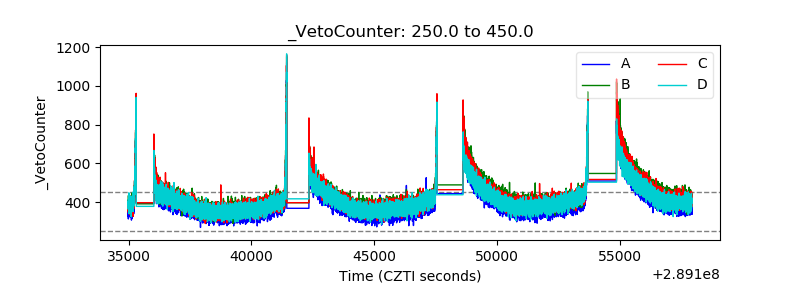 |